ArcUser - The Geographic Approach Matters More Than Ever 38 - The Magazine for Esri Software Users
←
→
Page content transcription
If your browser does not render page correctly, please read the page content below
Summer 2021

ArcUser
The Magazine for Esri Software Users

     The Geographic
   Approach Matters
   More Than Ever 38

       To Better Understand
                 the Earth 14
          South Korean City
       Uses a Digital Twin to
         Meet Challenges 20
UTILITIES AND LOCAL GOVERNMENT WITH

Create powerful systems of action
with Cityworks and ArcGIS.
Local government and utility organizations have no shortage of data. But turning that data into
actionable insights can sometimes feel … impossible. Cityworks is the leading GIS-centric public asset
management and permitting solution that leverages your investment in ArcGIS to make sense of the
complexity of data and create scalable systems of action for any workflow or vertical asset.

From IoT remote monitoring to enterpise asset management, you can easily track and visualize every
asset and its associated history, labor, costs, materials, permitting workflows, and so much more.

                                        Download your Guide to Enterprise Asset Management and
                                        request your personal demo at Cityworks.com/Esri
Contents                           Summer 2021 Vol. 24 No. 3

     Focus
     14   To Better Understand the Earth
     20 South Korean City Uses a Digital Twin to Meet
          Challenges
     24   Mapping Pikas’ Habitat to Help Save Them

14

     Special Section
     38 The Geographic Approach Matters More Than Ever

     42 Science Symposium Focuses on Biodiversity

38

     End Notes
     66 Saving Water, Money, and Time with GIS

     On the Cover
     Disproportionate Warming of the Artic, is an award winning entry in the
     Most Innovative Map category of the 2021 Esri User Conference Map
     Gallery. The map, in both static and animated versions, was created by
     Greg Fiske of Woodwell Climate Research Center using ArcGIS Pro. It
     visualizes temperature change as a substitute for true elevation in a 3D
     map, illustrating the disproportionate effect of climate change on the
     Arctic using the Representative Concentration Pathways (RCP) worst-case
     scenario RCP8.5. This scenario models very high baseline emissions to
     show a possible—though not the most likely—outcome in the absence of
     climate policy. The distorted globe represents the mean temperature dif-
     ference (C°) projected temperatures for the 2040–2060 time frame (under
     RCP8.5) minus temperatures for the 1880–1920 time frame. The map uses
66   data from the KNMI Climate Explorer, a web-based tool for researchers
     developed by the Royal Netherlands Meteorological Institute (KNMI), the
     Dutch national weather service.

                                      esri.com/arcuser Summer 2021 au           3
Act Now for the Future                                                                      ArcUser
                                                                                             Summer 2021 Vol. 24 No. 3

“Today our world is being challenged because
 humans are living recklessly and unsustainably,                                             Editorial
                                                                                             Editor Monica Pratt
 and this is threatening our future.“                                                        Contributors Jim Baumann, Carla Wheeler,
                                                                                             Citabria Stevens
                                                                Jack Dangermond              Technical Adviser Paul Dodd
                                                           Esri President and Founder        Copyediting Allan Mendiola
                                                           2021 Esri User Conference
                                                                                             Design
                                                                                             Creative Director James Hitchcock
                                                                                             Designer Doug Huibregtse
 We now live in an era that geologists and others have dubbed the Age of the
                                                                                             Illustrator Dan Gill
 Anthropocene because the imprint of human activity is so pervasive and so deeply
                                                                                             Photographers Eric Laycock, Eric Johnson
 etched into the Earth.
                                                                                             Print Coordinator Lilia Arias
    GIS professionals are uniquely equipped to appreciate this threat to our collective
 home and respond to it. They possess the geographic perspective needed to deeply            Advisory Board
 understand the complexity and interconnected nature of life on Earth and the creativity,    Corporate Marianna Kantor
 knowledge, and skills needed to develop strategies for dealing with these challenges.       Products Damian Spangrud
                                                                                             International Dean Angelides
    This process starts with a greater understanding of the Earth than we currently pos-
                                                                                             Marketing Communications Jeff Brazil
 sess. GIS is a fundamental tool for building this understanding. An article in this issue
                                                                                             Industries Damian Spangrud
 describes the release of the completed global ecological coastal units map, the third
 in a series of comprehensive maps that are defining the Earth’s ecosystems with data
 that is standardized in scale and quality. The maps provide a framework for critical ad-
 ditional research on Earth’s vast but understudied life and processes.
                                                                                             Read ArcUser Online
    During his keynote presentation at the Esri User Conference (Esri UC), Dr. Enric Sala
                                                                                             Visit the ArcUser website (www.esri.com/
 described the work of the National Geographic Pristine Seas team he leads. Its mission
                                                                                             arcuser) to download tutorials, read current and
 is to protect 30 percent of oceans in marine reserves by 2030. Protected areas not only     past issues, and access additional resources.
 safeguard biodiversity but underpin economic viability. By transforming overfished
                                                                                             Subscribe to ArcUser
 ocean “deserts” into thriving sources of fish, these marine reserves provide livelihoods
                                                                                             Residents of the United States can
 for people through tourism and fishing in adjacent areas where reestablished fish pop-
                                                                                             subscribe to the print edition of ArcUser at
 ulations have spilled over.                                                                 go.esri.com/subscribe.
    A keynote presentation by La June Montgomery Tabron, president and CEO of the
 W.K. Kellogg Foundation, explained how GIS supports the foundation’s work in creat-         Manage Your ArcUser Subscription
 ing a more sustainable society by identifying those societal structures that cause racial   Make changes to your subscription information
 inequality. The foundation engages communities through planning, intelligent study,         at go.esri.com/manage-subscriptions.
 and group action to produce better outcomes.
                                                                                             Advertise in ArcUser
    In closing his presentation on the Esri UC theme, GIS—Creating a Sustainable
                                                                                             For information regarding placing an
 Future, Dangermond urged the GIS community to become involved. “The human
                                                                                             advertisement in ArcUser magazine, contact
 population generally and the GIS community specifically are collectively responsible        the advertising coordinator at ads@esri.com.
 for the Earth’s future. That future could go in many directions. Achieving a sustainable
                                                                                             Editorial Inquiries
 future will require changing our priorities and applying the best science, technology,
                                                                                             Monica Pratt, ArcUser Editor
 and creative thinking.”
                                                                                             380 New York Street
                                                                                             Redlands, CA 92373-8100 usa
                                                                                             arcuser_editor @esri.com

                                                                                             Read the article submission guidelines at
                                                                                             https://bit.ly/3mwMRxc.

 Monica Pratt
 ArcUser Editor

                                                                                             ISSN 1534-5467
                                                                                             ArcUser is published quarterly by Esri at
                                                                                             380 New York Street, Redlands, CA 92373-8100        usa.
                                                                                             ArcUser is written for users of Esri software and
                                                                                             distributed free of charge to registered users.

 4    au Summer 2021 esri.com/arcuser
Departments
     Software and Data
     6    Briefly Noted
     8    Why You Should Share Your Data
     10   Increase the Value of Imagery in Your Organization
     12   AI Enables Rapid Creation of Global Land Cover Map

     Manager’s Corner
     26 How to Review a Geospatial Strategy

     30 Take Your ArcGIS Online Organization to the
          Next Level

     Developer’s Section
12   32 Six Ways to Visualize Change Over Time in Web Maps

     Hands On
     44 Customize Legends in ArcGIS Pro

     48 Update Your Basemaps from Raster to Vector

     50 The Importance of Margins of Error and Mapping

     54 Ten Tips for Tables in Layouts

     Bookshelf
     57   GIS for Science, Volume 3: Maps for Saving the Planet
     57   Women and GIS, Volume 3: Champions of a
          Sustainable World

     Faces of GIS
32
     58 Students Used GIS to Respond to the Great Flood
          of 2019

     Education
     62 Penn State’s Geodesign Students See Opportunities
          for Community Growth
     64 Textbooks and Resources for Educators

     65 ArcGIS Learning Available through Your LMS

62

                                esri.com/arcuser Summer 2021 au   5
Briefly Noted
High-Demand US
Datasets Are Widely
Available Online
A collection of valuable, authoritative data-
sets, referred to by government users as
National Geospatial Data Assets (NGDA),
will now be available to government and
private organizations.
This collection includes more than
75 national geospatial datasets on dams,
bridges, federal public lands, runways, rail
nodes, and more, which are regularly up-
dated from federal sources. Making this
data available to a wider audience will aid
governments in addressing challenges
such as climate change, disaster relief,
broadband access, and racial equity.
Wider availability of NGDA datasets benefits the commercial sector. Large companies This feature layer uses National
with assets and interests spread throughout the United States, from national retailers and Geospatial Data Asset (NGDA) data from
the Bureau of Transportation Statistics
insurance companies to railroads and utilities, need data that cuts across cities, states, and (BTS) to display National Bridge Inventory
regions. Having high-quality national datasets on hand will save organizations the time (NBI) information on bridges in the United
and money required to gather and process them. States and Puerto Rico. The data provides
the location, description, classification, and
An ArcGIS user license is not required to access this data. It is available under the general condition of each bridge.
Creative Commons Attribution 4.0 International (CC BY 4.0) license, so anyone can use,
share, and adapt the data with proper attribution. For interoperable access, these data-
sets will also be available as both Esri REST services and Open Geospatial Consortium,
Inc. (OGC), API Features. Esri will also be releasing the NGDA datasets through a custom
explorer app.
Esri supports the broader vision of the Geospatial Data Act of 2018 (GDA), which seeks
to empower more people to use geospatial data and break down barriers to interoperabil-
ity. The NGDA dataset is the second dataset Esri released to the public in 2021 that does
not require an ArcGIS license to access. In June, Esri released the first-ever high-resolution
(10-meter), 2020 global land-cover map. These open data services are provided through
ArcGIS Living Atlas of the World, the foremost collection of geographic information from
around the globe, including maps, apps, and data layers.
To learn more and explore the new NGDA datasets,
visit livingatlas.arcgis.com/esri_ngda_datasets/.
6 au Summer 2021 esri.com/arcuser
Software and Data
ArcGIS Users in the US Can Access More
Current and Precise Address Data
Esri is collaborating with Infutor Data Solutions to improve the geocoding and address
matching capability of the ArcGIS World Geocoding Service in the United States. Users in
any industry—especially insurance, telecom, health care, utilities, real estate, and retail—
will benefit from the increased precision of geocoding that comes from rooftop locations
for addresses and subaddress information for places with multiple units.
Infutor specializes in consumer identity management and identity resolution, and its
comprehensive spatial data includes validated, multisourced addresses and hyperprecise
geographic coordinates (latitude-longitude), allowing for deep location-based analysis
and decision-making.
New rooftop locations for the US became available for users of ArcGIS World Geocoding
Service, which benefits users of ArcGIS Pro, ArcGIS Enterprise, and ArcGIS Online and de-
velopers using ArcGIS Platform. Improved geocoding is also available in ArcGIS StreetMap
Premium.
New Legal Requirements Enable Collaboration
among EU GIS Community
Esri commended the European Union (EU) for its leadership in implementing Directive
(EU) 2019/1024 (Open Data Directive), which aims to encourage cross-border use of reus-
able data in Europe. Committing to a standardized open data policy framework will make
it easier for EU member states to access high-value datasets, such as geospatial, earth
observation, environmental, meteorological, statistical, mobility, and company ownership
data, in a trusted manner.
With open data, EU members can use application programming interface (API) web
services for access. At the unprecedented pace in which data is growing everywhere, the
new model enables a European single market for open data that will benefit all members.
As EU members finalize implementation of the Open Data Directive, geospatial tools must
support data catalog interoperability requirements for open data portals across Europe.
To broaden its support for the directive, Esri is expanding the capabilities of interop-
erable web service APIs, metadata, and ArcGIS Hub catalogs. Using international open
standards such as Data Catalog Vocabulary Application profile (DCAT-AP), European cus-
tomers can share data that conforms to the new Open Data Directive and more easily
expose their open data catalog and web services for reuse.
The inclusion of DCAT-AP 2.0.1, along with an extendable architecture on ArcGIS Hub,
will serve as a road map to support and guide geospatial technology users as they adopt
the legal requirements of the Open Data Directive. Geospatial data is transformative, and
the EU’s Open Data Directive has paved the way for greater accessibility and transpar-
ency. The changes will inspire exciting opportunities for member state collaboration and
innovation across Europe.
esri.com/arcuser Summer 2021 au 7
Why You Should
                              SHARE YOUR DATA
                              By Brent Jones

Data is                       This often-asked question              is discussed     of government data. It’s a long story that began
                              by government at all levels: local, state and feder-    when the US Census Bureau wanted to make
expensive to                  al. This discussion about sharing covers all kinds      census data collection and management more
                              of data that includes lidar, imagery, topography,       efficient.
create and                    land cover, land use, geology, hydrography, bio-           The bureau developed Dual Independent Map

maintain, so                  diversity, soils, survey control, place-names, ad-
                              dress, parcel, property characteristics, utilities,
                                                                                      Encoding (DIME), an encoding system for effi-
                                                                                      ciently storing geographic data. DIME became

why should                    and school district boundaries.
                                 Why don’t we want to share the data we create
                                                                                      a key component in the development of the
                                                                                      Topologically Integrated Geographic Encoding
I share my                    and maintain? There are many reasons we’re
                              hesitant.
                                                                                      and Referencing (TIGER) system created for the
                                                                                      1990 census. It is a digital database of geograph-
data?                            We’re proud of our data, and we want rec-            ic features such as railroads, rivers, lakes, street
                              ognition for our work. We don’t want our data           centerlines, and political and census boundaries.
                              misused. Maybe there are errors in the data that           TIGER data was shared with the public. Several
                              we don’t want to be made public. We’ve been             companies used this data to create commercial
                              working on collecting and improving our data for        products for addressing, mapping, routing, ge-
                              years. We pay for staff time, and it costs money        ocoding, and many other uses. The street data
                              to maintain servers, networks, and desktops.            we use today is developed from many sources,
                              Some of us sell data to help recoup costs and           using many collection techniques, but it all start-
                              use those funds for our departments.                    ed when the US Census Bureau shared its street
                                                                                      centerline data. As the bureau noted in 2014 on
                              It All Started with Data Sharing                        the 25th anniversary of the development of the
                              If you’re like me, the last time you took a trip, you   TIGER system, “The convenience of getting di-
                              used Waze so that you would be alerted to road          rections today on smartphones and tablets can
                              hazards, traffic, and speed traps. This informa-        trace its roots to the digital geographic database
                              tion is the product of data about traffic condi-        created 25 years ago by the US Census Bureau.”
                              tions shared by other drivers with Waze. This              There’s more to the story of data sharing. The
                              sharing enables greater efficiency for you and          Global Positioning System (GPS) was started by
                              others when traffic conditions change.                  the US Department of Defense in the early 1970s
                                 What you might not know is that the ease of          and overcame the limitations of earlier navigation
                              navigation afforded by Waze and other systems           systems. In May of 2000, GPS became more valu-
                              that we enjoy and rely on started with the sharing      able to the private sector and the general public

8   au Summer 2021 esri.com
Software and Data
when selective availability—the intentional deg- But unfortunately, not all data is collected Esri software users from
radation of location precision for nonmilitary at the same scale, level of detail, and degree around the world contribute to
the Community Maps program.
users—was turned off. This changed everything of accuracy, which makes combining data and
by enabling everyone to acquire highly precise sharing data in a consistent manner costly and
locations. Combining much more accurate GPS difficult. The challenge is to combine shared
with the commercialized street centerline data data with other data and deliver consistent data
eventually made possible maps and navigation and mapping across jurisdictions.
on smartphones. Few of the multitude of uses of There is a solution. Esri helps you share your
GPS and street centerline data were considered authoritative data and services with the wider
or even conceived of when these services and GIS community through the Community Maps
data were opened to the public. program, which contributes data to the ArcGIS
Today we share our address datasets with Living Atlas of the World. Once vetted and in-
emergency response systems, and everyone corporated, your data becomes part of a seam- Your data
benefits. When errors are detected and cor- less map of authoritative data that is consistent,
rected, the master address database is updated. up-to-date, and accurate and displayed using improves
As data becomes standardized and used by sophisticated cartography.
more organizations, it becomes more valuable. While your data and maps have been cre- ArcGIS
Duplicate datasets are eliminated, and reliable
authoritative data is established.
ated for specific reasons, your work can benefit
others by sharing it through the Community
Living Atlas
Often data becomes more valuable to others
than to the original owner and maintainer of the
Maps program. Your data improves the ArcGIS
Living Atlas and makes it more complete. The
and makes
data. To a 9-1-1 caller, the accuracy of address
data can be a matter of life or death.
utility of your data can be extended by adding
curated data and services that help users solve
it more
problems and make better decisions. complete.
A Better Way to Share Data In the tradition of government sharing data
But what about that other data we have? Street and services that laid the foundation for GIS,
data, digital elevation models, building foot- your data can become part of solutions to to-
prints, and especially parcel data are extremely day’s issues. Data sharing matters. Your con-
valuable for many government departments, tributions matter. Better maps and data help
local businesses, volunteer groups, individuals, us make better decisions. Contribute to the
conservation organizations, and others. Just Community Maps program. Learn how you can
about everyone can use good data. contribute at https://bit.ly/3cxDlY7.
esri.com Summer 2021 au 9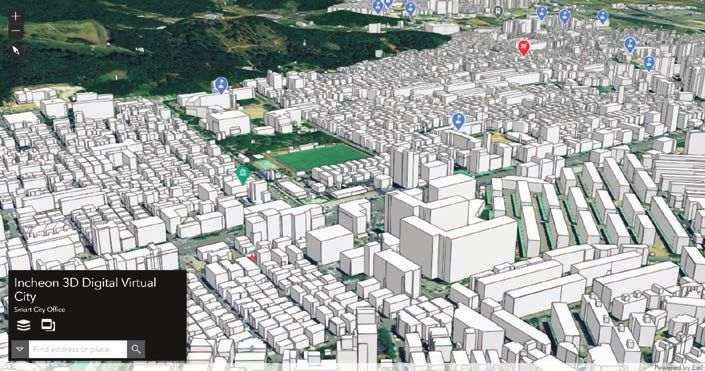
Increase the Value
of Imagery in Your Organization

With the release of ArcGIS Image for ArcGIS Online, organizations have
a quicker and easier way to integrate imagery into workflows. With this
newest addition to the ArcGIS Image suite of products, users can host,
visualize, analyze, share, and collaborate imagery content from within
ArcGIS Online, Esri’s software as a service (SaaS) product.

An extension to           ArcGIS Online, ArcGIS Image for ArcGIS           Making Imagery More Available
Online makes imagery more accessible and more easily managed               Because it frees organizations from acquiring and maintaining
while eliminating the need for an organization to maintain infra-          the infrastructure needed to process imagery, ArcGIS Image for
structure for imagery. Uploaded imagery and the results of analysis        ArcGIS Online makes the power of imagery in GIS workflows avail-
are saved as image services so that they can be shared and used in         able to many more organizations and many more people in those
ArcGIS throughout an organization.                                         organizations.
   Imagery uploaded to ArcGIS Image for ArcGIS Online can be saved            Object detection is just one of the raster analysis tools that
as a tiled imagery layer or as a dynamic imagery layer. Layers of either   comes with ArcGIS Image for ArcGIS Online. Using this tool,
type can be used as input for raster analysis. Both layer types retain     feature extraction from imagery hosted using ArcGIS Image for
pixel information, pixel values for any location, and image metadata.      ArcGIS Online can take advantage of deep learning capabilities to
   Static tiled imagery layers are more efficient for viewing and sup-     automate the process and seamlessly use the library of deep learn-
port client-side processing and rendering. Dynamic imagery layers          ing models already available from ArcGIS Living Atlas of the World.
support on-demand server-side processing, dynamic mosaick-                 This capability makes change detection analysis of the built and
ing, and image collection management. By returning only what is            natural environments accessible to governments as well as private
needed to display the current extent, dynamic imagery layers can           and nongovernmental organizations.
deliver good performance over low-bandwidth networks.                         Access to current imagery provides critical information during
   Layers of either type can be built from a variety of raster formats     disasters and emergencies. Imagery can be applied to asset and
sourced from many providers. ArcGIS Image for ArcGIS Online                infrastructure inventory as well as to monitoring and evaluating the
can handle overlapping, temporal, and multiresolution imagery.             condition of vegetation, whether cropland or natural landscapes.
Different enhancements and renderings can be set for layers.               Analyzing imagery can identify optimal paths and connections be-
                                                                           tween areas, whether they are road networks or wildlife corridors.
Opening Up the Use of Imagery                                              Imagery contributes to analysis workflows that forecast available
ArcGIS Image for ArcGIS Online liberates imagery that organiza-            water supply, evaluate the environmental impacts of planned pro-
tions may have locked away in hard drives or stored in disparate           jects, and design roads and storm drains.
locations. Making imagery readily accessible increases its value              These are just a few ways imagery can contribute to achieving
by making it usable to many more people in an organization.                an organization’s goals when both tools and imagery are acces-
Imagery—hosted, managed, and streamed from ArcGIS Image for                sible. ArcGIS Image for ArcGIS Online can be scaled for specific
ArcGIS Online as tiled and dynamic imagery layers—are ready for            types of users in an organization. The level of complexity for users
immediate visualization and analysis.                                      can range from providing an intuitive web experience viewing and
   Eliminating the infrastructure—both staff and hardware—                 managing imagery to producing a processing workflow using the
needed to manage imagery and replacing it with a secure, scal-             Raster Function Editor in ArcGIS Online to chain one or more raster
able, and performant cloud environment managed by Esri lets staff          functions together. Custom raster functions can also be created
focus on finding solutions instead of maintaining processes.               using the ArcGIS API for Python.

10   au Summer 2021 esri.com/arcuser
Software and Data
Imagery hosted in ArcGIS Image for
ArcGIS Online was used to create an app for
a suitability analysis that lets stakeholders
set criteria using sliders.
Creating an image layer is a simple,
guided process of choosing the layer type,
configuring it, defining the imagery, and
setting item details.
Access to current
imagery provides
critical information
during disasters
and emergencies.
Part of a Robust Strategy for Managing and
Using Imagery (AWS) or Microsoft Azure cloud, making these collections easier
ArcGIS Image for ArcGIS Online joins ArcGIS Image Analyst for to manage and use. ArcGIS Image Dedicated is a SaaS offering
ArcGIS Pro, ArcGIS Image Server for ArcGIS Enterprise, and ArcGIS managed by Esri.
Image Dedicated. These products provide tools and services for ArcGIS Image for ArcGIS Online is available as an extension for
comprehensive imagery data management, visualization, and anal- the Creator or GIS Professional user type for an existing ArcGIS
ysis of imagery on the desktop, in ArcGIS Online, in an enterprise, Online organizational account. User types allow organizations to
or, with ArcGIS Image Dedicated. control the type and extent of privileges assigned to members
ArcGIS Image Dedicated brings processing, analytics, and through roles. Once a license has been purchased, ArcGIS Image
streaming capabilities directly to existing imagery collections for ArcGIS Online can be managed from the Licenses section of
that an organization already has stored in Amazon Web Services the Organization tab. Purchase this license at https://bit.ly/3ry11C1.
esri.com/arcuser Summer 2021 au 11AI Enables Rapid Creation of
Global Land Cover Map
In June 2021, Esri released a new modeling, and resource management The dataset included more than 24,000
high-resolution 2020 global land cover planning. National government resource five kilometer by five kilometer areas from
map and made it available to everyone on agencies can use land cover as a basis for all the world’s major biomes. The model was
the ArcGIS Living Atlas of the World. The understanding trends in natural capital and run on six bands of Sentinel-2 surface reflec-
Esri 2020 Land Cover map is the first map help define land planning priorities such as tance data: one band each of visible blue,
to possess this level of comprehensive- food production or conservation. green, red, near-infrared, and two short-
ness, currency, and detail, and it is a vital wave infrared bands. The 10 classes gener-
resource for better understanding and pre- A New Methodology ated are water, trees, grass, flooded veg-
serving the world. Typically, the value of land cover maps is etation, crops, scrub/shrub, built area, bare
With its 10-meter resolution, this map diminished because the time between ground, snow/ice, and clouds (unclassified).
can be used to help determine the char- data acquisition and map availability can To create the final map, the model was
acteristics of a particular place and answer span several years. However, the use of ar- run on multiple dates of imagery through-
questions such as these: tificial intelligence (AI) allowed this global out the year, and the outputs were compos-
• Is an area bare ground or is it covered by land cover map to be produced in less ited into a final representative map of 2020.
trees or water? than a week. The complete global run was approximate-
• Does it contain buildings or other The Esri 2020 Global Land Cover map was ly 1.2 million core hours of compute time.
infrastructure? built using European Space Agency (ESA) To complete the task in approximately a
• How has it changed over time? Sentinel-2 satellite imagery. It was created week, Microsoft Azure Batch was used to
To support answering these and other using a deep learning AI land classification run up to 6,400 cores simultaneously.
questions, high-resolution, open, accu- model developed by Impact Observatory, The new map will be updated annually,
rate, comparable, and current land cover on a massive training dataset of more than supporting change detection and highlight-
maps are critical for decision-makers in five billion labeled image pixels developed ing planetary land changes, especially relat-
many industry sectors and nations with by the National Geographic Society. The ed to the effects of human activity. Later in
low- and middle-income economies. This global map was produced by applying 2021, Esri and Impact Observatory will make
will enable the surface of the earth to be this model to the Sentinel-2 2020 scene this new land cover model available to sup-
characterized and classified into a manage- collection, processing more than 400,000 port on-demand land cover classification,
able number of categories to identify and Earth observations of Land Use/Land allowing the GIS community to create new
better manage resources. Cover (LULC)—approximately 500 tera- land cover maps for project areas as often
Mapping the Earth’s surface will assist bytes of imagery—hosted in the Microsoft as every week. This model will empower
with land-use planning, hydrologic Planetary Computer. land managers and disaster response or-
ganizations that need to monitor change in
Land cover classification shows how cropland extends up to to the circular boundary of a specific area of interest, provide near real-
the forested Egmont National Park in New Zealand. time environmental situational awareness,
or look at long-term change and seasonal
differences in land cover.
Benefits and Uses
Publishing the Esri 2020 Land Cover map as
a tile imagery layer on ArcGIS Living Atlas
of the World makes it available for visualiza-
tion and analysis in ArcGIS Online, ArcGIS
Pro, and other client applications. GeoTIFF
tiles of the layer can also be downloaded in-
dividually for areas of interest, or the entire
60 GB collection can be downloaded with
a single click. Esri released this valuable re-
source under a Creative Commons license
so that it can be downloaded by anyone.
12 au Summer 2021 esri.com/arcuserSoftware and Data
that may be susceptible to storm surge.
• Intersecting land cover and species rich-
ness layers to determine conservation
priority areas
Planners worldwide will be able to better
understand site geography and make more
informed decisions. Getting this data into
people’s hands is a key component of this
mapping initiative. More than 10 million
GIS users have direct access to it via web
services in ArcGIS Living Atlas of the World.
Although the global land cover map has
only been available since June 2021, or-
ganizations are already benefiting from it.
Rafael Monge Vargas, director of Centro
Nacional de Información Geoambiental,
noted that, “Understanding the most up-
to-date land-use and land cover informa-
tion of Costa Rica at 10-meter resolution
is a groundbreaking input for our national
planning processes, including for the de-
velopment of ‘maps of hope’ that identify
Costa Rica’s essential life support areas—
where the implementation of nature-based
solutions can lead to greater environmen-
tal, economic, and social benefits.”
Access the Esri 2020 Land Cover layer at
https://bit.ly/3rpuXjr or learn more about it
at https://livingatlas.arcgis.com/landcover/.
This section of the global land cover map shows an unprecedented level of detail,
differentiating built areas, crops, water, and flooded vegetation for the area surrounding
Kolkata (Calcutta), India.
Center-pivot irrigation systems in western Saudi Arabia turn the desert into a polka-dot
pattern of farmland.
“This is a critical year for climate action,” Users can visualize and analyze the land
said Jack Dangermond, Esri founder and cover data in association with population,
president. “With the UN Climate Change hazard, terrain, hydrology, weather, and
Conference of the Parties [COP26] bringing other GIS layers, available in ArcGIS Living
international parties together to address a Atlas of the World or from their own or-
set of common goals, we are happy to do ganization. A consistent map of land cover
our part in making this map available to for the entire world can be combined with
users who are working toward the health of other data layers for green infrastructure,
our planet.” sustainability projects, and other conserva-
This data is globally consistent, which tion efforts that require a holistic picture
allows for comparisons across country of both the human and natural footprint
boundaries, and it is complementary to on the planet. Examples of these types of
existing national data, filling data gaps in projects could include the following:
remote and less-developed areas where • Computing the percentage of land in
detailed recent data may not be available. a watershed categorized as built area,
Using this 2020 land cover data can help which will contribute to faster rainfall
countries identify national priorities and runoff and increased flood risk.
support national and subnational level • Identifying coastal areas of built area and
reporting. crops less than three meters in elevation
esri.com/arcuser Summer 2021 au 13TO BETTER Understand THE EARTH By Monica Pratt With the release of ecological coastal they are changing. This data is vital to GEO BON is GEO’s Biodiversity units (ECUs), another tool for understand- identify areas that must be protected and Observation Network, and GEO Global ing the Earth is available. Created for map- others that need to be managed in a more Ecosystem Initiative (GEO ECO) is an ini- ping and analyzing the world’s coastal sustainable fashion. tiative to map and monitor global ecosys- regions, ECUs are the most recent develop- While an abundance of ecosystem tems. A high-resolution, standardized, and ment in an ongoing effort to create a global data has been gathered, it has not been practical map of global ecosystems for framework for understanding ecosystems available at a global extent that was cre- terrestrial, marine, and freshwater environ- on land, ocean, and shoreline that provide ated with standardized scale and quality. ments is an initiative of GEO ECO. Roger the services that support life on earth. GIS Previously, no organization had undertaken Sayre, senior scientist for ecosystems at the plays a vital role in building, visualizing, and ecological base mapping on a global scale US Geological Survey (USGS), was asked to using this framework for better understand- using standardized units and terminology. lead the US portion of this initiative and a ing ecosystems and preserving them. Without a shared language for reference, team that was composed of scientists from Completely mapping the Earth in a it can be difficult or impossible to develop USGS and various academic institutions as standardized and rigorous manner is es- understanding. well as geographers, analysts, cartogra- sential for tackling global challenges, such The need for the first comprehensive phers, and software developers from Esri. as climate change and the preservation maps that define all of Earth’s ecosystems of biodiversity, which are becoming more was recognized and supported by the Beginning on Land pressing concerns. Accurate geospatial Group on Earth Observations (GEO), a In 2013, USGS and Esri began this formi- information will make it possible for scien- partnership of more than 100 national gov- dable undertaking by mapping ecological tists, land managers, conservationists, de- ernments and more than 100 participating land units (ELUs). They built a GIS of world velopers, and the public to understand the organizations that work to create innova- landforms using a 250-by-250-meter grid current state of ecosystems and contribute tive solutions to global challenges that that contained 3.5 billion cells. A collection to a more profound understanding of how transcend national boundaries. of historical maps was used to validate and 14 au Summer 2021 esri.com/arcuser
Focus
corroborate this data. The USGS and Esri
vetted each of the input datasets, ensuring
that each was the best available at the time,
and evaluating each for data quality.
More than 105,000 ecological facets de-
scribing those cells were identified. These
facets represent unique combinations
of land cover, lithology, landform type,
and climate. The facets were integrated
based on different aspects of a terrestrial
ecosystems—climate regime, soil mois-
ture, geology, landform, and the organ-
isms present—and aggregated into 4,000
ELUs, using GIS to create a geographic set
of ecosystem areas that can be visualized
and analyzed. ELUs were first made pub-
licly available in 2015.
ELUs were the beginning of a global
framework. They fill the gap between
micro and macro views with medium-scale
data that is useful for studying ecological
Ecological coastal units (ECUs) cover the unique and extensive coastal region, which
diversity, rarity, and evolutionary isolation. differs greatly from terrestrial and open ocean environments. ECUs data is available from
Data at this scale is especially valuable the Global Islands Explorer.
esri.com/arcuser Summer 2021 au 15 Released in 2016, ecological marine units (EMUs) delineate physically and chemically distinct regions of the open ocean and note
variations in temperature, salinity, oxygen, and nutrients.
for conservation and preservation plan- To ameliorate this situation, a public- using a multivariate statistical method and
ning. By establishing common units and private partnership built the EMUs. The then verified by leading oceanographers.
shared terminology, ELUs enable greater partnership was led by Esri and USGS in Released in 2016, EMUs delineate physi-
collaboration. collaboration with NatureServe, the Marine cally and chemically distinct regions of the
Mapping of the ELUs was based on Conservation Institute, the University of open ocean and note variations in tempera-
structural elements, rather than biological Auckland (New Zealand), GRID-Arendal ture, salinity, oxygen, and nutrients. They are
assemblages. Once species distribution (Norway), Duke University, the Woods Hole a standardized, rigorous, and ecologically
data has been incorporated, researchers Oceanographic Institution, the National meaningful set of ocean ecosystem units
will be able to explore questions about Institute of Water and Atmospheric that may be used as a basemap for climate
the carrying capacity of areas. This Esri Research (NIWA), the United States change impact studies, biodiversity priority
Story Maps Journal (https://arcg.is/1SLKai) National Oceanic and Atmospheric setting, economic and social valuation stud-
provides more information on the creation Administration (NOAA), and the United ies, research, and marine spatial planning.
and use of ELUs. States National Aeronautics and Space In describing the unique value of EMUs,
Administration (NASA). Esri chief scientist Dawn Wright, who led
A Framework for Understanding The project establishes a 3D point mesh Esri’s efforts on the project, said, “The
Oceans framework spanning 52 million points and strength of EMUs is that they differ from
The work of the initiative moved from amassed global measurements of six key existing maps of marine ecoregions or bio-
Earth’s landmass to its oceans with the variables of the ocean’s water column over geographic realms by being globally com-
development of the ecological marine a 50-year period. The creation of EMUs was prehensive, quantitatively data driven, and
units (EMUs). As the repository of almost all a big data project. EMUs represent data truly 3D.”
water on the planet, oceans are critical to aggregation and computation on an un- This is data that can help inform the
the well-being of the planet and its inhabit- precedented scale. Climatology data was actions of conservation-minded organiza-
ants because of their impact on climate and extracted at one-quarter degree by one- tions, academic institutions, and scientists,
weather and their role as a major source of quarter degree intervals (or approximately who are working to preserve marine envi-
food. Yet, despite this undeniable impor- 27 kilometers by 27 kilometers as measured ronments. NOAA’s World Ocean Atlas is
tance, it is estimated that only 10 percent of at the equator) at variable depths before the primary data source for EMUs. They
oceans have been explored. being spatially analyzed and clustered are easily accessed from Ecological Marine
16 au Summer 2021 esri.com/arcuserFocus
Unit Explorer apps via the web browser essential for meeting the United Nations differences in coastline properties. The
and mobile devices and can be download- (UN) 2030 Agenda for Sustainable initial step in this process was the develop-
ed by joining the ArcGIS Online Ecological Development and its 17 Sustainable ment of a brand-new 30-meter resolution
Marine Units group. This Esri Story Maps Development Goals (SDGs), Specifically, image-derived map of Earth’s coastlines.
Journal (https://arcg.is/0GTzSH) provides ECUs support SDG 14, Life Below Water This effort was necessary because the
more information on EMUs. goal, which calls for the sustainable man- coastline characterization then available
agement and protection of marine and was inadequate in terms of accuracy, spa-
Between Land and Sea coastal ecosystems and the conservation tial resolution, comprehensiveness, and
While the 27 kilometer by 27 kilometer res- of at least 10 percent of coastal and marine the visual fit of the coastline vectors to the
olution of EMUs is relatively fine for open areas. Achieving this goal requires a com- shore of existing noncommercial global
ocean data, the much higher 1 kilometer prehensive inventory of coastal ecosystems shoreline datasets.
resolution was needed for coastal areas. and a strategy for determining the 10 per- In a 2019 interview, Sayre said, “We
The team that produced the EMUs devel- cent of ecosystems to be preserved. needed a coastline vector as the spatial
oped a separate and independent effort to According to estimates by the United backbone for this project, so we went
delineate global ECUs in 2018. Nations, nearly 2.4 billion people or about into the cloud and extracted a brand-new
This new map covers the unique and ex- 40 percent of the world’s population cur- global shoreline from 2014 Landsat im-
tensive coastal region, which differs greatly rently lives within 100 kilometers of the agery. Looking at this new global shoreline,
from terrestrial and open ocean environ- coast, where they are at risk from flooding it occurred to us that since every landmass
ments. In addition to the coastline itself, caused by sea level rise. Understanding on the planet is an island, no matter how
the global coastal zone includes the terres- coastal regions will be necessary to limit the big it is, we were sitting on a new global
trial ecosystems and marine ecosystems on social, economic, and environmental costs islands database.” The 2014 annual com-
either side of the coastline. of sea level rise that analysis has shown will posite Landsat imagery was used because
Understanding coastal zone ecosystems likely to increase within the next decade. it dilutes the effect of clouds in imagery.
is critical to sustainability efforts and can The result was the global shoreline vector
help mitigate the environmental, eco- Creating ECUs (GSV) and the global island dataset derived
nomic, and social effects of climate change. To build ECUs, the team took a coastline from GSV through the application of poly-
Understanding coastal ecosystems is segmentation approach in analyzing the gon topology. GSV was developed using
Ecological land units (ELUs) were the beginning of a global framework. They fill the gap between micro and macro views with
medium- scale data that is useful for studying ecological diversity, rarity, and evolutionary isolation.
esri.com/arcuser Summer 2021 au 17 ECUs join ELUs and EMUs in supporting the creation of a set of standardized, rigorous, and ecologically meaningful maps. a semiautomated supervised classification Data Committee (FGDC). big data techniques to synthesize and approach using big data techniques. CSUs were statistically clustered into classify ecologically important data layers Because Landsat imagery was already 16 groups that are globally similar as de- into distinctive and meaningful georefer- available in the cloud, the need to house scribed by the 10 variables. This process enced units. and manage vast amounts of imagery was yielded ECUs, standardized data that The next steps in creating this framework eliminated. facilitates comparison on an apples-to- for understanding Earth will be the crea- This process captured data for hundreds apples basis and collaboration between tion of global ecological freshwater units of thousands of islands that were missing organizations. (EFUs) and, possibly, ecological benthic from previously created datasets. By de- units (EBUs). veloping the Global Islands Explorer (GIE) A Valuable Resource These global ecological units are power- (https://rmgsc.cr.usgs.gov/gie), USGS and Although created as inputs for generat- ful and valuable to a much broader universe. Esri made this new global data on islands ing ECUs, CSUs are valuable in efforts to They help promote a more profound under- accessible. Using this tool, 340,691 islands understand coastal ecosystems. CSUs standing of the Earth that has potential for can be visualized and queried. provide a descriptive global inventory of informing more sustainable decisions by From GSV, four million, 1-kilometer coastal ecological settings that have man- governments, the private sector, and non- segments were generated. These seg- agement utility at local scales because they governmental organizations. ments served as the basis for subsequent use data at the highest available spatial analysis. Each segment was attributed with resolution. ECUs are exploratory and pre- About the Author 10 variables that described the ecological liminary units that have utility for global as- Monica Pratt is the founding and current settings for that segment. Those segments sessments, especially for the 30 x 30 goal to editor of ArcUser magazine, the executive were classified into 81,000 unique coastal preserve 30 percent of land and 30 percent editor of ArcNews magazine, the editor of segment units (CSUs) based on the Coastal of the oceans as well as the UN SDGs. Esri Globe, and head of the publications and Marine Ecological Classification ECUs join ELUs and EMUs in supporting team at Esri. She has been writing on tech- Standard (CMECS), a framework for organ- the creation of a set of standardized, rigor- nology topics, specializing in GIS, for more izing information about coasts and oceans ous, and ecologically meaningful maps. All than 30 years. Before joining Esri in 1997, and their associated living systems, which have been produced using an approach she worked for newspapers and in the fi- is endorsed by the Federal Geographic that is objective and repeatable, and uses nancial industry. 18 au Summer 2021 esri.com/arcuser
®

QUICKLY. ACCURATELY. AFFORDABLY.

          E   S

                      Made in Canada
South Korean City
Uses a Digital Twin
to Meet Challenges
By Greg Milner
A South Korean city is using a digital twin to become a truly smart city by
using its geospatial infrastructure to engage its agencies and the public to
help meet challenges, both present and future.
Incheon Metropolitan City, one of the largest cities in the region caused by climate change intensifies the threat of other
Republic of Korea, is home to three million people and a sizeable foreign mosquito-borne diseases, including malaria, yellow fever,
population of mosquitoes. Exactly how many of the latter is dif- West Nile fever, and Japanese encephalitis.
ficult to say, but it is a question that interests the country’s public Downtown Incheon was the representative urban area in a recent
health officials. study that examined how climate change is affecting the mosquito
Located on the northwest coast of South Korea, near Seoul, population on the Korean peninsula, and whether there was a cor-
the nation’s capital, Incheon is a major industrial center. Incheon relating effect on disease spread. For three years, a monitoring
anchors the western side of the Seoul Capital Area, the world’s system logged mosquito captures, transmitting the real-time data
second-largest megaregion. As the world continues to urbanize, over a Long-Term Evolution (LTE) network to ArcGIS GeoEvent
the region will get more crowded. Server. [LTE is a 4G wireless broadband standard that is used by
In this age of global pandemics, Incheon is also the gateway city mobile devices to connect to the internet from cellular towers.]
to South Korea, with one of the world’s busiest international airports. System data can be cross-referenced with other geographic data,
“Due to the growth of overseas travel and global logistics, Incheon such as real-time feeds from the national weather service.
needs to be very careful about infectious diseases,” said Jo Gi- “We’re using an ArcGIS dashboard to monitor all this data to-
woong, a GIS expert who oversees Incheon’s smart city initiatives. gether,” Jo said. “We share the information with related agencies
In recent years, South Korea has experienced an uptick in to quickly identify vulnerable areas, so that the problem can be
dengue fever, which is carried by mosquitoes. Warming in the intensively and preemptively controlled.”
20 au Summer 2021 esri.com/arcuserFocus
On the question of whether climate change was creating GIS work for the city of Incheon. By 2018, a “data-based adminis-
more mosquito-borne illnesses, the study was inconclusive. But tration,” as Jo called it, was essential policy in Incheon. The next
the monitoring system itself was an example of an extraordinar- step, as Jo saw it, was to put all these departments on the same
ily forward-thinking smart-city experiment unfolding in Incheon. page using a digital twin.
Under Jo’s leadership, the city has built a digital twin, which was As a first step toward that goal, Incheon’s smart city department
introduced in early 2021. oversaw the construction of a 3D basemap as the foundation for
Digital twins are virtual representations of the processes, rela- the city’s digital twin. “It’s all about the data, and we decided that
tionships, and behaviors of real-world systems. The concept began for a digital twin, we needed very elaborate data to understand
as a way for manufacturers to record and log the intricate function- and capture a high-density city,” Jo explained. After considering
ing of factories. Industrial designers began to use digital twins to several options, Jo’s team decided to capture precise point cloud
visualize the effect of proposed changes to an object or process. data by using lidar to scan the entire city. That would produce data
More recently, the digital twin concept has been applied to urban at a scale of 150 points or more per square meter.
planning. Virtual 3D models of cities, augmented by local informa-
tion, provide a means of proposing, understanding, and analyzing Throughout the process of creating the digital twin, Jo and
development projects and other changes to the urban landscape. his team concentrated more on data creation and management,
Incheon’s digital twin attempts to mirror many of the city’s func- and less on developing a system architecture that was unique to
tions in real time. The real-world system it duplicates is nothing the Incheon project.
less than Incheon itself. In this context, mosquitoes are not just “Some organizations, when building a digital twin, spend more
pests and disease vectors; they represent one more dynamic on system development and the integration side than on the data,”
system in a city that contains many, ranging from power grids to he said. “But we decided to use web scenes. It’s not perfect for
weather activity. To varying degrees, these systems all affect—and Korean conditions, but I think it’s the best solution, because the 3D
are affected by—the others. The digital twin is an ongoing record basemap and data built by our city can be infinitely expanded.”
of the processes and interactions of these systems. By the end of 2020, the virtual city was nearing completion,
ready to become a true digital twin. Waterworks Headquarters
The use of GIS for government functions in South Korea Incheon Metropolitan City was the first local office to import its
dates back to the 1990s, when several high-profile gas explosions data into the digital twin. Using Portal for ArcGIS, a component
revealed the need for greater understanding of underground of ArcGIS Enterprise, the department deployed a water utility
critical infrastructure. “These disasters
were caused by negligence in safety man-
agement and a lack of proper guidance,”
Jo explained.
Municipalities across the country in-
vested in GIS tools for surveying and map-
ping infrastructure, but not for gathering,
sorting, and sharing data. For city man-
agers, the costs of managing data were
prohibitive.
Jo’s expertise combines land manage-
ment, which he studied in the 1980s, and
computer engineering, which he later
pursued. The development of Internet
of Things (IoT) sensors and strong mobile
networks made gathering large amounts of
location data a more realistic proposition.
In 2013, some civic offices in Incheon
began to use web-based GIS. Eventually,
250 departments across the city were using
some form of it. In 2016, Jo began doing
Incheon Metropolitan City is one of
the largest cities in the Republic of Korea.
Incheon is located on the northwest
coast of South Korea, near the nation’s
capital of Seoul.
esri.com/arcuser Summer 2021 au 21network model and enabled web-service based architecture for instantly where its resources are, it will definitely speed up re-
the city’s water supply management system. sponse times,” Jo explained.
“The mobile era is overflowing with location information,” he Incheon’s digital twin will soon be used to manage underground
said. “There is a convergence of data relating to temporal and spa- assets, such as sewer systems, power grids, telecommunications,
tial information, and the scope of use is expanding into all areas and subways. Even natural gas lines—the impetus for introduc-
of local administration. There is so much data out there, from text ing GIS into the urban management process in the 1990s—will be
data to large-capacity imagery data, but data that contains tempo- monitored and controlled with the digital twin.
ral and spatial information is like 100 percent pure gold.” Jo is particularly pleased that Incheon’s digital twin is now being
used to operate a flood prediction monitoring system. This is
Since the beginning of the year, the Incheon digital twin has an important development because the digital twin doesn’t just
grown to include six project areas: fire response management, traf- mirror the city as it is in the moment; it can be used to predict
fic, urban sanitation, facilities management, urban development, events caused by changes in conditions in the city.
and city revitalization. “The ultimate model of a digital twin city,” he explained, “is a
Activities for improvements include a method for routing and simulation based on the real world.”
tracking the location of street cleaning vehicles, so that manag-
ers have a better understanding of progress at any given moment. Altogether, 500 staff members from 30 different depart-
By creating maps of garbage and food waste disposal throughout ments currently use the digital twin in some capacity. Jo expects
Incheon and monitoring its status through an app, the department those numbers to grow as the complexity of the digital twin in-
can understand how to effectively allocate cleaning vehicles. creases. “We are constantly collecting data, and we try to keep
The Incheon Fire Department has used the digital twin to launch it as current as possible,” Jo said. He estimates that the digital
an experimental program for allocating resources. By outfitting twin has increased efficiency among Incheon city government of-
35 fire trucks with receivers that use an IoT network and GPS for fices by 10 percent. The next step in its evolution will be to begin
precise real-time positioning, the department has the real-time lo- making data from the digital twin more accessible to the public.
cation for each truck. “When the department is able to determine “We’ve realized that the more we engage constituents and con-
nect data, the more we can reduce costs and make Incheon a more
sustainable and prosperous city,” he said. “What really makes
Incheon a smart city is that we’re creating a barrier-free zone with
geospatial infrastructure. No matter what department, other agen-
cies, as well as the private sector, can engage with us to help solve
Incheon’s problems.”
As more of the digital twin becomes public facing, the mapping
aspect and its GIS foundation will come to the forefront. Jo’s team
is currently working on using the digital twin as the basis for mobile
mapping apps.
The first of these apps is designed to support the local economy
by focusing on Incheon’s 12 shopping areas in the older section
of the city. The oldest of these markets is more than a century
old. “There isn’t enough information about
these old markets,” Jo said. “The lack
of information about the types of stores,
opening hours, and contact info has been
a barrier, making it difficult for them to at-
tract new customers.”
Incheon has worked with several
The city’s team is currently working on
using the digital twin as the basis for mobile
mapping apps.
In recent years, South Korea has
experienced an uptick in mosquito-borne
diseases. Dashboards are used to monitor
and share data on mosquitoes to quickly
identify vulnerable areas, so that problems
can be intensively and preemptively
controlled.
22 au Summer 2021 esri.com/arcuserYou can also read