American Association of Petroleum Geologists, Energy Minerals Division - I2M ...
←
→
Page content transcription
If your browser does not render page correctly, please read the page content below
Unconventional Energy Resources: 2015
Review

American Association of Petroleum
Geologists, Energy Minerals Division

Natural Resources Research
formerly `Nonrenewable Resources'

ISSN 1520-7439
Volume 24
Number 4

Nat Resour Res (2015) 24:443-508
DOI 10.1007/s11053-015-9288-6

                            1 23
Author's personal copy

Natural Resources Research, Vol. 24, No. 4, December 2015 (Ó 2015)
DOI: 10.1007/s11053-015-9288-6

Unconventional Energy Resources: 2015 Review

American Association of Petroleum Geologists, Energy Minerals Division

                                Received 5 August 2015; accepted 28 October 2015
                                Published online: 25 November 2015

                                This paper includes 10 summaries for energy resource commodities including coal and
                                unconventional resources, and an analysis of energy economics and technology prepared by
                                committees of the Energy Minerals Division of the American Association of Petroleum
                                Geologists. Unconventional energy resources, as used in this report, are those energy re-
                                sources that do not occur in discrete oil or gas reservoirs held in structural or stratigraphic
                                traps in sedimentary basins. Such resources include coalbed methane, oil shale, U and Th
                                deposits and associated rare earth elements of industrial interest, geothermal, gas shale and
                                liquids, tight gas sands, gas hydrates, and bitumen and heavy oil. Current U.S. and global
                                research and development activities are summarized for each unconventional energy re-
                                source commodity in the topical sections of this report, followed by analysis of unconven-
                                tional energy economics and technology.
                                KEY WORDS: Coal, coalbed methane, gas hydrates, tight gas sands, gas shale and liquids, geothermal
                                resources, bitumen, heavy oil, oil shale, uranium, thorium, rare earth elements, energy economics,
                                unconventional energy resources.

INTRODUCTION                                                         contained in this review. The complete set of com-
                                                                     mittee reports is available to AAPG members at
Paul C. Hackley,3 Peter D. Warwick3                                  http://emd.aapg.org/members_only/. This report
                                                                     updates the 2006, 2009, 2011, and 2103 EMD
     The Energy Minerals Division (EMD) of the                       unconventional energy reviews published in this
American Association of Petroleum Geologists                         journal (American Association of Petroleum Geolo
(AAPG) is a membership-based technical interest                      gists, Energy Minerals Division 2007, 2009, 2011,
group having the primary goal of advancing the                       2014a).
science of geology, especially as it relates to explo-                    Included herein are reviews of research activi-
ration, discovery, and production of unconventional                  ties in the U.S., Canada, and other regions of the
energy resources. Research on unconventional en-                     world related to coal, coalbed methane, oil shale, U
ergy resources changes rapidly, and exploration and                  and Th deposits and associated rare earth elements
development efforts for these resources are con-                     of industrial interest, geothermal, gas shale and liq-
stantly expanding. Ten summaries derived from                        uids, tight gas sands, gas hydrates, and bitumen and
2015 committee reports presented at the EMD An-                      heavy oil. An analysis of energy economics and
nual Meeting in Denver, Colorado in May 2015, are                    technology as related to unconventional resource
                                                                     commodities also is included. Please contact the
1
  American Association of Petroleum Geologists, Tulsa, OK            individual authors for additional information about
  74119, USA.                                                        the topics covered in each section of this report. The
2
  To whom correspondence should be addressed; e-mail:                following website provides more information about
  phackley@usgs.gov
                                                                     all unconventional resources and the AAPG-EMD:
3
 U.S. Geological Survey, 956 National Center, Reston, VA             http://emd.aapg.org.
20192, USA.

                                                               443
                                                              1520-7439/15/1200-0443/0 Ó 2015 Springer Science+Business Media New York (Outside USA)
Author's personal copy

444                                      American Association of Petroleum Geologists, Energy Minerals Division

COAL                                                             producers in 2015 and 2016, with the result of some
                                                                 mines having to close or suspend operations until
William A. Ambrose4                                              more favorable prices return. Worldwide coal prices
                                                                 have been reduced by as much as 50% in the past 3
World Overview and Future Technology Issues                      years because of increased production from ex-
                                                                 porters that include the U.S., Australia, South
     Coal still is the second largest energy commodity           Africa, Indonesia, and Colombia. Reuters (2014)
worldwide, exceeded only by oil. The worldÕs top 10              reported that the oversupply for seaborne steam
coal-producing countries since 2012 account for about            (thermal) coal, used primarily for generation of
90% of the worldÕs total coal production, with China             electricity, was estimated by coal traders and ana-
being the top coal-producing and -consuming country              lysts to range from 7 to 12 million metric tons (7.7–
and Indonesia and Australia the top coal-exporting               13.2 mst), and surplus coal could continue to be
countries (Table 1). This report focuses on coal pro-            problematic into 2016. Demand for thermal coal in
duction in the top-three coal-producing countries                Asia, particularly in China, is slowing. Economic
(China, U.S., and India), which together represented             growth in China has recently slackened, and in
65% of the worldÕs coal production [5.16 billion               combination with pressure from the government to
metric tons (5.68 billion short tons, or bst)] at the            use more natural gas to mitigate air-pollution
beginning of 2013 (EIA 2015a). Brief highlights of               problems, some coal mines may close. However,
other leading coal-producing countries are featured              demand may pick up in 2016 as the thermal coal
at the end of this report.                                       oversupply begins to fall as a result of coal mine
     Over 30% of the worldÕs total energy demand                 closures. In other Asian markets, Indian utilities
and >40% of generated electricity comes from coal                may require more imported coal if Coal India can-
(World Coal Association 2015). The challenge for                 not meet demand. This could result in a 6% increase
coal in the 21st century will be improving technology            in demand to almost 790 million metric tons ( 871
for electricity from coal to address increases in CO2            mst) by the end of fiscal year 2015.
emissions, while at the same time continuing to
provide access to energy for developing countries. A
large portfolio of technologies including advanced               China
power generation (high thermal efficiency) and CCS
(carbon capture and storage) must be demonstrated                      China continues to be the number one producer
and deployed to realize significant GHG (green-                  and consumer of coal in the world (World Coal
house gas) reductions from coal use. Lowering CO2                Association 2014), using more coal than the U.S.,
emissions from coal-fueled power plants will require             Europe, and Japan combined (Moore 2011; Vince
an increase in thermal efficiency. The IEA roadmap               2012; Sweet 2013). China produced more than 4.2
for technology involving electricity generated from              billion metric tons ( 4.37 bst) of coal in 2013 (EIA
coal with CCS currently envisages slightly less than             2015b). China accounts for almost half of the worldÕs
280 gigawatts (GW) of CCS-equipped power plants                  coal consumption (78 quadrillion BTUs [British
worldwide by 2030. Roughly 630 GW of coal-fueled                 Thermal Units]) and is the worldÕs largest power
power plants with CCS would be required by 2050.                 generator (EIA 2015b). China possessed an esti-
                                                                 mated 122.5 billion metric tons (126 bst) of recov-
                                                                 erable coal reserves in 2011, equivalent to 13% of
Coal Markets and Supply                                          the worldÕs total coal reserves. China, as of 2012, had
                                                                 more than 18,000 coal mines, of which 95% were
    A current global oversupply of coal, with sur-               underground mines producing primarily bituminous
pluses at roughly 10 million metric tons [11 million            coal, anthracite, and lignite (World Coal Association
short tons (mst)] in 2014, has led to a downturn in              2015). Much of ChinaÕs thermal coal resources occur
global coal prices (Reuters 2014). This will move                in the north-central and northwestern parts of the
coal prices below profitable levels for many coal                country. In contrast, coking (metallurgical) coal re-
                                                                 serves are found mostly in central and coastal parts
4
 Jackson School of Geosciences, Bureau of Economic Geology,      of China.
The University of Texas at Austin, Austin, TX 78713-8924, USA;         Roughly two-thirds of coal in China is used for
Chair, EMD Coal Committee.                                       power generation (EIA 2015b). China has been a
Author's personal copy

Unconventional Energy Resources: 2015 Review                                                                                        445

Table 1. Top Coal-Exporting Countries and Their Coal Exports in 2014, Projected Coal Exports in 2015, Coal Consumption for Electric
            Power in 2013 (Calculated from Sources Indicated Below), and Electric Power Generation Use Ratio in 2014

Top                      2014 Exports                  2015 Exports                 2013 Electrical            2014 Power Generation
Exporters            (Million Metric Tons)         (Million Metric Tons)         Consumption (Million                Use Ratio
                                                                                     Metric Tons)

Indonesia                   382.0 (a)                     450.0 (b)                    239.4 (c)                       0.49   (d)
Australia                   196.0 (e)                     202.9 (f)                    266.5 (g)                       0.64   (h)
United States               97.3 (i)                      87.9 (i)                     341.4 (j)                       0.39   (k)
South Africa                78.0 (l)                      79.0 (b)                     161.3 (m)                       0.62   (n)
Colombia                    77.6 (o)                      80.0 (b)                     0.5 (p)                         0.06   (d)

Sources (a) Indonesia Investments (2015); (b) Slideshare (2015), based on sources from globalCOAL; (c) EIA (2015f); (d) Worldbank Data
(2015); (e) Australia Department of Industry (2014); (f) Reuters (2015b); (g) World Coal Association (2014); (h) EIA (2015g); (i) EIA
(2015c); (j) EIA (2015k); (k) EIA (2015l); (l) EIA (2015m); (m) EIA (2015h); (n) Republic of South Africa, Department of Energy (2015);
(o) Dodson (2015); (p) EIA (2015n).

net coal importer since 2009, with recent increased                   that in 2013 (EIA 2015c). The average price of U.S.
imports resulting from increased demand as well as                    metallurgical and thermal coal exports during third-
high internal coal transportation costs caused by                     quarter 2014 was $95 per metric ton ($86 per
bottlenecks in ChinaÕs railway capacity. These factors                short ton) and $70 per metric ton ($63.50 per
have made imported coal economically viable, par-                     short ton), respectively. Wyoming continues to be
ticularly along coastal regions that are distant from                 the top coal-producing state, with 85.7 million metric
coal mined in western China. China is attempting to                   tons (94.5 mst) of production from April to June
consolidate its coal industry, as it has 10,000 minor                2014.
local coal mines where inadequate investment, out-                         The decline in U.S. coal exports in 2014 was
moded equipment, and poor safety procedures con-                      primarily controlled by a decrease in world coal
trol inefficient resource development.                                demand, depressed international coal prices, and
      Electricity generation in China is operated by                  greater coal production in other coal-exporting
state-owned holding companies, although limited                       countries. The EIA (2015d) projects coal exports
private and foreign investments have recently been                    will fall from 88 million metric tons (97 mst) in 2014
made in the electricity sector. Chinese power gen-                    to an annual average of 73.5 million metric tons (81
eration growth in 2014 was the slowest since 1998                     mst) in 2015 and 2016. Coal consumption for electric
and growth in steel production was also the weakest                   power in the U.S. decreased by 0.8%, or 6.35 million
in more than 30 years. China has expanded the                         metric tons (7 mst) in 2014. The EIA (2015d) pre-
construction of natural gas-fired and renewable                       dicts that power sector coal will decrease by 2.2% in
power plants to introduce power to remote popula-                     2015, mainly as a result of lower natural gas prices
tion centers.                                                         and coal plant retirements because of implementa-
      ChinaÕs coal production in 2014 is estimated to                 tion of new air-quality and emission standards. An
have dropped 2.5%, having produced 3.52 billion                       additional decline in coal consumption for electric
metric tons (3.88 bst) of coal in the first 11 months of              power (0.5%) is projected in 2016.
2014. China produced 3.7 billion metric tons (4.1 bst)                     Although U.S. coal production for exports
in 2013. This is the first annual decline in coal pro-                continues to be strong, coalÕs share of the countryÕs
duction in China in more than a decade (Reuters                       overall energy production is declining, primarily the
2015a). This decline is the result of weakening de-                   result of expanded natural gas production
mand from industry and the power sector, oversup-                     (Humphries and Sherlock 2013). Lower demand for
ply, and initiatives from the government to reduce                    coal in U.S. markets is controlled by increasingly
air pollution.                                                        strict federal regulations, lower natural gas prices,
                                                                      and coal plant retirements. Reuters (2012), based on
                                                                      data from North American Electric Reliability
United States                                                         Corporation (2011), estimated that market condi-
                                                                      tions and environmental regulations will contribute
    U.S. coal consumption in 2014 showed no in-                       to between 59 and 77 GW of coal plant retirements
crease, with third-quarter production on par with                     by 2016. Greatest loss of coal-fired electricity
Author's personal copy

446                                  American Association of Petroleum Geologists, Energy Minerals Division

generation is projected to occur in the southeastern       primary energy consumption, although its coal pro-
U.S., with 27–30 GW of plant retirements, followed         duction is expected to peak in the next decade
by the northeastern U.S. (18–26 GW).                       (Ryan 2014; EIA 2015h). Germany plans to reduce
                                                           greenhouse gas emissions by 40% (from 1990 levels)
                                                           by 2020 (Destatis 2015), although coal accounted for
India                                                      43% of electricity generation in Germany in 2014.
                                                           Coal production in Poland is the second largest in
     The coal industry in India was the worldÕs third      Europe, exceeded by Germany (EIA 2015i). Of the
largest in terms of production and the fifth largest in    3.9 quadrillion BTU (980 trillion kilocalories/kg)
terms of reserves in 2012 (EIA 2015e). Coal India          of PolandÕs primary energy consumption in 2012,
has a near-monopoly on the coal sector, of which the       coal represented 55%. Coal production in the same
power sector comprises most of its coal consump-           year was 143.3 million metric tons (158 mst),
tion. India continues to undergo regulatory, techni-       or 20% of total coal production in Europe. Coal
cal, and distribution difficulties that limit production   represented 63% of KazakhstanÕs total energy con-
and prevent efficient transportation of coal to de-        sumption in 2012 (EIA 2015j). A coal-to-liquids
mand centers. Moreover, coal mines in the country          (CTL) facility is underway in Akmola Oblast in
are distant from the high-demand markets in west-          Kazakhstan (Urazova 2015). The experimental
ern and southern India. Because coal production has        facility for processing low-rank coal into gasoline
failed to keep up with demand, particularly from the       and diesel fuel will employ low-temperature plasma
power sector which accounted for 69% of coal               in the Fischer–Tropsch process. For every ton of
consumption in 2011, India imported 162.4 million          coal delivered from the Maikuben Basin, plans are
metric tons (179 mst) and was the third largest coal       to produce 0.223 tons of liquid fuel at a cost of 23
importer in 2012. India imports thermal coal pri-          cents (42 tenge) per liter.
marily from Indonesia and South Africa, as well as
metallurgical coal from Australia (EIA 2015e). The
Indian coal ministry plans to scale down its pro-          COALBED METHANE
duction target of 795 million metric tons (876.4 mst)
in the period from 2016 to 2017, owing to perceived        Brian J. Cardott,5 Jeffrey R. Levine,6 Jack C.
problems in rail transport and compliance with             Pashin,7 David E. Tabet8
environmental regulations (Thakkar 2014). India
possessed 249 GW of installed electricity generation       Introduction
capacity in 2014. However, owing to fuel shortages
and limited transmission capacity, India still expe-           The evaluation and production of natural gas
riences electricity shortages and blackouts typically      from coal beds falls under two broad categories,
lasting from several hours to days.                        depending on the context in which the resource is
                                                           being assessed and produced:

Other Leading Coal-Producing Countries                             As an energy resource similar to other sour-
                                                                    ces of natural gas, with the principal distinc-
      Other leading coal-producing countries include                tion being that the gas is coming from coal
Indonesia, Australia, Russia, South Africa, Ger-                    beds rather than conventional porous reser-
many, Poland, and Kazakhstan. Indonesia and                         voir rocks. In this context, the produced gas is
Australia are the worldÕs largest and second largest                variously referred to as coalbed methane
exporters of thermal coal, respectively (Wulandari
2014; Cahyafitri 2014; Asmarini 2015; EIA 2015f, g).
Although levels of coal production in Russia are           5
                                                            Oklahoma Geological Survey, Norman, OK 73019-0628 USA;
modest, with 354 million metric tons (390 mst) in
                                                           Chair, EMD Coalbed Methane Committee.
2012, the country has inaugurated a long-term              6
development plan for its flagging coal industry and is      Baker Hughes, Dhahran Global Technology Center, Saudi
                                                           Arabia.
calling for an increase in coal production and elec-
                                                           7
tricity generation from coal (Dobrovidova 2014).               Oklahoma State University, Stillwater, OK 74078-3031 USA.
                                                           8
Coal still represents >70% of South AfricaÕs total             Utah Geological Survey, Salt Lake City, UT 84114-6100 USA.
Author's personal copy

Unconventional Energy Resources: 2015 Review                                                                             447

      (CBM), coal bed natural gas, or coal seam gas        Table 2. Coalbed Methane Resources by Country as of 2010
      (CSG).                                                              (Modified from Mastalerz 2014)
     Gas produced in association with coal mining         CBM Resources by Country
      operations—termed coal mine methane
      (CMM).                                               Country                                          Resources (Tcf)

                                                           Russia                                                 2824
     CMM development is driven by three incen-             China                                                  1100
tives: (1) increased mine safety through the reduc-        Alaska                                                 1037
tion of methane being released into mine workings,         U.S. (minus Alaska)                                     700
                                                           Australia                                               500
(2) the energy value of the produced gas, and (3) the      Canada                                                  500
abatement of fugitive methane being released into          Indonesia                                               435
EarthÕs atmosphere, where it acts as a potent              Poland                                                  424
greenhouse gas (GHG). In contrast, CBM develop-            France                                                  368
ment is driven largely by market forces related to its     Germany                                                 100
                                                           UK                                                      100
value as an energy resource, with additional gov-          India                                                    70
ernmental incentives occasionally being provided.          Ukraine                                                  60
     Much of the current interest in CMM is being          Zimbabwe                                                 40
sustained by programs sponsored through the Uni-           Kazakhstan                                               25
ted Nations, U.S. Department of Energy (DOE),              1 trillion cubic feet (Tcf) = 28.3 billion m3.
U.S. Environmental Protection Agency (EPA), and
other national organizations in countries including
Australia, China, and Mexico.                              Table 3. Annual Coalbed Methane Production by Country as of
     The Global Methane Initiative web site (https://                  2010 (Modified from Mastalerz 2014)
www.globalmethane.org/tools-resources/coal_over            Annual CBM Production by Country
view.aspx) provides hyperlinks to resource over
views for countries having significant resources of        Country                                          Production (Bcf)
coal, CBM, and CMM. The web site https://www.              U.S. (minus Alaska)                                   1886
globalmethane.org/coal-mines/index.aspx#action             Canada                                                320
plans has a list of hyperlinks to action plans devel       Australia                                             190
oped under the auspices of the Global Methane              China                                                 50
                                                           Alaska                                                1
Initiative. The goal of this program is to find ways of    Russia                                                0.5
reducing atmospheric emissions of methane arising          India                                                 0.4
from four major industrial sources: agriculture, coal      Kazakhstan                                            0.4
mining, municipal solid waste, and oil and gas pro
                                                           1 billion cubic feet (Bcf) = 28.3 million m3.
duction.

                                                           showing world CBM resources, production, and
Overview of Current CBM Production and Reserves            exploration activities as of 2010. Global CBM
                                                           resources and production are summarized in
      Production and reserves of natural gas from          Tables 2 and 3.
coal beds in the U.S. have declined since 2008 due,
in part, to the drop in price for natural gas, but it is
still an important resource globally. Research on          Summaries of CBM Production for Selected Coun-
CBM remains active, however, as indicated by 61            tries
technical papers published in 2014, including a book
edited by Thakur et al. (2014) that contains the           United States of America. The EIA (2009a) shows
proceedings of the North American Coalbed Me-              a map of U.S. lower 48 states CBM fields (as of
thane ForumÕs 25th Anniversary meeting. [The               April 2009). U.S. annual CBM production peaked
North American Coalbed Methane Forum cele-                 at 1.966 trillion cubic feet (Tcf; 55.67 billion m3) in
brated 30 years of forums (1985–2015) at the meet-         2008 (Fig. 1). CBM production declined to 1.466
ing on May 20–21, 2015 (http://www.nacbmforum.             Tcf (41.51 billion m3) in 2013, the lowest level since
com)]. Mastalerz (2014, her Fig. 7.3) provided a map       2001, representing 5.5% of the U.S. total natural
Author's personal copy

448                                     American Association of Petroleum Geologists, Energy Minerals Division

Figure 1. United States CBM production, 1989–2013 (compiled    Figure 2. United States CBM proved reserves, 1989–2013
from EIA 2009b Table D11, 2010a Table 15, 2014a Table 15). 1   (compiled from EIA 2009b, 2010a, 2014a). 1 Billion cubic feet
Billion cubic feet (Bcf) = 28.3 million m3.                    (Bcf) = 28.3 million m3.

gas production of 26.5 Tcf (750.4 billion m3). Note            Bowen Basin (23%), Gunnedah Basin (4%),
that U.S. CBM production in EIA (2014a, their                  Gloucester Basin (2%), Sydney Basin (1%), and
Table 15) is different than in EIA (2014b, their               Clarence-Moreton Basin (1%) (Flores 2013). The
Table 1). According to EIA (2014a), the top 8                  EIA (2015g) reported that economically recoverable
CBM-producing U.S. states during 2013 (produc-                 CSG reserves in Australia were 33 Tcf (934 billion
tion in billion cubic feet, Bcf; or million m3) were           m3) in 2012, primarily in the Surat and Bowen Ba-
Colorado (444; 12.57), New Mexico (356; 10.08),                sins in Queensland. Commercial CSG production in
Wyoming (331; 9.37), Virginia (93; 2.63), Oklahoma             Australia began in 1996 and was 246 Bcf (6.97 billion
(65; 1.84), Alabama (62, 1.76), Utah (50; 1.42), and           m3) in 2012 (13% of total natural gas production).
Kansas (30; 0.85). Annual CBM production by U.S.
state (2008–2013) is available at EIA (2015o).                 China. A map showing coal basins and CBM re-
Cumulative U.S. CBM production from 1989                       sources in China is available at https://www.glo
through 2013 was 32 Tcf (0.91 billion m3). CBM                 balmethane.org/tools-resources/coal_overview.aspx.
production continues even though few new wells                 EIA (2015b) reported that CBM production from
are being completed, reflective of the very long               wells and underground coal mines in China was
productive lives of CBM wells. U.S. Geological                 441 Bcf (12.49 billion m3) in 2012. Tao et al.
Survey (2014) includes hyperlinks to their CBM                 (2014) indicated there were 12,574 CBM wells in
assessment publications and web pages. Ruppert                 China at the end of 2012; the Southern Qinshui
and Ryder (2014) included coal and coalbed me-                 Basin is the largest CBM-producing basin in
thane resources and production in the Appalachian              China. The first CBM exploration well in China
and Black Warrior Basins.                                      was drilled in 1991 (Zhang et al. 2014). Flores
     U.S. annual CBM proved reserves peaked at                 (2013) indicated that a significant amount of the
21.87 Tcf (619 billion m3) in 2007 and declined to             CBM resources in China are from coal mine
12.392 Tcf (351 billion m3) in 2013, the lowest level          methane (CMM) with the first CMM project in
since 1999, representing 3.5% of the U.S. total nat-           1991. Information on coal mine methane activity
ural gas reserves of 354 Tcf (10,024 billion m3)               in China is available from U.S. Environmental
(Fig. 2). Annual CBM proved reserves by U.S. state             Protection Agency (2015). According to Dodson
(through 2013) are available at EIA (2015p).                   (2014), ‘‘Chinese shale gas production fell so far
                                                               short of expectations that the Asian behemoth
Australia. Flores (2013, his Fig. 9.15) included a             quickly turned to CBM’’ and ‘‘CBM may well find
map showing coal seam gas (CSG) potential in                   itself relied on increasingly in China, as the
Australia noting that the coal beds range in age from          country looks to offset its coal dependence.’’
Permian to Tertiary in about 30 coal-bearing basins.
Blewett (2012) included maps showing the distribu-             Canada. CBM production in Canada comes mainly
tion of demonstrated black coal and gas resources in           from Cretaceous and Tertiary coals in the Western
Australia. CSG reserves in 2012 are divided into six           Canada Sedimentary Basin (Flores 2013). According
coal basins in eastern Australia: Surat Basin (69%),           to the web site http://www.energy.alberta.ca/Natural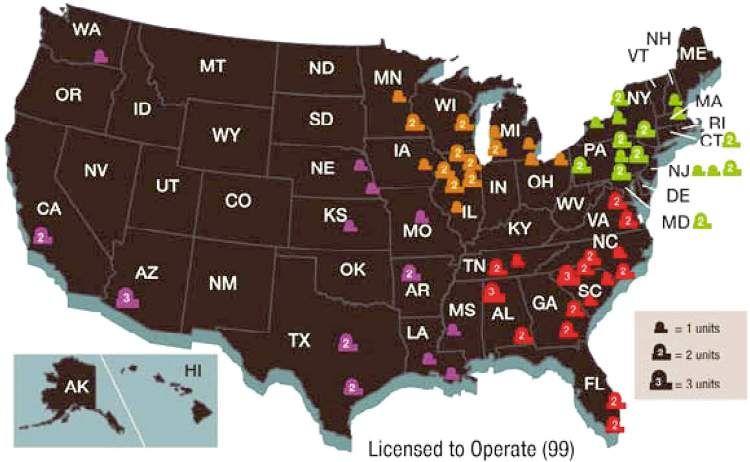
Author's personal copy

Unconventional Energy Resources: 2015 Review                                                                        449

Gas/750.asp, there were 19,269 CBM wells in Al                    Although the U.S. has the largest oil shale
berta, Canada as of December 31, 2012. Most of the          (kerogen) resource, Estonia and China are currently
new production was from the Horseshoe Canyon                the largest producers, processing it both for electric
Formation with some deep wells to the Mannville             power by burning and for shale oil by retorting
Formation coals.                                            (destructive distillation). The unfortunate recent use
                                                            of the term ‘‘shale oil’’ for oil produced by
                                                            hydraulically fracturing mature petroleum source
OIL SHALE                                                   rocks and adjacent more permeable lithologies is a
                                                            source of major confusion in both public and scien-
Alan K. Burnham9                                            tific circles, as the resources and production methods
                                                            are completely different. The U.S. EIA (2015q) and
      Oil shale is a kerogen-rich petroleum source          most industry has adopted the term ‘‘tight oil’’ for
rock that never got buried deep enough to experi-           what is sometimes called ‘‘shale oil’’ because it is a
ence the times and temperatures necessary to gen-           more appropriate description.
erate oil and gas. Worldwide, oil shale is a                      As shown in Figure 3, oil shale mining peaked
substantial potential energy resource that potentially      in 1980 at 43 million tons (47 short tons) per year,
could yield a trillion barrels (159 billion m3) of oil      declined to 16 million tons (18 short tons) per year
and gas equivalent (Burnham 2015). Estimates of             in 2000, but has grown steadily since to 33 million
the resource vary considerably (Knaus et al. 2010;          tons (36 million short tons) per year in 2014, of
Dyni 2003; Boak 2013), but taking the highest value         which 90% was split between China and Estonia.
for each country from these estimates plus a con-           Brazil produced most of the rest. From the portion
tribution from a largely uncharacterized resource in        retorted, China averaged about 16,000 barrels of oil
Mongolia, (Oil & Gas Journal 2013) one obtains a            per day (bopd) (2500 m3/day), Estonia 14,000
potential resource of about 7.5 trillion barrels (1.2       bopd (2200 m3/day), and Brazil nearly 4000 bopd
trillion m3). Most of that resource is in the U.S., and     (640 m3/day). The Chinese and Estonian numbers
most of that is in the Green River Forma-                   include new capacity added during 2014 and are
tion—about half the world total. Russia, China, Is-         projected to rise a little in 2015.
rael, Jordan, and DR Congo each have resources of                 New oil shale development is proposed in the
at least 100 billion barrels (15.9 billion m3). Recov-      three currently producing countries and in Jordan,
ery factors are hard to estimate due to grade varia-        the U.S., Australia, Morocco, Mongolia, Israel, Ca-
tions and yet-unproven in situ technology required          nada, and Uzbekistan. How fast this expansion
to process most of the resource, but even 20%               proceeds depends strongly on the price of crude oil,
recovery seems highly optimistic. A new assessment          but it is likely that some research and development
is sorely needed.                                           and incipient commercial production will occur in
      Prior to the discovery of commercial natural          order to refine processing technology, environmen-
petroleum deposits, oil shale was a significant source
of heating and lighting oil, particularly in Scotland in
the 19th century. In the U.S., interest in oil shale
awakens every 30 years or so with concerns about
conventional petroleum prices and energy security
then wanes with new discoveries and lower prices.
Oil shale activities in other parts of the world are
less variable due to a variety of economic factors.
Prior to the most recent drop in oil prices (2014), the
future of oil shale looked bright, at least in certain
parts of the world. The current status is in flux, but it
is too early to know whether we are seeing a repeat
of the 1980s or a shorter-term correction.

                                                            Figure 3. History of oil shale extraction updated from Dyni
9
 Department of Energy Resources Engineering, Stanford       (2003) using a variety of industry and government sources. 1
University, Stanford, CA 94305-2220.                        metric ton = 1.1 short ton.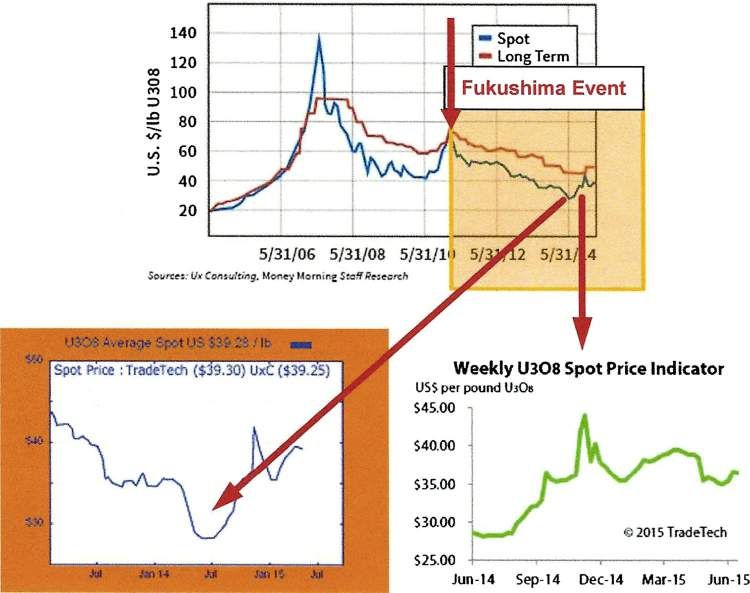
Author's personal copy

450                                  American Association of Petroleum Geologists, Energy Minerals Division

tal factors, and economics under the presumption            commercial-scale demonstration that would pro-
that oil prices will go up during the years before          duce >300,000 barrels (>47,700 m3) of oil over
significant commercial production. Projections prior        400 days. However, the drop in crude oil prices has
to the recent oil price collapse were 300 million          caused them to re-optimize the design, switching
tons (441 short tons) of oil shale mined per year and       from indirect to direct hot-gas retorting, and then to
400,000 bopd (64,000 m3/day) by 2030 (Boak 2013).           restart construction in 2017. TomCo Energy also
      The two primary extractive processes for pro-         plans to use the EcoShale process in Utah.
ducing shale oil are hot-gas retorts and hot-solids re-
torts (Burnham and McConaghy 2006; Crawford and
Killen 2010). Many variations of each exist, with the       ENERGY COMPETITION IN THE
Fushun, Kiviter, Petrosix, and Paraho processes being       URANIUM, THORIUM, AND RARE EARTH
the dominant hot-gas types used in China, Estonia,          INDUSTRIES IN THE U.S. AND THE
Brazil, Australia, and the US and the Galoter, Pet-         WORLD: 2015
roter, Enefit and Alberta Taciuk Process (ATP)
processes being the hot-solids types used in Estonia        Michael D. Campbell,10 James R. Conca, PhD11
and China and potentially the US, Jordan and Mor-
occo. New hot-solids retorts have achieved design           Introduction
throughput for Enefit (Eesti Energia) and VKG in
Estonia and Fushun/ATP in China. Enefit is pursuing              After the 2011 Fukushima tsunamis and dam-
a commercial development in Utah on both private            age to JapanÕs Daiichi nuclear power plant, uranium
and US land (via its Bureau of Land Management              prices dropped about 60% in value over the ensuing
Research, Development, and Demonstration (US                years. But the decline in the price evident in
BLM RD&D) lease) using its hot-solids technology.           Figure 4 appears to have run its downward course by
      The two new types of processes being re-              mid-2014. As illustrated in the two charts in
searched are in-capsule and in situ heating (Burn-          Figure 4, since bottoming near $28 in mid-2014, spot
ham and McConaghy 2006). In-capsule heating is a            uranium prices gained nearly 40% to reach their
new type of process invented by Red Leaf Re-                current level around $38.50 (as of May 2015), see
sources (http://www.redleafinc.com/), in which              I2M Web Portal (I2M Web Portal 2015a) for recent
shallow oil shale is mined and used to create               discussions on future price expectations.
stadium-sized rubble beds encapsulated by ben
tonite-clay engineered earthen walls. The original
concept was that oil shale would be heated indirectly       Energy Competition
to retorting temperatures by flowing hot gas through
embedded tubes, with heat distributed by conduc-                 Nuclear fuel prices represent a very small seg-
tion and convection and the spent shale abandoned           ment of the total cost to produce electricity by nu-
in place. In situ heating was resurrected from              clear power relative to other energy sources. The
Swedish technology of the mid-20th century by Shell         supply of nuclear fuel is available from an increasing
using more modern drilling technology and heating           number of uranium mine sites today, and therefore,
cables (Ryan et al. 2010), and several companies are        new nuclear plant construction is based more on its
researching variations of in situ heating in the U.S.       total plant cost and financing (including insurance
and Israel. Shell recently abandoned its US BLM             costs), concerns about nuclear waste disposal and
RD&D leases in preference for a demonstration of            public opinion than with those impacting other
its in situ conversion process in Jordan, and it started    competing energy sources, even if the latter have
in situ heating for a small pilot test in Jordan in 2015.   major impact on the environment.
Israel Energy Initiatives was recently denied a per-
mit in Israeli to conduct a pilot test of a similar
process and is considering its options.                     10
                                                              I2M Associates, LLC, Houston, TX and Seattle, WA; Chair,
      The first commercial shale oil production in the      EMD Uranium (and Nuclear and Rare Earth Minerals) Com-
U.S. will likely use Red LeafÕs EcoShale in-capsule         mittee.
heating technology in a joint Utah project with Total       11
                                                              UFA Ventures, Inc., Richland, WA; Member, Advisory Group,
S.A. Red Leaf obtained the necessary permits from           EMD Uranium (and Nuclear and Rare Earth Minerals) Com-
the State of Utah and started construction on a 5/8th       mittee.
Author's personal copy

Unconventional Energy Resources: 2015 Review                                                                        451

              Figure 4. Yellowcake prices since Fukushima Tsunami. From U3O8.biz (2015) and TradeTech (2015). 1
                                                     pound (lb) = 0.453 kg.

     In contrast, the technologies associated with the           past 50 years. Currently, the main criteria applied to
operation of renewable energy generation do not                  select a source of energy are based on short-term
have established records in their operation and                  economics and political influences. Because the nu-
maintenance costs, within a scaled-up grid of sig-               clear plants have been built in fortress-like ex-
nificant size, without substantial state and federal             tended-life designs that cost billions of dollars to
subsidies.                                                       bring on line, many of them have now lasted decades
     Considering that the ‘‘fuel’’ costs to drive wind and       and have produced electricity both reliably, safely,
solar are zero, albeit available at variable wind speeds         and at low relative cost over the past 50 years.
and receiving radiation only during daylight, these                   Factors that can be considered that impact en-
technologies still involve moving parts to produce               ergy-type selection, such as the costs of competing
electricity that must be maintained by humans and/or             fuels, their safety records, public opinion, and media
stored in batteries or backed up by grid-power that is           coverage, can even include sociological factors as far
usually of lower cost than those of the renewables, such         afield as the relationship of technology and
as produced by nuclear, hydroelectric and natural gas.           employment needs to be addressed. In the present
For cost comparisons, see I2M Web Portal (2015b).                climate, these factors all bear heavily on the avail-
                                                                 ability, price, and use of nuclear fuels, i.e., uranium
                                                                 and thorium, for the generation of electricity within
Energy Selection                                                 nuclear power plants.

     Many favorable aspects underlie using nuclear
heat to boil water to turn turbines to generate                  Energy Economics
electricity that have supported the construction and
continuous operation of more than 100 plants in the                  There has been a remarkable resilience to
U.S. (Fig. 5) and nearly 400 plants worldwide for the            the positive media views about nuclear powerÕs
Author's personal copy
452 American Association of Petroleum Geologists, Energy Minerals Division
Figure 5. Currently operating U.S. Nuclear Power Reactors. U.S. Nuclear Regulatory Commission
(NRC) (2015). NRC regions by color code.
resurgence in the U.S. and world today as the connects to the world market through development
existing plants exceed their design lives, with an of the liquefied natural gas (LNG) infrastructure.
understanding that all plants will need to be re- Immediate markets will include Europe and Japan
placed with new nuclear technology sooner or later. as long as the prices are attractive.
Another significant economic issue is the extensive Added to this economic condition, and with the
storage onsite of nuclear waste, and the current lack renewed interest in gas-fired power plants based on
of an offsite, long-term underground nuclear storage cheap natural gas, competition also comes from
waste alternative. In addition, with the success of renewable energy resources that the general public,
horizontal drilling and hydraulic fracturing technol- led by current national policies, associated federal
ogy in developing shale gas and oil deposits in the agencies, and the media, have suggested as the an-
U.S. and around the world, new natural gas re- swer to energy selection in the U.S. Nuclear adver-
sources are reaching the markets and have driven saries and pro-solar and wind proponents have
down the cost of fuel for generation of electricity to released media feeds promoting renewables and
levels that compete with nuclear power. With the listing accomplishments sometimes without fully
glut of new oil and gas, the price has fallen so low providing the economic evidence for such claims
that some U.S. shale oil and gas fields are becoming (Rosenbloom 2006; I2M Web Portal 2015c, d).
uneconomic to produce so natural gas prices will If the climate is to be a consideration and if the
likely tend to fluctuate in the future. This over sup- end cost of electricity, without government subsi-
ply of oil and gas, developed by the petroleum dies, is to be included in an assessment of the best
industry and national policy, is already evident by approach to energy utilization, then nuclear power
the employment downsizing underway today in the can prevail in delicate balance with natural gas be-
oil and gas industry, especially in the smaller com- tween costs and the environment on the basis that
panies. nuclear power has been and continues to be a pre-
The U.S. is leaving the land acquisition, leasing, ferred energy resource, e.g., capacity factor (Fig. 6).
and delineation stages of shale gas production and is The Annual Report of the Uranium (Nuclear
entering the consolidation stage where operations Minerals and REE) Committee or UCOM (Ameri-
will become more efficient and fewer, but larger, can Association of Petroleum Geologists, Energy
companies will control the market. Price volatility Minerals Division 2015) discusses these issues and
will decrease and prices will increase just as the U.S. others in more detail, and from which this summaryAuthor's personal copy
Unconventional Energy Resources: 2015 Review 453
is drawn. This summary also draws on the I2M Web The U.S. is the largest consumer of uranium in
Portal (2015a), which provides links to abstracts and the world, currently requiring more than 50 million
reviews of media articles and technical reports with pounds U3O8 annually, yet producing only about 4.7
a focus on current uranium prices, exploration, million pounds domestically. China consumes 19
mining, processing, and marketing (I2M Web Portal million pounds per year, expected to reach 73 mil-
2015e), as well as on topics related to uranium lion pounds by 2030. China currently produces about
recovery technology, nuclear power, economics, 4 million pounds U3O8 per year, and is planning to
reactor design, and operational aspects (I2M Web build additional nuclear power capacity, nearly tri-
Portal 2015f), and related environmental and soci- pling by 2020, to alleviate problems with air pollu-
etal issues involved in such current topics as energy tion created by mining, importing and burning coal
resource selection, climate change, and geopolitics to generate electricity.
(I2M Web Portal 2015g). This report summary also Vietnam has committed to building a number of
draws from the 2014 UCOM Mid-Year Report nuclear power plants in the north and in the south of
(American Association of Petroleum Geologists, Vietnam (World Nuclear Association 2015a). Viet-
Energy Minerals Division 2014b) as support. nam has significant hydroelectric power, but currently
Current university and government research still needs coal and natural gas for electric power.
and recent industrial developments on thorium are India also is in the midst of a major build out of
also discussed in the 2015 UCOM Annual Report nuclear power generation. A 500-MW prototype fast
(American Association of Petroleum Geologists, breeder reactor (PFBR) at Kalpakkam in Tamil
Energy Minerals Division 2015, pp. 26–27), and Nadu is targeted to produce power in 2015–2016
captured by the I2M Web Portal (2015h). Other (India Business Standard 2015). The countryÕs in-
potential energy sources such Helium-3 (I2M Web stalled capacity is now at 5780 MW, but that is set to
Portal 2015i), and related environmental and soci- nearly double in the next 4 years to 10,080 MW,
etal issues are captured as well. which also puts pressure on the world uranium de-
In addition, current university and government mand and price. In mid-April 2015, Indian Prime
research and recent industrial developments in the Minister Narendra Modi visited Canada. While
rare earth industry are discussed in the 2015 UCOM there, he signed a 5-year deal to buy 3000 tons U3O8
Annual Report (American Association of Petro- in order to fuel IndiaÕs nuclear reactors (Market
leum Geologists, Energy Minerals Division 2015, p. Oracle 2015). The agreement is worth C$350 million
30, 32), and captured by the I2M Web Portal (2015j). dollars, just over C$58.00/pound U3O8. NarendraÕs
For the full list of coverage of the various sources of meeting was the first India–Canada governmental
energy and associated topics, in the form of more visit in 42 years and the first nuclear contract be-
than 4000 abstracts and links to media articles and tween these two nations.
technical reports to date (and increasing each day) Given the anticipated near-term demand for
from sources in the U.S. and around the world, see uranium, a significant rise in the uranium commodity
(I2M Web Portal 2015k). price may drive stock prices up, which in turn will
drive new rounds of mergers and acquisitions of
uranium properties and the companies holding
Uranium Demand them, as well as driving new exploration and pro-
cessing plant development.
Eighty-nine percent (89%) of the fuel require-
ments of the current fleet of nuclear reactors will be
met by Canada, Australia, and Kazakhstan, and Uranium Production in the U.S
supplied from other sources, totaling some 377 mil-
lion pounds U3O8 per year. As uranium prices rise, U.S. production of uranium concentrate in the
more in situ uranium mines in the U.S. will come on fourth quarter 2014 was 1,100,111 pounds U3O8,
stream as Japan re-starts their reactors and other down 25% from the previous quarter and up 16%
countries bring new construction on-line, such as from the 4th Quarter 2013. During the fourth
China, India, and a number of others in the next few quarter 2014, U.S. uranium was produced at seven
years. But other deposits now being developed in U.S. uranium facilities, one less than in the previous
the world will also come on-line to compete on the quarter (EIA 2015r). Uranium was produced by mill
world markets. at White Mesa Mill in Utah, first operating-Author's personal copy
454 American Association of Petroleum Geologists, Energy Minerals Division
Figure 6. Comparative Energy Capacity Factors (Nuclear Energy Institute 2015a).
processing alternate feed in 4PthP Quarter 2014. and ISL plants were 4.6 million pounds U3O8 Rin
Uranium was produced by in situ-leach plants at 2014, 1% less than in 2013. U.S. producers sold 4.7
Alta Mesa Project (Texas), Crow Butte Operation million pounds U3O8 of uranium concentrate in 2014
(Nebraska), Hobson ISR Plant/La Palangana (Tex- at a weighted-average price of $39.17 per pound
as), Lost Creek Project (Wyoming), Nichols Ranch U3O8.
ISR Project (Wyoming), which started production in The EIA (2014g) reported that although most
2014, Smith Ranch-Highland Operation (Wyoming), of the uranium used in domestic nuclear power
and the Willow Creek Project (Wyoming). U.S. plants is imported, domestic uranium processing
uranium concentrate production totaled 4,905,909 facilities still provide sizeable volumes of uranium
pounds U3O8 in 2014. This amount is 5% higher concentrate to U.S. nuclear power plants. In 2013,
than the 4,658,842 pounds U3O8 produced in 2013. the percentage of uranium concentrate produced
U.S. production in 2014 represented about 11% of was distributed among seven facilities in four states.
the 2014 anticipated uranium market requirements Wyoming accounted for 59% of domestic produc-
of 46.5 million pounds U3O8 for U.S. civilian nuclear tion, followed by Utah (22%), Nebraska (15%), and
power reactors (EIA 2015s). Texas (4%).
EIA (2015t) reported that U.S. uranium mines Uranium is processed into uranium concentrate
produced 4.9 million pounds U3O8 in 2014, 7% more either by grinding up ore mined from an open pit or
than in 2013. Two underground mines produced from underground and then processed into yellow-
uranium ore during 2014, one less than during 2013. cake, or by using oxygen and liquid mixtures to
Uranium ore from underground mines is stockpiled dissolve the uranium occurring in sandstone from
and shipped to a mill, to be milled into uranium depths of 300 feet to more than 1200 feet in the
concentrate (called yellowcake, a yellow or brown subsurface by a process known as in situ leaching.
powder). Additionally, seven in situ-leach (ISL) Today, most plants incorporate in situ leaching;
mining operations produced solutions containing UtahÕs uranium mill serves a separate function
uranium in 2014 (one more than in 2013) that was involving upgrading the uranium product. The out-
processed into uranium concentrate at ISL plants. put of the mill and the leach plants is uranium
Total production of U.S. uranium concentrate in concentrate, known as U3O8 or yellowcake, which is
2014 was 4.9 million pounds U3O8, 5% more than in transported to conversion and enrichment facilities
2013, from eight facilities. The Nichols Ranch ISR for further processing before being fabricated into
Project started producing in 2014. The ISL plants are the pellets used in nuclear fuel to generate the he-
located in Nebraska, Texas and Wyoming. Total ated water that runs steam generators to produce
shipments of uranium concentrate from U.S. mill electricity.Author's personal copy
Unconventional Energy Resources: 2015 Review 455
Uranium Exploration in the U.S sion) decision as a victory for both sides. The lengthy
decision came months after NRCÕs Atomic Safety
Uranium exploration data for 2014 reflected the and Licensing Board took testimony on a contested
lower price of uranium and were expectedly down license the NRC granted to develop Azarga Ura-
substantially from previous years. In the meantime, niumÕs Dewey-Burdock in situ leach uranium oper-
Google search results (I2M Web Portal 2015l) show ations near Edgemont, South Dakota. The licensing
a multitude of mergers, acquisitions, and consolida- board found in favor of Powertech on five of the
tions, and company downsizing of properties held adversarial challenges relating to water quality and
are moving at a fast pace, while the price continues quantity. It did, however, revise the Powertech li-
to look for support in the nuclear power industry cense, instructing the company to improve efforts to
markets for fuel (Uranium Investing News 2015a). find and properly abandon existing drill holes at the
Recent exploration can be monitored on-line (I2M site to prevent contamination by rainfall draining
Web Portal 2015e), and by using a more generalized into the subsurface. Recently, drilled holes have
term (I2M Web Portal 2015m), exploration for re- standard procedures in place for appropriate aban-
lated commodities as well. donment using cement and bentonite, if needed. The
As reported by the EIA (2015t), total uranium thousands of historical holes are to be sealed when
drilling in 2014 was 1752 holes covering 1.3 million feet, encountered.
67% fewer holes than in 2013 and the lowest since Dewey-Burdock Project Manager Mark Hol-
2004. Expenditures for uranium drilling in the U.S. lenbeck of Edgemont said that they were ‘‘very
were $28 million in 2014, a decrease of 43% compared happy’’ with the science-based decisions that the
with 2013. Therefore, total expenditures for land, Court made. Hollenbeck said that all of the licensing
exploration, drilling, production, and reclamation boardÕs decisions upheld the Powertech scientific
were $240 million in 2014, 22% less than in 2013. presentations and data on water quality and
hydrology. The licensing board did rule in favor of
the Oglala Sioux Tribe on the unspecified threat the
Expenditures in the U.S mining operation would pose to Native American
cultural, historic, and religious sites in the well-fields,
Expenditures for U.S. uranium production, but these could be easily managed with the coop-
including facility expenses, were the largest category eration of the Tribe.
of expenditures at $138 million in 2014 but were
down by 18% from the 2013 level, as expected.
Uranium exploration expenditures were $11 million Historical Uranium Reserves Estimates in the U.S
and decreased 50% from 2013 to 2014. Expenditures
for land were $12 million in 2014, a 21% decrease Currently known uranium reserves in seven
compared with 2013. Reclamation expenditures were western states are estimated to total nearly 340
$52 million, a 5% decrease compared with 2013. million pounds U3O8 (EIA 2015u); about one-third
All of these declines were in direct response to of the reserves are in Wyoming. Other known re-
the decline in the price of yellowcake that was serves are in Arizona, Colorado, Nebraska, New
associated with the shutdown of the Japanese reac- Mexico, Texas, and Utah. Uranium deposits have
tors and overall impact of the damage to the reactors also been identified in Alaska, North Dakota, and
caused by Fukushima tsunamis in 2011. However, South Dakota, and in several other states, mostly in
the price is still expected to rise over the coming the western U.S. The largest known undeveloped
months (Money Morning 2008). uranium property in the U.S., and allegedly the
seventh largest in the world, is located on private
land at Coles Hill in south-central Virginia, near the
Significant Field Activities in the U.S North Carolina border. The deposit at Coles Hill is
estimated to contain some 60 million pounds of
The Rapid City Journal (2015) reported that uranium in a hard-rock environment, which would
Powertech Uranium, now Azarga Uranium, and be mined by open pit and later by underground
adversaries of a planned uranium mining operation methods and processed onsite to produce U3O8. The
in Custer and Fall River counties, South Dakota saw development of this deposit has been stalled by local
a recent NRC (U.S. Nuclear Regulatory Commis- opposition.Author's personal copy
456 American Association of Petroleum Geologists, Energy Minerals Division
Christopher (2007) prepared a technical report 1974 through 1983. Although the EIA (2015t) data
on the Virginia project. A geological summary of the collected by the Form EIA-851A survey covered a
deposit is provided by Dahlkamp (2010). It has yet to much smaller set of properties than the earlier re-
be confirmed that these reserves have been included port (EIA 2015u), the EIA believes that within its
in the EIA estimate of U.S. uranium reserves. scope the EIA-851A data provides more reliable
The EIA (2015u) estimated at the end of 2008 estimates of the uranium recoverable at the specified
that U.S. uranium reserves totaled 1227 million forward cost than estimates derived from 1974
pounds of U3O8 at maximum forward cost (MFC) of through 2002. In particular, this is because the
up to $100 per pound U3O8. At up to $50 per pound NURE data have not been comprehensively up-
U3O8, estimated reserves were 539 million pounds of dated in many years and are no longer a current data
U3O8. Based on average 1999–2008 consumption source. However, these data are very useful and
levels (processed uranium into fuel pellets then in- suggest that there are many additional uranium
serted into assemblies loaded into nuclear reactors), properties in the U.S. that deserve additional
uranium reserves available at up to $100 per pound exploration, the essential question of which revolves
of U3O8 represented about 23 years of operation around just how many of these will be found to
(EIA 2015u). At up to $50 per pound U3O8, how- contain economic reserves of uranium. If history is
ever, uranium available through in situ leaching was any guide to the future, more reserves will be iden-
about 40 percent of total reserves, somewhat higher tified as prices begin to rise over the near future and
than uranium in underground mines in that cost beyond.
category. ISL is the dominant mining method for
U.S. production today. These estimates are likely
conservative because proprietary industrial reserve Employment in the Uranium Industry
information may be substantially greater than gov-
ernment estimates of economic tonnage and grade The EIA (2015u) estimated total employment
of particular deposits. in the U.S. uranium production industry was 787
The EIA (2015t) announced that as of the end person-years in 2014, a decrease of 32% from the
of 2014, estimated uranium reserves were 45 million 2013 total and the lowest since 2006. Exploration
pounds U3O8 at MFC of up to $30 per pound of employment was 86 person-years, a 42% decrease
U3O8. At up to $50 per pound, estimated reserves compared with 2013. Mining employment was 246
were 163 million pounds U3O8. At up to $100 per person-years, and decreased 37% from 2013. Milling
pound, estimated reserves were 359 million pounds and processing employment was 293 person-years, a
U3O8. At the end of 2014, estimated uranium re- 30% decrease from 2013. Reclamation employment
serves for mines in production were 19 million decreased 19% to 161 person-years from 2013 to
pounds U3O8 at a maximum forward cost of up to 2014. Uranium production industry employment for
$50 per pound. Estimated reserves for properties in 2014 was in nine States: Arizona, Colorado, Ne-
development drilling and under development for braska, New Mexico, Oregon, Texas, Utah, Wash-
production were 38 million pounds U3O8 at MFC of ington, and Wyoming.
up to $50 per pound.
The EIA (2015t) claimed that the uranium re-
serve estimates from the 2015t report cannot be Nuclear Power Plant Operations in the U.S
compared with the much larger historical dataset of
uranium reserves published in the EIA (2015u). The Ninety-nine nuclear reactors are currently li-
earlier (EIA 2015u) reserve estimates were made censed in the U.S. (Fig. 5), five of which have been
based on data collected by EIA and data developed recently closed or are in the process of being shut-
by the National Uranium Resource Evaluation tered. Nuclear plants operate continuously and
(NURE) program, operated out of Grand Junction, generate 63 percent of U.S. carbon-free electricity,
Colorado, by DOE and predecessor organizations. but competitive electricity markets do not value
The EIA (2015t) data covered Roughly 200 uranium these attributes and some may be shuttered on
properties with reserve estimates, collected from economic grounds. VermontÕs only nuclear plant is a
1984 through 2002. case in point. The companyÕs operating revenues at
The NURE data covered roughly 800 uranium the Yankee 604-megawatt plant were squeezed by a
properties with reserve estimates, developed from combination of sagging electricity demand, lowAuthor's personal copy
Unconventional Energy Resources: 2015 Review 457
energy prices, and restructured markets that under- Nuclear Power Construction Overseas
value nuclear energyÕs contributions. Industry exec-
utives warned that more nuclear plants are under Nuclear power plant construction is expanding
financial strain and could close—a prospect that is of rapidly in China, India, Russia, and more than ten
concern to all regulators, especially since nuclear other countries. In particular, for review of current
power is the preferred energy resource, e.g., capacity reports on nuclear activities involving Russia readers
factor (Fig. 6). When a mid-size nuclear reactor in are referred to (World Nuclear Association 2015b)
Vermont permanently and prematurely shuts down, and (I2M Web Portal 2015o); Ukraine (World Nu-
it exacerbates instabilities in the energy markets of a clear Association 2015c; I2M Web Portal 2015p),
community and region already impacted by eco- and Kazakhstan (World Nuclear Association 2015d;
nomic uncertainties in that area. When Vermont lost I2M Web Portal 2015q).
its only nuclear power plant at the end of 2014, the
regionÕs electricity grid lost 604 megawatts of clean,
around-the-clock generating capacity, and the area Thorium Activities
will see an increase in carbon dioxide emissions, a
move that runs counter to national goals to reduce Ideas for using thorium as an energy resource
these emissions (Nuclear Energy Institute 2015b). have been around since the 1960s, and by 1973, there
were proposals for serious, concerted research in the
U.S. However, programs came to a halt due to the
Small Nuclear Reactors development of nuclear weapons.
The 1960s and 1970s were the height of the
Small modular reactors (SMRs) are getting in- Cold War and weaponization was the driving force
creased attention over the period, continuing an for all nuclear research. Nuclear research that did
upward trend in developing SMRs for standby use in not support the U.S. nuclear arsenal was not given
case of disasters, for remote areas, including off- priority (Warmflash 2015). Conventional nuclear
world, as well as for operating sector grids in small power using a fuel cycle involving uranium-235 and/
towns or in large cities where a number of SMRs or plutonium-239 was seen as meeting two objectives
would be located around the city. Numerous re- with one solution: reducing U.S. dependence on
search and development programs are underway on foreign oil, and creating the fuel needed for nuclear
SMRs by many companies in the U.S. and overseas. bombs. Thorium power, on the other hand, did not
Additional, updated information and media items have military potential. And by decreasing the need
on SMRs are compiled at I2M Web Portal (2015n) for conventional nuclear power, a potentially suc-
and described by World Nuclear Association cessful thorium program would have actually been
(2015b). reported by some as threatening to U.S. interests in
the Cold War environment.
Global leaders today are concerned about pro-
Spent Fuel Storage liferating nuclear technology which has led several
nations to take a closer look at thorium power
Spent nuclear fuel data are collected by the generation of electricity, especially China and India,
EIA for the Office of Civilian Radioactive Waste with technical assistance from the U.S. (Halper
Management (OCRWM). The spent nuclear fuel 2015). Hayes (2015) indicated that China, India, and
(SNF) data include detailed characteristics of SNF a few others are actively pursuing research on a
generated by commercial U.S. nuclear power plants. thorium-based nuclear fuel cycle for electricity
From 1983 through 1995, these data were collected production. This is based largely on the fact that
annually. Since 1996, these data have been collected India has not yet identified abundant uranium re-
every 3 years. The latest available detailed data sources, but does have substantial thorium ores.
cover all SNF discharged from commercial reactors Scientists in Shanghai have been ordered to
before December 31, 2002, and are maintained in a accelerate plans to build the first fully functioning
database. Additional information on spent fuel thorium reactor within 10 years, instead of 25 years
storage is available from the Nuclear Energy Insti- as originally planned (Evans-Pritchard 2015). China
tute (2015c). faces fierce competition from overseas and to getYou can also read