ELITE QUALITY REPORT 2020 - MUNICH PERSONAL REPEC ARCHIVE
←
→
Page content transcription
If your browser does not render page correctly, please read the page content below

Munich Personal RePEc Archive

Elite Quality Report 2020

Tomas, Casas i Klett and Guido, Cozzi

University of St. Gallen

3 September 2020

Online at https://mpra.ub.uni-muenchen.de/102768/
MPRA Paper No. 102768, posted 15 Sep 2020 14:33 UTC
ELITE QUALITY
REPORT 2020
32 COUNTRY SCORES
AND GLOBAL RANK
Value Creation fundamentals in societies:
Global metrics for long-term economic and human development

EQx Country Scores

   45   50   55   60    65

  --    Elite Quality    +

Tomas Casas i Klett, University of St.Gallen (FIM-HSG)
Guido Cozzi, University of St.Gallen (FGN-HSG)

                              Electronic copy available at: https://ssrn.com/abstract=3683526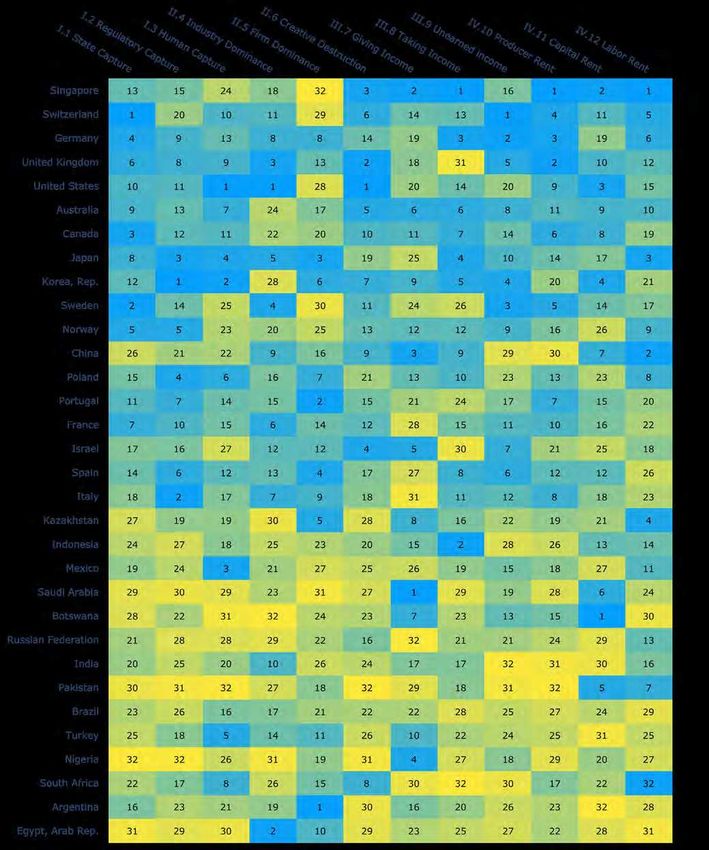
ELITE QUALITY
REPORT 2020

32 COUNTRY SCORES
AND GLOBAL RANK

Academic Leaders                            Strategic Partners                       Producer

                   Electronic copy available at: https://ssrn.com/abstract=3683526
Value Creation
             fundamentals in societies

Global metrics for long-term economic and human development

           Electronic copy available at: https://ssrn.com/abstract=3683526
Table of Contents

      EXECUTIVE SUMMARY                          .................................................................................................... 1

      1. INTRODUCTION

     1.1   Our System, Challenged ......................................................................................................             2
     1.2   A Gap, and One Worth Addressing? ....................................................................................                     3
     1.3   EQx Results at a Glance .......................................................................................................           4
     1.4   EQx, Open for You ..............................................................................................................          6

      2. HOW ‘ELITE QUALITY’ BECAME A GLOBAL INDEX

     2.1   Conceptual Framework & Definitions ..................................................................................... 8
     2.2   EQx Architecture ............................................................................................................... 12
     2.3   EQx Pillars ........................................................................................................................ 13
     2.4   EQx Methodology Introduction ............................................................................................ 14
     2.5   Statistical Assessment ......................................................................................................... 16

      3. EQX RESULTS

     3.1   Elite Quality Country Score, Global Rank and Highlights ......................................................                          20
     3.2   State of Elites Framework: Country Mapping and Highlights ..................................................                            22
     3.3   Value Creation vs Value Extraction Configuration .................................................................                      24
     3.4   Pillar Results ......................................................................................................................   26
iv
      4. EQX COUNTRY ANALYSIS

     4.1   Selected Country Flashcards ...............................................................................................             32
     4.2   Country Scorecards: Deep Dive Analysis .............................................................................                    34
     4.3   Extreme Country Performances by Pillar ...............................................................................                  52
     4.4   Special Regional Analysis: North East Asia ..........................................................................                   54
     4.5   EQx, Ultimate Signal for Long Term Growth .........................................................................                     58

      5. TODAY’S CALL FOR ELITES ........................................................................................ 60

      6. EXHIBITS

     6.1   EQx Forthcoming Research Questions .................................................................................                    62
     6.2   Methodological Note ..........................................................................................................          64
     6.3   EQx Continuous Development Plans? ...................................................................................                   67
     6.4   EQx Indicators Table ............................................................................................................       68
                                                                                                                                                    .
      7. REFERENCES

     7.1 General Literature .............................................................................................................. 80
     7.2 Data Sources, Indicators References .................................................................................... 82
     7.3 End Notes .........................................................................................................................
                      .                                                                                                                      87

                                        Electronic copy available at: https://ssrn.com/abstract=3683526
List of Visuals
 Visual 01:   Turmoil’s questions ................................................................................................... 2
 Visual 02:   Elite quality as potential research gap ........................................................................ 3
 Visual 03:   EQx Elite Quality Global Map .................................................................................. 4
 Visual 04:   Micro perspective of Elite Quality .............................................................................. 8
 Visual 05:   Macro perspective of Elite Quality ............................................................................. 9
 Visual 06:   Index Areas matrix ................................................................................................. 10
 Visual 07:   EQx Architecture .................................................................................................... 12
 Visual 08:   EQx Architecture, specific ....................................................................................... 13
 Visual 09:   EQx’s 9 step construction process ............................................................................ 14
 Visual 10:   EQx weighting overview ......................................................................................... 15
 Visual 11:   EQx statistical assessment tests ................................................................................ 16
 Visual 12:   Test 1, on Indicators ................................................................................................ 17
 Visual 13:   Test 1, on Pillars ..................................................................................................... 17
 Visual 14:   EQx2020 table of Country Scores and Globa Rank .................................................. 20
 Visual 15:   State of Elites framework, description ....................................................................... 22
 Visual 16:   EQx2020 State of Elites Framework ......................................................................... 23
 Visual 17:   Value Creation vs Extraction Configuration ............................................................... 24
 Visual 18:   Index Area (i) – Political Power Pillars ...................................................................... 26
 Visual 19:   Index Area (ii) – Economic Power Pillars .................................................................. 27
 Visual 20:   Index Area (iii) – Political Value Pillars ..................................................................... 28
 Visual 21:   Index Area (iv) – Economic Value Pillars ................................................................... 29
 Visual 22:   Table of complete EQx Pillars by Country Scores ....................................................... 30
 Visual 23:   Table of complete EQx Pillars by Global Rank .......................................................... 31
 Visual 24:   France performance overview by EQx Pillar ............................................................. 34
 Visual 25:   France EQx Country Scorecard ............................................................................... 35               v
 Visual 26:   Germany performance overview by EQx Pillar ......................................................... 36
 Visual 27:   Germany EQx Country Scorecard ........................................................................... 37
 Visual 28:   Italy performance overview by EQx Pillar                    ............................................................ 38
 Visual 29:   Italy EQx Country Scorecard .................................................................................. 39
 Visual 30:   Japan performance overview by EQx Pillar .............................................................. 40
 Visual 31:   Japan EQx Country Scorecard ................................................................................ 41
 Visual 32:   Norway performance overview by EQx Pillar ........................................................... 42
 Visual 33:   Norway EQx Country Scorecard ............................................................................. 43
 Visual 34:   Portugal performance overview by EQx Pillar .......................................................... 44
 Visual 35:   Portugal EQx Country Scorecard ............................................................................. 45
 Visual 36:   Russian Federation performance overview by EQx Pillar ........................................... 46
 Visual 37:   Russian Federation EQx Country Scorecard ............................................................. 47
 Visual 38:   Turkey performance overview by EQx Pillar ............................................................. 48
 Visual 39:   Turkey EQx Country Scorecard ............................................................................... 49
 Visual 40:   United States performance overview by EQx Pillar .................................................... 50
 Visual 41:   United States EQx Country Scorecard ...................................................................... 51
 Visual 42:   Highest performing countries (3) by Pillar ................................................................. 52
 Visual 43:   Lowest performing countries (3) by Pillar .................................................................. 53
 Visual 44:   Japan, Korea, China - Regional Comparison ........................................................... 55
 Visual 45:   EQx’s correlation with GDP per capita PPP ............................................................... 58
 Visual 46:   Fitted value differential ........................................................................................... 59
 Visual 47:   EQx’s correlation with the Human Development Index ............................................ 62
 Visual 48:   EQx’s correlation with the WEF Global Competitiveness Index                               .............................. 63
 Visual 49:   EQx Weighting, overview table ............................................................................... 66
 Visual 50    EQx Indicators table ............................................................................................... 68
 Visual 51:   EQx Indicator weighting table ................................................................................. 78

                           Electronic copy available at: https://ssrn.com/abstract=3683526
The Abbey Library of St.Gallen (Stiftsbibliothek) in Switzerland has its roots tracing back to
                         medieval times having for over a millennia served as a repository of knowledge
                                                          Luca Zanier Photography, Corridors of Power Project

Electronic copy available at: https://ssrn.com/abstract=3683526
Executive Summary
Elite Quality determines human                                  EQx measures Elite Quality
and economic development
                                                                •   We present the first ever international measurement of
•    Elites are an empirical inevitability, dominating all          Elite Quality, the Elite Quality Index (EQx) for 32 coun-
     political economies. They provide necessary coordi-            tries. We use 72 Indicators describing Value Creation/
     nation capacity for the economy’s resources, whether           Extraction. The Index architecture includes Power (Sub-In-
     human, financial or knowledge-based.                           dex I), a measurement of future Value Extraction potenti-
                                                                    al, and Value itself (Sub-Index II) and 12 Pillars (e.g.
•    By determining institutions that enable coordination,
                                                                    Creative Destruction, Human Capture or Producer Rent).
     elites shape human and economic development, the
     destiny of societies, the wealth of nations, and their     •   Elite Quality is an analytical framework based on
     rise and fall.                                                 economic and management theory designed to inter-
                                                                    pret – and possibly transform – the state of the world
•    To sustain their position, elites run business models
                                                                    and its future.
     that accumulate wealth. High-quality elites run Value
     Creation business models that give more to society         •   This EQx2020 Report is the first, experimental version
     than they take. Low-quality elites do the opposite and         of what will be an annual publication. In early Janu-
     operate Value Extraction models.                               ary 2021 we are launching the EQx2021 on the
                                                                    theme of Elite Value Creation and Covid-19.

What did the EQx2020 research discover?

1. There exist substantial differences in the states of                                          Global    Country
   Elite Quality around the world.                                         Country
                                                                                                  Rank      Score

2.   Singapore is number one. While its score is pena-                     Singapore                1        68.5

     lized on account of high Power, the city state’s elites               Switzerland              2        64.9
                                                                           Germany                  3        64.2                   1
     are by far the highest value creators on the planet.
                                                                           United Kingdom           4        63.9
3. The successful Germanic elite model employed in                         United States            5        63.4
   Switzerland (2nd) and Germany (3rd) fosters a high-le-                  Australia                6        63.2
   vel of Value Creation, notwithstanding improvement                      Canada                   7        61.9
   potential in various areas.                                             Japan                    8        61.6
                                                                           Korea, Rep.              9        61.2
4. We find Anglo-Saxon elites to be high-quality
                                                                           Sweden                  10        59.7
   and are led by the U.K. (4th) and the U.S. (5th). Interes-
                                                                           Norway                  11        58.6
   tingly, American and British elites manage to rent seek
                                                                           China                   12        58.4
   more than their top Power Sub-Index scores (1st and
                                                                           Poland                  13        58.3
   2nd), derived from excellent institutions, seem to war-
                                                                           Portugal                14        58.0
   rant.
                                                                           France                  15        57.4
5. Emerging superpower China has super elites co-                          Israel                  16        56.9
   ming in 12th, at a level much higher than its peers in                  Italy                   17        55.5
   the middle-income category, and outperforming                           Spain                   18        55.5
   many advanced E.U. countries.                                           Kazakhstan              19        52.7
                                                                           Indonesia               20        52.0
6. BRIS countries are clustered in the lower levels.                       Mexico                  21        50.7
   Russia, India, Brazil and South Africa – in that                        Saudi Arabia            22        49.2
   order – rank between 23rd and 30th.                                     Russian Federation      23        48.9
                                                                           Botswana                24        48.9
7. Many African elites are rent seekers, approxima-
                                                                           India                   25        45.4
   tely as powerful as elites in China or Poland but sco-
                                                                           Pakistan                26        44.5
   ring lowest of all surveyed countries because of high
   Value Extraction activities.                                            Brazil                  27        44.1
                                                                           Turkey                  28        43.3
8.   The E.U. is split by Elite Quality, with Country                      Nigeria                 29        42.4
     Scores varying significantly. Behind top-scorer Ger-                  South Africa            30        41.7
     many there is the cluster of Sweden (10th), Poland                    Argentina               31        41.6
     (13th), Portugal (14th), France (15th), followed by a                 Egypt, Arab Rep.        32        40.0
     lagging one with Italy (17th) and Spain (18th).

                                                                                                    Elite Quality Report, EQx2020
                           Electronic copy available at: https://ssrn.com/abstract=3683526
1. Introduction:
       Measuring Value in the Political Economy

    More value had been created by early 2020 than at any                – One-off high-impact events like Brexit and black swans
    other time in economic history. Material improvements re-              of all kinds lurking across emerging markets, Wall
    sulting from Value Creation through pioneering science,                Street, the South China Sea and in health systems
    innovative services and smart business models are still                worldwide
    enormous and evident. Humanity’s relentless ingenuity                – Populist and anti-establishment politicians, on the Far
    yields increasing benefits for all, enabled by the consoli-            Right and on the Radical Left
    dation of phenomenal global coordination mechanisms                  – The rampant invasion of fake news and disinformation
    such as narratives1 and, yes, the elites. Yet, despite the ac-         campaigns, as well as targeted cyber attacks
    celerating prodigious output of our collective work, values          – The human tragedy of refugees and the hard responses
    and creativity, discontent, disorder and distress are on the rise.     of those who feel threatened by immigration and the
                                                                           ‘other’
    1.1 Our System, Challenged?                                          – Raging debates within our societies and across the world
                                                                           over how to define our obligations and relations to one
    Since 2008, nations – their political and business leaders,            another, especially during the crisis caused by Covid-19
    narratives and core values – have faced vigorous challenges
    on multiple and largely unforeseen fronts. Numerous voices           Within the top echelons of the political economy, there is no
    claim that we are undergoing, even before the 21st century’s         president, no CEO, no technology tycoon, nor general who
    inflection pandemic year of 2020, an assault on order of a           purports to know the full impact and extent of the disruptions
    ferocity not seen since the 1930s. Social, economic and po-          in store. The coming years promise to be interesting, and
    litical forces might be gathering momentum to disrupt or             there is a keen awareness that unwelcome transformations,
    even destruct in ways we cannot seem to predict. A glance            very costly to many groups in society, are on the horizon. We
2   at the current world situation demonstrates this:                    face takeovers by extremist political leadership with national-
                                                                         ist narratives, destruction of business of the non-creative kind,
    – Protest movements and escalating riots, especially by              the breakdown of health care and even of public order. Par-
      the young and the disenfranchised                                  tial systemic collapse, while still very unlikely, is indeed no
    – Unchartered combinations of secular stagnation,                    longer unthinkable.
      stagnant wages, and sub-zero interest rates, along with
      increasing inequality                                              It is critical to understand the deep causes of discontent if
    – Trade wars, sanctions, technology embargoes and                    we are to address them. We are familiar with the generally
      deglobalization                                                    accepted narratives for what is wrong, all amply discussed in
    – The extinction rebellion and rapid real-time environmen-           the public domain.
      tal degradation, confronting us with irreversible losses

    Visual 1: Turmoil’s questions: Beginning or end? The beginning of what? What are the causes?

    Chapter 1 : Introduction
                                   Electronic copy available at: https://ssrn.com/abstract=3683526
What are ‘elites’?

       Definition: Elites are narrow, coordinated groups with business models that successfully accumulate wealth;
       they are an empirical inevitability and exist in every society on earth. In short:

       Surprise 1: Elites are a                       Fact 1: Elites can be                         Hypothesis: Elite Quality
       mathematical certainty;                        high-quality value creators                   determines economic and
       they are inevitable                                                                          human development

                                                      Fact 2: Elites can also be                    Action: We measure Elite
       Surprise 2: Elites supply
       essential coordination                         low-quality value extractors                  Quality by the Elite Quality
       capacity to society                                                                          Index (EQx)

        Takeaway: EQx is a political economy index that measures the ability of the business models of the elite in a
        country – on aggregate – to create value, rather than rent seek

Generally accepted causes of discontent that stand out include:            transform – the state of the world and its future prospects. It is
                                                                           based on a simple idea.
– Technology, automatization destroys jobs and creates
  a new digitally illiterate underclass                                    EQx holds that the business models chosen and run by elites
– Globalization, produces the losers of the “flat world”                   are at the origin of a causal chain that leads to economic and
  who react and push for fragmentation                                     human development. Elites (the ‘who’) affect human and eco-
– Demographics, the onset of aging societies makes                         nomic development outcomes (the ‘what’), sometimes directly
  the economy irremediably less productive                                 and mostly indirectly via their sway on institutions (the ‘how’)
– Geopolitics, sees big power rivalries reconfigure and                    that lay down the rules of the game. Rules give elites the ‘license
  lessen business spaces at significant costs                              to operate’. Both the ‘how’ and the ‘what’ are amply mea-
– Irrational behaviors, as in populism, racism, business                   sured. For instance, the World Bank’s Ease of Doing Business
  short-termism or police brutality, harm the public interest              Index (DBI) measures the latter while the World Economic Fo-          3
– Black Swan events, like new viruses, water emergen-                      rum’s Global Competitiveness Index (GCI) or the United Na-
  cies or financial crises erode institutions                              tions’ Human Development Index (HDI) measures the former.

What if the above diagnosis is incomplete? These main-                     Measuring the ‘who’ of the political economy is the research
stream factors might bear less than full responsibility for hu-            gap which we seek to pursue. We do so at the national aggre-
man development and declining relative prosperity levels that              gate level, i.e. the elites in terms of their business models’ Val-
significant segments of society in many countries experience.              ue Creation and Value Extraction choices.

1.2 A Gap, and One Worth Addressing?                                       Addressing the identified research gap will, as a next step, in-
                                                                           volve linking what we term ‘Elite Quality’ to economic and so-
The Elite Quality Index (also the Index or EQx) proposes an                cial outcome Indicators, such as growth, competitiveness, total
alternative analytical framework to interpret – and possibly               factor productivity (TFP) and human development. Sections
                                                                           4.5 and 6.1 discuss the larger research project associated
                                                                           with EQx including its medium-term growth predictor potential.

Visual 2: Elite Quality as potential research gap
                    Source: Casas, 2020, Figure 7 (modified)

                        [Who]                                          [How]                                            [What]
 Research Gap

                       Elite                                      Institutional                              Human & Economic
                      Quality                                       Quality                                    Development

                Value Creation/Extraction                      Value Creation/Extraction                       Value Creation/Extraction
                   business models                              incentive structures                                    actual

                                                                                                                Elite Quality Report, EQx2020
                                     Electronic copy available at: https://ssrn.com/abstract=3683526
1.3 EQx Results at a Glance
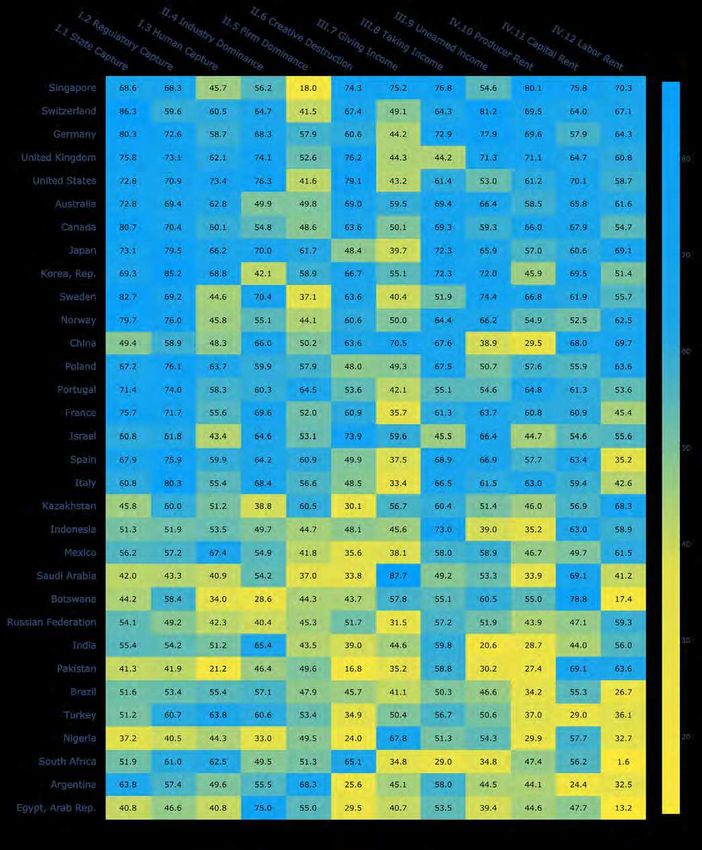
Visual 3: EQx Elite Quality Global Map, color-adjusted Country Scores
POLAND
Country Score: 58.3
Global Rank: 13
High Elite Quality levels for
middle-income EU member
GERMANY
Country Score: 64.1
Global Rank: 3
Incumbent elites of excellent quality,
if only undertook creative destruction
UNITED STATES
Country Score: 63.3 FRANCE
Global Rank: 5 Country Score: 57.3
Amazing strengths with Global Rank: 15
a few but critical weaknesses Very average elites for Europe,
certainly not grande
4 MEXICO
Country Score: 50.8
Global Rank: 21
Leading Elite Quality in Latam
EQx
Country Scores
65
60
ARGENTINA
55 Country Score: 41.5
Global Rank: 30
Deep Elite Quality crisis
50
45
Chapter 1 : Introduction
Electronic copy available at: https://ssrn.com/abstract=3683526RUSSIA
Country Score: 48.9
Global Rank: 24
Topmost of the BRICS (not incl. China)
CHINA
Country Score: 58.4
Global Rank: 12
The Elite Quality of an advanced economy,
promising growth years ahead
5
INDIA
Country Score: 45.3
Global Rank: 25
Fast growth ahead
if Elite Quality improves
BOTSWANA SINGAPORE
Country Score: 48.9 Country Score: 68.7
Global Rank: 23 Global Rank: 1
African Elite Quality leader, Stellar performance, out of this world
auspicious future
Elite Quality Report, EQx2020
Electronic copy available at: https://ssrn.com/abstract=36835261.4 EQx, Open for You
The EQx research project is open and participative. We Management Platform (IMP) is to solicit and organize po-
are designing the infrastructure for a vibrant community tential inputs and ideas. Future project stakeholders can be
that is inspired by the subject of Elite Quality and its poten- users, dataset contributors, researchers or partners.
tial impact. The motivation behind the online EQx Index
Who are EQx users?
The EQx project is inclusive by definition, and welcomes anybody who is curious about the economy, the
political economy, global comparative indices, business models, power, the idea of value, the future of society,
or even current affairs.
EQx is setting up the IMP infrastructure so users can make the index their own, carry out hands-on online
simulations with the EQx dataset and reach their very own insights and conclusions, beyond those supplied
by EQx Reports.
The IMP will be available soon at www.imp.elitequality.org
Call to dataset contributors
6
Who can become EQx Dataset Contributor?
We encourage submission of original ideas for Indicator data. All ideas for novel, measurable Indicator con-
structs are considered as long as they describe Value Creation/Extraction phenomena in the economy. More-
over, we are open to switch existing datasets with higher-quality sources. Contributions will be duly acknowl-
edged and credited.
Contact us with your original thoughts and suggestions at datasets@elitequality.org
Call to researchers
The EQx project’s ethos is that of an open global research community. The EQx2020 Report is a call to parties
interested in jointly developing EQx academic projects of a theoretical or empirical nature that aim at leading
peer reviewed publications.
Our purpose is to develop practical insights, including for policy. In this regard we look to research partners
wishing to take responsibility for a country or region, including the integrity of local data and the interpreta-
tion of local results.
Reach us at research@elitequality.org and let’s discuss collaboration.
Chapter 1 : Introduction
Electronic copy available at: https://ssrn.com/abstract=3683526Do you wish to partner with the Foundation for Value Creation (FVC)?
The Foundation provides the coordination that brings to life EQx, much of its underlying research and related
publications. You might want to engage and associate your institution – or yourself personally – with our
non-profit Foundation for a variety of reasons. These might include social engagement, the development of
public discourse or the design concrete policy proposals. You might also wish to become a benefactor.
Whether you are running an elite business model or are a concerned citizen, there are many motivations for
establishing strategies to “grow the pie” in your political economy. We encourage you to shape your country’s
institutions and the narratives on Value, possibility in partnership with FVC.
Start a conversation with us at benefactor@valuecreation.org
7
Elite Quality Report, EQx2020
Electronic copy available at: https://ssrn.com/abstract=36835262. How ‘Elite Quality’ Became a Global Index
2.1 Conceptual Framework & Definitions
The Elite Quality Index (EQx) proposes an alternative analyt- Crucially, as part of their wealth accumulation, elites choose
ical framework to interpret – and possibly transform – the business models that either create value or rent seek. As sum-
state of the world and ‘available futures’. Our key conceptual marized by Hillman and Ursprung (2015, p.3), “in the rent
underpinning is that elites are a central observable phenom- seeking literature, a rent is an unearned reward sought
enon in political economies, a mathematical certainty exist- through a quest for privilege. The seeking of rents is personal-
ing in every society on earth. ly beneficial … but social loss is incurred because resources
are used in non-productive distributive quests”. The 2 con-
In this study, elites are defined as the relevant leaders possess- cepts are antagonists (Value ≠ Rent) but they are also 2 sides
ing the strongest coordination capacity over society’s key re- of the very same coin. In their fundamental form, Value and
sources, such as human, financial and other capital. Elites, as Rent are at the 2 ends of the business model spectrum, which
rational economic agents, must aim to maximize their wealth, EQx names Value Creation and Value Extraction. From the
utilizing their talent, resources and coordination capacity. micro perspective, where the unit of analysis is the individual
Elites are thus the narrow, coordinated groups within coun- organization or the decision-maker, value creating ‘high-qual-
tries that implement business models which successfully accu- ity’ elites run business models that create more value than
mulate wealth. they capture. ‘Low-quality’ elites do the opposite.
Visual 4: Micro perspective of Elite Quality: EQx icons representing elites’ business model choice
“Capture more or capture less value than create”
8 Elite Quality: High Elite Quality: Low
Value creating elites Value extracting elites
Create more value than capture Capture more value than create
The choices made at the micro-level have an impact on the Prosperity for the wider nation, we claim, depends mainly on
macro, i.e. the level of the economy as a whole. In simple the nature of the business models chosen by elites. Specifical-
terms, rent seeking is the means by which low-quality elites in- ly, whether elites allocate society’s key resources like savings,
crease their own slice of the (economy’s) pie at the expense of talent, or land to value boosting (or reducing) projects. At one
the non-elites. This happens when business models are based extreme, “rentier capitalism” is the state where “economic
on monopolies, certain subsidies, trade tariffs or even on the and political power allows privileged individuals and busi-
most appalling phenomenon of slavery (which regrettably still nesses to extract a great deal of such rent from everybody
exists in the 21st century, as the Global Slavery Index annually else” (Wolf, 2019). Rent seeking policies pursued by low-qual-
reports). Elites can also choose a business model that predom- ity elites result in less competition and thus lower efficiency
inantly creates value, rather than extracts value. We call elites (Clements & Parry, 2018, p.56). By contrast, high-quality
that grow the whole pie to increase their own wealth and in elites have a transformative role in the political economy –
doing so enrich their own country, ‘high-quality’. and on society in general – because by definition they give
more than they take.
Chapter 2 : How Elite Quality Became a Global Index
Electronic copy available at: https://ssrn.com/abstract=3683526Visual 5: Macro perspective of Elite Quality: Economic impact of elites’ business model choice
“To grow my own slice or the whole pie?”2
Elite Quality: Low Elite Quality: High
The economy Grow the slice Grow the pie
As policies, leaders and circumstances change, so too do and incentives. These reforms should galvanize a country’s ex-
Elite Quality and economic and human development out- isting coordination capacity toward Value Creation business
comes. Often, decisions are made by elites to transition models, while disincentivizing rent seeking Value Extraction.
their interests from one business model to the opposite. A
rentier elite in the traditional energy sector might take a risk EQx holds that the operation of Value Creation business
and invest in 4th industrial revolution technologies, while a models is in the long-term best interests of the elites, their
value creating elite in an advanced industrial sector might families and associates. By creating value, not only does the
leverage political power for a trade barrier or force a regu- elite’s own wealth grow not at the expense of others’, but 9
lation that pre-empts innovative new entrants. Voilà! A value the process of wealth accumulation also accrues social legit-
creating business model is transformed into a rent seeking imacy, as it infuses society with public goods and inclusive
one, or vice versa. This fluidity motivates the annual release economic growth.
of the EQx Index and exposes the ability for constructive
changes by elites themselves and policymakers based on On the other hand, if elites fail to progress out of an impasse,
the information gathered herein. such as one caused by technological changes, discontent or
even revolutionary forces may ensue and partially or com-
Equally, a political economy may be shaken by highly disrup- pletely demolish the system, often with symbolic and non-sym-
tive episodes. For instance, in the 21st century we have seen bolic acts intended to punish or vanquish elites. The rise (and
the 4th Industrial Revolution, China’s rise and even a pandem- fall) of nations is therefore primarily a function of changes in
ic. As technological and social contexts evolve, business Elite Quality. That is, whether national elites – on aggregate
models that once created value are naturally overtaken by – increasingly create more value than they capture.
more innovative models, as human creativity and ingenuity
never cease. When the prevalent business models in an econ- The EQx Index – with its Country Score and Global Rank – is
omy do not keep up with possibilities afforded by technolog- a heuristic that aims to measure these changes, by operational-
ical and social advancement, stagnation occurs. Elite busi- izing the discussed political economy concepts and equating
ness models can also, using a Keynesian analogy, be ‘sticky’. them to actual levels of Value Creation and Value Extraction.
EQx is then a macro signal, or possibly a fundamental inde-
Elites can face disruption by using their coordination capacity pendent indicator, determining long-term economic growth
to accomplish Schumpeterian creative destruction with innova- and the wealth of nations which result from high-quality elites.
tive business models, thereby creating value, or they can do We operationalize Elite Quality by developing Sub-Indices I
the opposite and become reactionary, seeking rents. Transfor- and II: Power and Value.
mations aiming at long-term economic and human develop-
ment revolve around concrete, industry-by-industry reforms
Elite Quality Report, EQx2020
Electronic copy available at: https://ssrn.com/abstract=3683526The Value Sub-Index II is anchored in the ideas of Value Cre- seeking per se, since power is a necessary, but not sufficient
ation developed in management and in rent seeking theo- condition. In some countries, elites enjoying high degrees of
ries of economics. Value Creation and rent seeking Value power invest in and run Value Creation business models.
Extraction are on opposite sides of the same continuum.
Elite business models are somewhere in the range between Given that EQx is a political economy index, the Power
Value Creation, at one extreme, and Value Extraction on the Sub-Index I and the Value Sub-Index II each possess the cor-
other. The EQx mandate is to incorporate datasets that sup- responding 2 Dimensions: Political and Economic. While
ply evidence of Value Creation/Extraction, even though the these 2 political economy terms might be self-explanatory,
latter might be easier to ascertain and measure, because the definitions of all 4 Index terms are conveniently provid-
rent seeking results are visible and affected via concrete in- ed on the next page.
terventions in politics.
Combining the 2 Sub-Indices with the 2 Dimensions brings
How is power in the Power Sub-Index I measured? Distor- forth EQx’s 4 Index Areas. Each EQx Index Area is brought
tions that enable rent seeking business models require pow- to life by 3 conceptually related Pillars, which are the direct
er. Since there is no rent seeking without power, power is host of the different datasets – the Indicators – that feed the
conceptualized as rent seeking potential. Power is not rent Index with data. The matrix from which the 4 EQx Index
Area quadrants emerge is presented below.
10
Visual 6: Index Areas matrix, where Power and Value Sub-Indices meet Political and Economic Dimensions
Chapter 2 : How Elite Quality Became a Global Index
Electronic copy available at: https://ssrn.com/abstract=3683526What is Power?
The capacity to enforce one’s preferences; Power is also Value Extraction potential
What is Value?
The outcome of productive activities; its creation increases the overall economic pie
What is Political?
11
The dimension where business model rules are determined, and Value Creation/Extraction is enabled
What is Economic?
The dimension where Value Creation/Extraction is implemented via suitable business models
Elite Quality Report, EQx2020
Electronic copy available at: https://ssrn.com/abstract=36835262.2 EQx Architecture
The architectural design of EQx has been conceived of as a (Level 3) are – in turn – grouped according to 4 Index Areas
4-level structure (Casas, 2020). (Level 2). The 4 Index Areas are the product of a 2x2 matrix
where the Power Sub-Index I and the Value Sub-Index II meet the
From the bottom up, EQx is based on a transparent series of Political Dimension and the Economic Dimension. For the Power
selected datasets, operationalized as indivisible Indicators Sub-Index I and Value Sub-Index II and for all the 12 Pillars, EQx
(Level 4). The respective datasets are collected, conceptually provides both Country Scores and the Global Rank.
validated, collated and referenced (see section 7.2). They
come from open, government and varied sources including At the top of the EQx architecture, the 4 Index Areas come to-
the World Bank, the IMF, the finance industry or other indices. gether to produce the Elite Quality Index, EQx (Level 1), with
Selected Indicators are developed by the EQx team of re- its Country Scores and Global Rank.
searchers and collaborators. For each EQx Indicator and its
underlying dataset there is a clear rationale of how they reflect The index architecture provides the methodological structure
Value Creation or its opposite, Value Extraction (see Indicators for the EQx construction, which is detailed in-depth in the EQx
table in section 6.4). Methodology Paper. The document can be downloaded at:
https://elitequality.org/methodology_paper. Various method-
Each of the (currently) 72 Indicators is logically connected to ological aspects of EQx are available in sections 2.4 (Meth-
a corresponding Pillar (Level 3), which are described in detail odology Introduction), 2.5 (Statistical Assessment), 6.2 (Meth-
in sections 2.3 (conceptually) and 3.4 (results). The 12 Pillars odological Note).
Visual 7: EQx Architecture
Source: Casas, 2020, Figure 9 (modified)
(x1)
Index
12 Level 1
(x2)
Sub-Indices
Level 2
(x12)
Pillars
Level 3
(x72)
Indicators
Level 4
Chapter 2 : How Elite Quality Became a Global Index
Electronic copy available at: https://ssrn.com/abstract=36835262.3 EQx Pillars
The 12 EQx Pillars each capture a specific element of the Eco- The Political Value Pillars are named ‘Giving Income’ (iii.7),
nomic and Political Power/Value complex present in coun- ‘Taking Income’ (iii.8) and ‘Unearned Income’ (iii.9), and reflect
tries. The purpose of the Pillars is to define and form concep- policy decisions in the political sphere that concern redistribu-
tual lenses through which we can approach, understand and tion in the broadest sense, as in Acemoglu and Robinson
measure specific phenomena. They comprise a weighted sum (2012, p.76) “from one subset of society to benefit a different
of expertly chosen Indicators which numerically evidence subset”. An important point here is that we only consider the
present or potential future Value Creation or rent seeking. merits of such redistribution in terms of Value and try to assess
for each surveyed Indicator whether it is extracted or created.
The Political Power Pillars were selected to address the ‘Giving Income’ measures how the government uses and man-
capture of 3 kinds of rules: the rules of the state via the ‘State ages public finances, looking at the provision of public goods
Capture’ (i.1) Pillar, the rules of business regulation via ‘Reg- such as education or the amount of subsidies distributed in an
ulatory Capture’ (i.2), and the rules for labor markets and civ- economy. ‘Taking Income’ addresses how the state collects such
il service jobs via ‘Human Capture’ (i.3). ‘State Capture’ ad- income, as in Delta capital gains tax vs income tax (DKI, iii.8),
dresses how distributional coalitions capture the state and its or whether it allows income or the ultimate value – life – to be
government branches like with Political corruption (COR, i.1). taken as in Homicide rate (HOM, iii.8). The ‘Unearned Income’
‘Regulatory Capture’ suggests the extent to which rules and Pillar focuses on the exploitation of natural resources such as
regulation, both in terms of process and output, have been Dutch disease propensity (DUT, iii.9), or of the future at the ex-
captured by interest groups. ‘Human Capture’ accounts for pense of the present like Government debt as % of GDP (DBT,
the power of labor and civil service coalitions, including any iii.8). Political Value offers a picture of the degree to which pro-
privileges in the political system, as well as their ability to in- duction has been channeled into or shifted away from innova-
fluence wages and working conditions. tive and wealth-creating sectors of the economy (Porter, 1990).
The Economic Power Pillars measure elite ‘Industry Domi- The Economic Value Pillars directly measure the extent of
nance’ (ii.4) and ‘Firm Dominance’ (ii.5) within the economy, as Value Creation (or Extraction) from the economy’s 3 markets:
well as the opposite: the extent of ‘Creative Destruction’ (ii.6). the products & services markets, the capital markets and the
‘Industry Dominance’ measures the dominance of leading in- labor markets. ‘Producer Rent’ (iv.10) estimates the rents ex- 13
dustries by measuring the degree of diversity in an economy. tracted by producers and suppliers in the market for goods
‘Firm Dominance’ measures the power of single businesses and services, whilst ‘Capital Rent’ (iv.11) measures the rents
within the economy, with Indicators such as Antitrust exemptions extracted both directly and indirectly as a result of financial
(ATX, ii.5). We borrow Schumpeter’s (1942) concept of ‘Cre- market participation. ‘Labor Rent’ (iv.12), which includes Indi-
ative Destruction’ – the replacement of outdated by innovative cators such as Unemployment rate (UEM, iv.12) and the Gen-
structures – for the third Economic Power Pillar which includes der wage gap (GVG, iv.12), allows us to assess the rents aris-
measures of Entrepreneurship (ENT, ii.6) and VC finance (VCK, ing within a country from interventions by both supply and
ii.6). The aim is to measure the pressures for renewal and dis- demand forces in the labor market.
ruption in the economy which fuel Value Creation.
Visual 8: EQx Architecture, specifying Level 2 and 3 constituents
Elite Quality Report, EQx2020
Electronic copy available at: https://ssrn.com/abstract=36835262.4 EQx Methodology Introduction Weighting Scheme
EQx aims to be an academically grounded and statistically The Indicator weighting scheme of any index is decisive, de-
valid measure of Elite Quality. At the same time, judgement termining scores and rank. Best practices in index construction
calls are inevitable during the process of index construction see weights explicitly made consistent with the index concept
(Mazziotta & Pareto, 2013, p.74). Therefore, EQx’s overar- and made transparent. In other words, first, a weighting
ching objective is to make the procedure as clear and trans- scheme must reflect what the index aims to measure. Second,
parent, and hence as justifiable as possible (Santeramo, each of the datasets that constitute the index must see their
2017, p.135). In consequence, the underlying assumptions weight assigned in a documented and traceable manner.
and methods used for index construction are presented and
evaluated in detail in Measuring Elite Quality (Casas, Cozzi, In EQx, the fundamental datasets are the Indicators, and they
Diebold, & Zeller, 2020), a.k.a. the EQx Methodology Paper. all denote present or future Value Creation (≠ Extraction) phe-
nomena. For instance, Indicators considered include Firm Con-
The steps underlying the EQx Index construction are shown in centration (HHI, ii.5), Global Pluralism Index (PLU, i.1), Trade
Visual 9 below. Steps 1 and 2 are detailed in the EQx White freedom (TRF, iv.10), Firm exit ratio (EXR, ii.6), Crony capital-
Paper (Casas, 2020) and summarized in sections 1 to 3 of ism (CRO, i.2), Natural interest rate deviation from optimum
this report. Steps 3 to 8 are developed in detail in the EQx (DNI, iv.11), or Corporate tax rate deviation from optimum
Methodology Paper, and a brief summary is supplied in the (DCT, iii.8) (for the full EQx Indicators list, see Exhibit 6.4). The
Exhibit section 6.2. In this report we focus on the construction weight of each Indicator in EQx depends on the weight of that
process and the weighting, and provide a brief summary of Indicator (Level 4) within its Pillar (Level 3), the weight of the
the main methodological steps for reference purposes. The Pillar (Level 3) within the Index Area, and the weight of the In-
weighting part of Step 6 is examined in this section, while the dex Areas (Level 2) within the EQx Index (Level 1).
statistical assessment, Step 8, is concisely summarized in the
next section, 2.5. The results of Step 7 are presented in the What does the EQx Index aim to measure? Again, the overall
report which is the realization of Step 9. Elite Quality of nations in terms of the Value Creation caused
by the nation’s elite business models as evidenced by aggre-
gated datasets. Generally speaking, indices, in terms of what
14 they measure, lay on a spectrum ranging from established to
emerging concepts. On one hand, indices advance and mea-
sure well established constructs like competitiveness, innova-
tion, multidimensional poverty, the gender gap or prosperity,
and on the other, novel constructs like ease of doing business,
happiness, attractiveness or economic complexity. Elite Qual-
ity is a novel construct and, as such, has necessitated a
weighting method that combines both conceptual and ex-
Visual 9: EQx’s 9 step construction process pert-led approaches.
EQx Concept
Step 1 Step 2
Theoretical Theoretical
grounding and consistent Indi-
framework cator selection
EQx Input
Step 3 Step 4 Step 5 Step 6
Dataset Imputation of Normalization Weighting and
collection and missing data of Indicators aggregation
transformation
EQx Output
Step 7 Step 8 Step 9
Determination Robustness and Results
of Country sensitivity visualization &
Score & publication
Global Rank
Chapter 2 : How Elite Quality Became a Global Index
Electronic copy available at: https://ssrn.com/abstract=3683526Elite Quality is measured at present by 72 EQx Indicators, liberations 2 and 3). For the Power Sub-Index I, the ratio-
each of which is evidence of Value Creation (or its opposite, nale is that Economic Power is supreme, while Political
Value Extraction) in the political economy, at present or poten- Power only reflects potentially extractive processes if it tran-
tially in the future. sitions to the economic arena. For the Value Sub-Index II,
the rationale is the higher significance – in terms of direct
The EQx notion sees Power as a necessary condition for impact on citizens and economic agents – of the economic
Value Extraction and rent seeking. The Power Sub-Index I is over the political in the overall Value Creation processes of
thus the indicator of potential future Value Extraction. There- the political economy.
fore, the relative weighting for the 2 Sub-Indices Power and
Value is conceptual and determined by the authors after One can imagine a matrix with the 2 Sub-Indices intersect-
thorough deliberation: the Power Sub-Index I has a weight ing the 2 Dimensions, thereby yielding 4 quadrants. Each is
of 34% whereas the Value Sub-Index II is weighted at 66%. an EQx Index Area (see Visual 10). Their nomenclature is
Further research will determine the extent to which Power discernible: Political Power (PP), Economic Power (EP), Polit-
leads to future Value Creation/Extraction, and is one of the ical Value (PV) and Economic Value (EV). The conceptual
factors that might lead to the re-calibration of weights. Inci- deliberation weighting 1, 2 and 3 just described extends a
dentally, the Elite Power Sub-Index I can be construed as an specific weight to each Index Area: 11.6% (PP); 22.4%
independent index in its own right. (EP); 22.4% (PV) and 43.6% (EV).
The EQx could have been christened Political Economy Index While the weights of Level 2 elements (the 2 Sub-Indices,
because it measures Power and Value in the political econo- their 2 Dimensions, and the 4 derived Index Areas) are de-
my. Each of EQx’s 2 Sub-Indices contain a Political and an termined by conceptual deliberation, the weights of EQx
Economic Dimension, as discussed earlier. The weights of structure levels 3 and 4 are established by a panel of ex-
these 2 Dimensions within the Power Sub-Index I and the Val- perts employing Budget Allocation Process (BAP) methodol-
ue Sub-Index II respectively are also the result of the concep- ogy. BAP establishes the weighting of Pillars (Level 3) within
tual EQx design and of the authors’ judgement: the weights each of the 4 Index Areas, as well as the weighting of the
for both are established at roughly 1/3 : 2/3 (conceptual de- Indicators (Level 4) within each of the 12 Pillars. 15
Visual 10: EQx weighting overview
Level 1
EQx
Index
Level 2
Power Value
Conceptual Deliberation 1 34% 66%
Sub-Index I Sub-Index II
Political Power Economic Power Political Value Economic Value
Conceptual Deliberation 2, 3 34% 66% 34% 66%
Index Area (i) Index Area (ii) Index Area (iii) Index Area (iv)
Level 3
12 Pillars
Budget Allocation Process
Individual Pillar within Index Area weigths
Level 4
Budget Allocation Process
72 Indicators
Individual Indicators within Pillar weights
Elite Quality Report, EQx2020
Electronic copy available at: https://ssrn.com/abstract=36835262.5 Statistical Assessment Test 1 – Leave-one-out robustness
As the previous steps highlight, the EQx is based on several Test 1 assesses the sensitivity of the Index to the selection of
judgement calls and is the result of a multilevel calculation underlying Indicators and aims at showing the balanced
exercise. This raises the question: how reliable and mean- structure of the EQx. Are all of the 72 Indicators equally im-
ingful is the EQx? portant? Are some redundant, or, on the contrary, dominat-
ing Index scores? To answer these questions, we test the im-
Evidence of the reliability of the Index is obtained by a range pact of each Indicator on EQx Country Scores and Global
of robustness tests, presented and discussed in detail in the Rank, by excluding one Indicator at a time. Visual 12 shows
EQx Methodology Paper and summarized hereinafter. The the effect on EQx Country Scores. The distribution of differ-
tests aim at validating the previously presented judgement ences in EQx Country Scores is illustrated by vertical lines
calls by gauging the sensitivity of the Index to modifications of for each excluded Indicator. A small box and short vertical
its set-up, and, in particular, investigating how sensitive the line close to the zero-difference horizontal red dashed line
EQx Country Rank is, ceteris paribus, to changes in key mod- indicate that the respective Indicator does not significantly
elling assumptions. 5 statistical tests assess the Index’s robust- affect EQx Country Scores. Thus, Visual 12 shows that
ness in different regards, as summarized in Visual 11. while all Indicators contribute somewhat to the final EQx
Scores, most Indicators differ only moderately in their influ-
In summary, the 5 tests performed on EQx2020 data suggest ence. Furthermore, considering the impact on the Global
that EQx Country Scores and the implied Global Rank are not Rank, in almost all cases excluding an Indicator does not
driven by (i) individual Indicators, (ii) data quality or availabil- change the rank of a country at all, or only by one rank (the
ity, and are robust to a range of alternative (iii) normalization visual is presented in the EQx Methodology Paper).
(iv) weighting and (v) aggregation schemes.
16
Visual 11: EQx statistical assessment tests, overview table
Test Nr. Test Name Main Results
EQx has a balanced structure. While all Indicators and
1 Leave-one-out robustness Pillars contribute to final scores, none dominates the
ranking.
Differences in EQx scores between countries are not
2 Sensitivity to data availability significant with respect to the number of Indicators used
for Index calculation.
EQx is stable to changes in the trimming threshold used
3 Sensitivity of the normalization scheme for the normalization of Indicator values (e.g. highly
significant Kendall Tau b correlation coefficient of 0.95,
when comparing EQx ranking to a ranking using no
trimming during the normalization).
EQx ranking is largely robust to slight and even far-rea-
4 Robustness to the weighting scheme ching modifications in the weighting scheme (e.g. highly
significant Kendall Tau b correlation coefficient of 0.77,
when comparing EQx ranking to a ranking using equal
weighting at every aggregation level).
EQx ranking is largely robust to modifications in the ag-
5 Robustness to the aggregation scheme gregation scheme (e.g. highly significant Kendall Tau b
correlation coefficient of at least 0.96, when comparing
the EQx ranking to a ranking using geometric aggrega-
tion at one of the aggregation levels).
Chapter 2 : How Elite Quality Became a Global Index
Electronic copy available at: https://ssrn.com/abstract=3683526Visual 12: Test 1, on Indicators: Deviation from baseline scores, excluding one Indicator at a time
Deviation from the Baseline Score Note: Boxes represent 50% of all countries; the horizontal line within a box indicates the median
EQx Indicators
To assess whether EQx has a balanced conceptual structure, lars. The median deviation from the baseline EQx Global
we re-run Test 1 but this time by examining the effect of omit- Rank is zero in almost all cases. Omitting one of the Pillars 1,
ting one Pillar at a time on the Global Rank. Visual 13 shows 2, 3, 5 or 9 does not affect the Global Rank position for near-
the subsequent distribution of the differences in the Global ly all countries.
Rank, which is illustrated by the vertical lines for each exclud-
ed Pillar. Pillar 12 (Labour Rent) is the highest-impact Pillar, Thus, the results suggest that while all Indicators and Pillars
since its omission shifts countries’ Global Rank the most. How- contribute to the EQx, with some having a larger impact than 17
ever, for 50% of countries, omitting one Pillar affects their others, no single Indicator and no single Pillar dominates the
Global Rank by only up to one position for the majority of Pil- final EQx Global Rank.
Visual 13: Test 1, on Pillars: Deviation from baseline ranking when excluding one Pillar at a time
Note: Boxes represent 50% of all countries; the horizontal line within a box indicates the median
Deviation from the Baseline Rank
4
0
-4
i.1 i.2 i.3 ii.4 ii.5 ii.6 iii.7 iii.8 iii.9 iv.10 iv.11 iv.12
State Regulatory Human Industry Firm Creative Giving Taking Unearned Producer Capital Labor
Capture Capture Capture Dom. Dom. Destruction Income Income Income Rent Rent Rent
EQx Pillars
Elite Quality Report, EQx2020
Electronic copy available at: https://ssrn.com/abstract=3683526Test 2 – Sensitivity to data availability Test 3 – Sensitivity of the normalization scheme
Test 2 gauges the meaningfulness of the EQx in terms of the The mean and standard deviation underlying the Indica-
data used, by investigating whether missing data points fol- tors’ standardization are calculated from the 95% trimmed
low a completely random pattern or a systematic pattern datasets. Test 3 evaluated the sensitivity of the EQx to this
(the latter being a problematic indication of bias). In other method, by calculating Index values using several thresh-
words, are Country Scores related to the availability of olds for the computation of means and standard deviations
data? Indeed, countries with more data tend to score higher during the normalization process, and comparing the re-
in the EQx. However, this relationship is not deemed to be sulting ranking to the baseline EQx ranking. The rankings
particularly strong. That is, differences in EQx Country using different trimming thresholds are highly correlated
Scores are not significant with respect to the number of Indi- with the baseline ranking. For instance, when applying no
cators. Furthermore, provided the considered Indicators are trimming at all, the resulting ranking is still highly and sig-
unbiased, the state of Elite Quality is depicted using less, nificantly correlated with the baseline ranking, with a Ken-
but nevertheless correct information. In view of the high-qual- dall Tau-b correlation coefficient of 0.95 (Spearman cor-
ity data constituting the EQx, we thus do not expect EQx relation coefficient: 0.99).
scores to be biased in terms of data availability.
18
Chapter 2 : How Elite Quality Became a Global Index
Electronic copy available at: https://ssrn.com/abstract=3683526You can also read