Benchmarks 2021 Report - Franklin Egan Sarah Bay Nawa - Pasa ...
←
→
Page content transcription
If your browser does not render page correctly, please read the page content below
Soil Health
Benchmarks
   2021 Report
      Franklin Egan
     Sarah Bay Nawa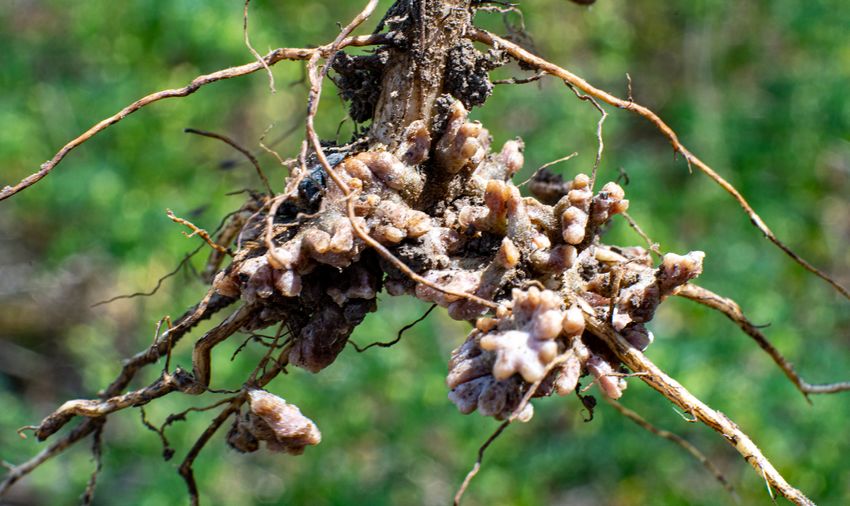
Soil Health Benchmark Study Partners

Soil Health Benchmark                                   Report Contributors
Study Contributors                                      Authors: Franklin Egan; Sarah Bay Nawa
Thank you to the 106 farmers who have invested their    Reviewers: Bob Schindelbeck and Joseph Amsili
time and expertise into this project.                   (Cornell University’s Soil Health Laboratory); Hannah
                                                        Smith-Brubaker (Pasa Sustainable Agriculture); Kristy
Study design and data analysis support: Charlie White
                                                        Borreli (Penn State Extension)
and John Spargo (Penn State Extension); Drew Smith
and Yichao Rui (Rodale Institute); Lamonte Garber and   Editor: Melissa Cipollone
Lisa Blazure (Stroud Water Research Center)
                                                        Proofreader: Marie Hathaway
Farmer recruitment and field support: Dan Dalton;
Aaron de Long; Helen Kollar-McArthur; Lisa Garfield     Layout: Halston Maierle (H6 Design)
(Future Harvest)
                                                        Cover photo: Cheryl Burns (Capital RC&D)
The Soil Health Benchmark Study was initially made
possible thanks to generous financial investments
from Lady Moon Farms, the Jerry Brunetti family, the
Shon Seeley family, and more than 120 private donors
committed to supporting farmers’ efforts to build and
preserve soil health.

Additional financial support has been provided by the
William Penn Foundation, the Hillman Foundation,
the Pennsylvania Department of Agriculture, and the
USDA Conservation Innovation Grants program.
CONTENTS

Executive summary..................................................................................... 4
Introduction................................................................................................ 6
           What is soil health?......................................................................... 8
           Empowering farmers with data & community................................. 9
Participating farms.................................................................................... 11
           Recruitment.................................................................................. 11
           Location........................................................................................ 11
           Cohorts......................................................................................... 12
Methods................................................................................................... 14
Soil health benchmarks............................................................................. 17
           Physical benchmarks..................................................................... 17
           Biological benchmarks.................................................................. 17
           Chemical benchmarks................................................................... 21
           Overall soil health score benchmarks........................................... 24
           Management benchmarks............................................................ 24
Soil health insights.................................................................................... 28
           Tough weather is tough on soil..................................................... 28
           Tillage can be part of a holistic soil health system........................ 31
           Better-calibrated fertilizer inputs will
           improve soil health & water quality............................................... 34
           Headed in the right direction?...................................................... 37
Marketing healthy soils............................................................................. 40
Peer-to-peer learning networks................................................................ 42
Conclusion................................................................................................ 44
References................................................................................................ 45
EXECUTIVE SUMMARY

                 B
                         uilding and preserving soil health is a fundamental component
                         of a secure food system that effectively protects ecosystems and
                         communities. The Soil Health Benchmark Study is designed to
                  help farmers monitor and evaluate the nuanced soil health strengths and
                  challenges that can exist simultaneously within their fields. The study
                  was developed and is administered by Pasa Sustainable Agriculture in
                  collaboration with farmers and partners including the Cornell Soil Health
                  Laboratory, Future Harvest and the Million Acre Challenge, Penn State
                  Extension, Rodale Institute, and Stroud Water Research Center. Our
                  project is one of the largest and most diverse community soil health
                  research projects in the nation, amassing data from a wide range of farm
                  scales and management systems, soil types, and farmer experiences.

                  Since we initiated the study in 2016, we’ve worked alongside more than
                  100 farmers to collect soil samples and field management records from
                  their pastured livestock, row crop, and vegetable farms in Pennsylvania
                  and Maryland. We compile the collective results of soil tests—ana-
                  lyzed by Cornell University’s Soil Health Laboratory—and field records
                  to develop annual, custom soil health benchmark reports for each of
                  the farms participating in the study. These benchmarks offer insights
                  into common soil health issues in our region, as well as challenges that
                  are unique to individual farms. Equipped with their custom benchmark
                  reports, farmers can improve their soil health management strategies
                  and connect with a supportive learning community of their peers.

                  This report shares both the latest soil health benchmarks we’ve com-
                  piled from the 2019 season, as well as observations in soil health trends
                  over time from farms who have participated in the study over multiple
                  years. It includes benchmarks for 10 soil health indicators, and three
                  farm management benchmarks. It additionally includes our analysis of
                  significant trends in the data we’ve collected. Our findings include:

4   Pasa Sustainable Agriculture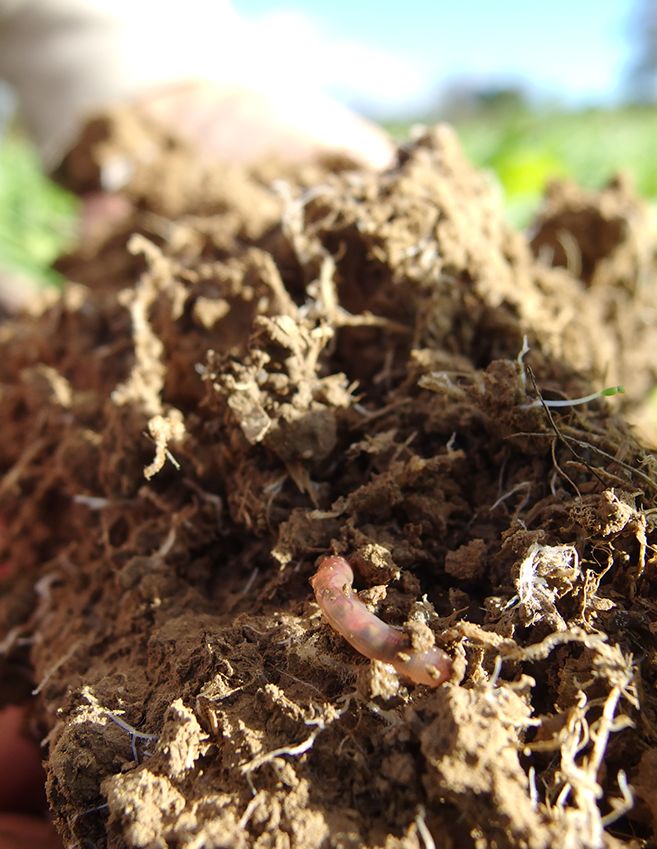
•   Perennial pastured livestock farms are the “gold standard”
     for soil health, achieving optimal scores for every soil health
     indicator we measured on nearly all fields we measured. Most
     annual row crop and vegetable farms have excellent or optimal soil
     health in many respects, but often show challenges with low aggre-
     gate stability—a key measure of a soil’s structure and resistance
     to erosion—and high phosphorus, a critical plant nutrient that can
     become an environmental pollutant when applied excessively.

 •   Climate change in Pennsylvania, Maryland, and throughout
     the Northeast region will bring new challenges for soil stew-
     ardship. In 2018, following historic rainfall totals—most of it
     arriving in extreme doses—we observed a 60% and 54% drop
     in aggregate stability on row crop and vegetable farms, respec-
     tively, in the region. While most of these farms were able to par-
     tially or substantially rebuild their aggregate stability in 2019,
     which brought more amenable weather and field working con-
     ditions, it’s likely that extreme rainfall events and consistently
     wet seasons will become more common in the future, creating
     ongoing challenges for maintaining healthy soil structure.

 •   Many farms that rely on tillage for controlling weeds and pre-
     paring fields are still able to achieve optimal soil health by bal-
     ancing tillage with a holistic soil health management strategy.
     Many farmers and agricultural professionals believe that no-till
     farming techniques are essential for building and preserving soil
     health in annual crop rotations. While we found that most no-till
     row crop farms do in fact have optimal soil health, we also found
     many examples of optimal soil health on organic row crop and
     vegetable farms that till intensively, including some farms with low
     annual inputs of mulches, composts, and manures. Planting cover
     crops, allowing full-season fallows, and carefully timing tillage are
     likely key to balancing tillage and soil health, but we need more
     data to evaluate these techniques in the context of our study.

Farmer collaborators report drawing substantial value from our
study: 92% return to submit soil samples and fields records for mul-
tiple years. Additionally, a variety of farmers and technical service
providers located in areas outside of Pennsylvania and Maryland
have expressed interest in helping to grow and further diversify the
study. We expect this report to be the first of a series of soil health
benchmark reports that we will publish regularly to help farmers,
technical service providers, scientists, policymakers, and commu-
nities better understand soil health and how best to protect it.

                                                                          Soil Health Benchmarks   5
Nitrogen nodules on roots

                  INTRODUCTION

                 S
                        oil is the foundation of sustainability on any farm. It is also at the
                        center of many of our most pressing social and environmental
                        problems. With healthy soils, farmers can grow an abundant and
                  nutritious food supply, strengthen local economies, protect clean water,
                  nurture diverse ecosystems, and help control climate change. But without
                  actively working to build and preserve soil health, farmers can become
                  locked in a costly downward spiral of increasing chemical inputs, losing
                  their most fertile topsoil to erosion, and degrading vital natural resources.

                  The state of our nation’s soils has increasingly become a top priority for
                  farmer associations, multinational corporations, and government agen-
                  cies alike. Grassroots farmers’ organizations like the Pennsylvania No-Till
                  Alliance, Practical Farmers of Iowa, and the National Corn Growers’
                  Association are providing soil health education and technical assistance
                  to farmers across the country. Major food manufacturers like General Mills
                  and Dannon are seeking to bolster the sustainability of their brands and
                  supply chains by investing in their vendor farms’ soil health. And with the
                  establishment of its Soil Health Division in 2012, soil health research and
                  technical assistance has also become a top directive for the USDA Natural
                  Resource Conservation Service.

6   Pasa Sustainable Agriculture
Preserving and improving soil health has catalyzed into a global move-
ment in response to a pattern of troubling trends. Scientists estimate
that U.S. soils have lost 30–60% of the organic matter they contained
before farmers cleared vast swaths of native forests and grasslands for
food production1,2—and the rate of soil depletion continues to far out-
pace recovery. Connections between land stewardship and water quality
have also drawn wider attention: Agricultural runoff is one of the top
sources of water pollution and contamination across the U.S.3 And as
climate change continues to accelerate, soils are increasingly damaged by
floods, droughts, and severe storms. Ultimately, it has become eminently
clear that public health, ecosystem health, and the security of our local,
regional, and national food systems are inextricably linked to the state of
our soils.

      “The state of our nation’s soils
      has increasingly become a top
      priority for farmers associations,
      multinational corporations, and
      government agencies alike.”

As an organization that directly engages with thousands of farmers
in Pennsylvania and surrounding states each year, Pasa Sustainable
Agriculture initiated the Soil Health Benchmark Study in 2016. The ongo-
ing study aims to offer farmers, scientists, communities, policymakers, and
other stakeholders valuable soil health insights from a growing network
of more than 100 working farms. Our study participants include pastured
livestock farms, diversified vegetable farms, and grain and row crop
farms that operate at various scales and employ a variety of management
systems. As the most diverse soil health community science project in the
nation, our Soil Health Benchmark Study lets us synthesize data and share
insights among a wide range of production systems. The study contrib-
utes to the soil health movement by providing new ways to measure,
compare, and promote soil health on farms everywhere.

                                                                    Soil Health Benchmarks   7
What is soil health?
                  Understanding soil health extends beyond any technical definition—it’s
                  a mindset. We must learn to see soil not only as a medium for delivering
                  nutrients to crops, but as a living, breathing, highly complex ecosystem.
                  As a living system, soil can thrive or deteriorate depending on how it’s
                  cared for. While many aspects of soil health remain a frontier of research
                  and discovery, scientists and farmers broadly agree about how we can
                  assess whether soil ecosystems are functioning well or poorly, or some-
                  where in between.

                  Measuring soil health requires evaluating three types of overarching
                  characteristics:4

                    •    Physical: Healthy soils have a stable physical structure that resists
                         erosion and supports root growth.

                    •    Biological: Healthy soils have an ample stock of organic matter that
                         feeds a diversity of invertebrates and microorganisms, working to
                         cycle nutrients for plant growth and regulate pathogens and harmful
                         microbes.

                    •    Chemical: Finally, healthy soils provide a balanced supply of essen-
                         tial plant nutrients and maintain pH levels optimal for plant growth
                         and microbial life.

                          “We must learn to see soil not only
                          as a medium for delivering nutrients
                          to crops, but as a living, breathing,
                          highly complex ecosystem.”

                  For decades, soil health testing labs primarily focused on measuring a
                  soil’s chemical attributes—levels of acidity; nitrogen, phosphorus, and
                  potassium; and micronutrients. While this provided farmers with some
                  basic information about soil fertility, such a narrow scope of analysis
                  offered farmers a highly limited, and often misleading, understanding of
                  a soil’s true health. Critically, this approach does not take into account a
                  wealth of other attributes, such as whether a soil is resistant to erosion,
                  or to what extent beneficial microorganisms are present. In contrast, our
                  study employs a holistic approach to soil testing: We measure not only a
                  soil’s chemical health, but also its physical and biological health.

8   Pasa Sustainable Agriculture
Just as there is growing consensus about the importance of soil health
and how we can measure it, there is also emerging agreement among
farmers and scientists about the practical steps that we can take to
improve soil according to this holistic framework. Farmer experience and
scientific research has shown that we can grow healthy soils by 1) minimiz-
ing soil disturbance; 2) maximizing soil cover and living roots; 3) increas-
ing biological diversity, 4) integrating crops and livestock; and 5) reducing
external nutrient and fertility inputs.4,5

Empowering farmers with
data & community
Farmers are shouldering an enormous responsibility to grow a more sus-
tainable future. As the primary stewards of roughly 20% of the land area
in Pennsylvania and more than 55% nationally,14 farmers well understand
the importance of soil health to a sustainable future. Most farmers have
a deep appreciation for the value of the soil resources they steward, and
many are actively working to implement the core principles of soil health
management. But while the principles of reducing disturbance, maxi-
mizing cover, increasing biodiversity, integrating livestock, and cutting
inputs are easy to understand in concept, it can be difficult to bring them
into practice within the constraints and challenges of a working farm.
To develop a soil health management strategy that’s both effective and
practical, farmers need at least two elements: an accurate assessment
of their farms’ soil health over time, and a supportive network of peers
that they can work with to vet ideas, compare results, and generate new
innovations.

      Farmers steward roughly 20%
      of the land in Pennsylvania,
      and 55% nationally.

Our Soil Health Benchmark Study supports farmers in this process of
data-collection and peer-to-peer learning for continuous improvement.
In this report, we’ll share our community science methods, present soil
health benchmark data collected between 2016 and 2019, and demon-
strate how farmers can work together for meaningful change on their
farms and in their communities.

                                                                      Soil Health Benchmarks   9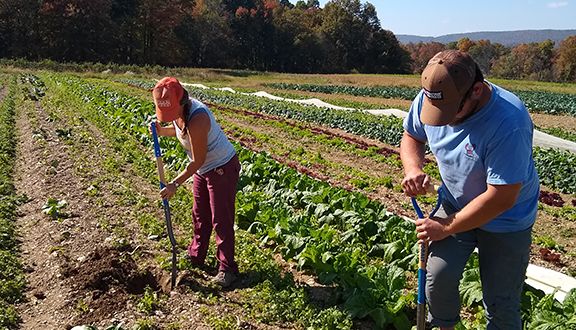
BENEFITS OF HEALTHY SOILS
       •   Better bottom lines. Farmers who                  tillage, or managed grazing can draw
           focus on sustaining and improving soil            carbon dioxide out of the atmosphere
           health can often substantially increase           and sequester it underground as soil
           their net incomes. By providing natural           organic matter. And with diverse crop
           fertility, healthy soils can help farmers         rotations that include legumes, farm-
           substantially cut expenses on fertilizers         ers can feed their crops with home-
           and pesticides.6,7 Increased water infil-         grown nitrogen and cut their depen-
           tration and water holding capacity can            dence on nitrogen fertilizers, which
           also help farmers reduce variation in             require fossil fuels to manufacture and
           yield through droughts and heavy rainfall         release the powerful greenhouse gas
           years, helping to secure more consistent          nitrous oxide as they are processed
           revenues.8,9 The Nature Conservancy               by microbes in the soil. Collectively,
           estimated that soil health improvements           soil health strategies could provide as
           could directly save U.S. farmers $3 billion       much as 16% of the greenhouse gas
           annually in reduced expenses and more             reductions needed to avert the most
           consistent yields on corn acres alone.10          serious climate change scenarios.12

       •   Cleaner water. Healthy soil can turn          •   Resilience to severe weather. Because
           fields and pastures into clean-water              healthy soils act like sponges that can
           powerhouses.11 Today, agricultural                rapidly absorb water during downpours
           runoff is one of the top sources of               and slowly meter it out over dry peri-
           water pollution in the U.S.3 Improving            ods, soil stewardship can help farmers
           soil health to reduce erosion and cut             prepare for the extreme weather asso-
           fertilizer applications could be one of           ciated with climate change. The Union
           the most cost-effective solutions for             of Concerned Scientists has estimated
           improving water quality for hundreds              that soil health improvements on just
           of millions of people nationwide.                 the most highly erodible acres in Iowa
                                                             alone could reduce storm runoff by
       •   Mitigating climate change. Farmland
                                                             9–20% and flood frequency by 13–20%
           soils are a critical component of any
                                                             across the state, saving billions of
           comprehensive plan to address human-
                                                             dollars in crop losses and property
           caused climate change. Soil health
                                                             damage from the most severe floods.13
           practices like cover cropping, reduced

10   Pasa Sustainable Agriculture
PARTICIPATING FARMS
Recruitment
We recruit farmers through an open-enrollment process. We promote the
opportunity to participate in the study through our website, in-person and
virtual events, email list, social media, and word of mouth. Study partner
organizations including Future Harvest and the Million Acre Challenge,
Rodale Institute, and Stroud Water Research Center also recruited farmers
through their networks. As a result of these open recruitment methods,
our project does not reflect a representative sample of agriculture in the
Mid-Atlantic region, and likely includes a bias toward farmers who are
interested in soil health and are already honing their soil-building prac-
tices. Our cohorts also include more small vegetable farms (250 acres) than would be proportional
to Pennsylvania agriculture as a whole.
Although we do not have a
truly representative statistical Figure 1. Map of collaborating
sample, our project is well-de- farms by cohort, 2016–2019
signed to accelerate a more
comprehensive understanding
of soil health among farmers—
including study participants and
farmers at large—and inspire lvania
Pennsy
innovative soil health manage-
ment systems that are both
effective and practical.
Location
land
Mary
Most farms that have or are cur-
rently participating in this study
are located across Pennsylvania.
Future Harvest and the Million
Acre Challenge recruited a
smaller cohort of Maryland
farms in 2019. Participating
farms manage land that spans Vegetable farms
a variety of soil types and Row crop farms
topographies (Figure 1). Pastured livestock farms
Soil Health Benchmarks 11Cohorts
The Soil Health Benchmark Study includes three primary farm cohorts:
pastured livestock, row crop and grain, and diversified vegetable farms.
Beginning with a small pilot cohort of 12 vegetable farms in 2016, we’ve
progressively increased the number and variety of farms each year. At the
time of publishing this report, 106 farms have contributed data to this
study (Table 1).
Table 1. Collaborating farms in each cohort by year, 2016–2019
Year Number of farms
Pastured livestock Row crop Vegetable Total
2016 - - 12 12
2017 - 4 26 30
2018 8 15 36 59
2019 21 26 48 95
Table 2. Study cohort farming systems, 2016–2019
Cohort Farming system Number of farms
Beef cows 9
Dairy cows 10
Pastured livestock Pigs 4
Goats, sheep 5
Poultry 3
Conventional or reduced-tillage 4
Row crop No tillage 16
Certified organic 7
Intensive crop rotations 58
Seasonal cover crops 42
Vegetable
Full-season cover crops 8
Integrated livestock 5
12 Pasa Sustainable AgricultureWithin each cohort, farmers practice a diversity of techniques and man-
agement systems (Table 2). The pastured livestock cohort includes graz-
ing dairies, grass-finished beef farms, goats and sheep, and pastured pig
and poultry operations, as well as several farms that practice multi-species
grazing. The row crop cohort includes continuous no-till farms, farms
practicing reduced or conventional tillage, and certified organic farms
using conventional tillage. Our vegetable cohort includes mostly certified
organic farms, or farms using organic practices but not certified, as well
as four conventional farms that use synthetic pesticides and fertilizers.
Additionally, within each cohort, there is a wide diversity of farm sizes
and farmer experience levels (Figures 2 and 3). This diversity enables a
unique cross-pollination of soil health management ideas and practices.
Figure 2. Study cohorts & farm scales, 2016–2019
100
Percentage of all farms
80
60
500 acres
20
0
Pastured Row Crop Vegetable
Livestock
Figure 3. Farming experience among collaborating farmers,
2016–2019
10-25 years 5-10 years
25 years
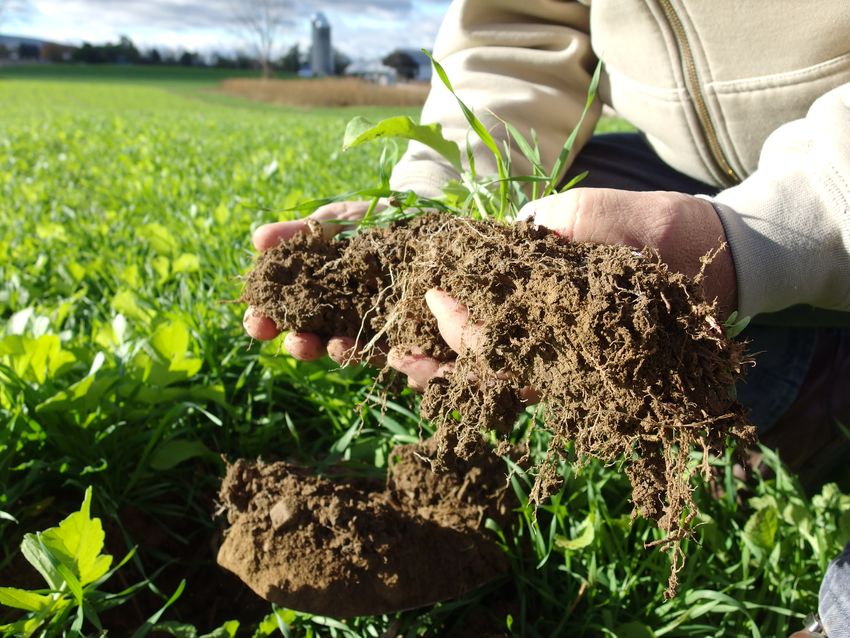
Soil Health Benchmarks 13Farmer study participants take soil samples
METHODS
O
ur Soil Health Benchmark Study collects and analyzes two pri-
mary data sources: 1) field soil samples and 2) farm management
records. We consult with collaborating farmers to choose three
study fields that span typical crop rotation practices on that farm. For
instance, if a farmer practices a six-year crop rotation involving two years
of corn silage, to one year of soybeans, to three years of alfalfa, we
would choose one study field in first year corn, the second study field in
soybean, and the third study field in second-year alfalfa. If a vegetable
farmer practices a three-year vegetable rotation involving fall brassicas in
one year, to tomatoes and peppers in the next year, to a full year of cover
crops, we would choose one field in each of these phases for sampling.
We also choose fields that represent typical soil types and topographic
positions on each farm.
In October and November of each study year, we work with collaborating
farmers to collect soil samples from each study field. For farms participat-
ing in the project for the first time, Pasa staff members visit the farm to
collect soil samples and train the farmer on appropriate sampling tech-
niques. After the first year of study participation, farmers collect their own
samples. Sampling is generally timed to occur after fall harvest and cover
crop seeding operations have concluded.
14 Pasa Sustainable AgricultureWe subsample to a depth of six Figure 4.
inches (15 centimeters) from five Cornell Comprehensive
locations in each study field, Assessment of Soil Health
homogenize the samples, and rating scale & rating classes
submit them to the Cornell Soil
Health Laboratory. Cornell runs
a battery of tests, evaluating 13 OPTIMAL
different physical, biological, (80-100)
and chemical indicators of soil
EXCELLENT
health. For each indicator, Cornell
(60-80)
returns both the original measured
values and a rating, normalized AVERAGE
on a bell curve to a 0–100 scale (40-60)
(Figure 4). Samples from differ-
ent soil texture classes are rated LOW
on distinct normal curves, which (20-40)
allows us to make comparisons
CONSTRAINED
across soils that may have dif-
(0-20)
ferent inherent soil properties.
Throughout the project year, collaborating farmers maintain logs of farm
operations in the selected fields, using either template spreadsheets pro-
vided by Pasa, farmOS software, or paper notebooks. Records include: 1)
tillage, cultivation, and any farm operations involving soil disturbance or
compaction; 2) planting and termination dates for crops and cover crops,
3) application dates and quantities for all fertilizers and soil amendments,
and 4) animal movements and stocking densities for pastured livestock.
We organize these data and generate three additional indicators that pro-
vide a snapshot into some of the management practices that most influ-
ence soil health: 1) days of living cover, 2) tillage intensity, and 3) organic
inputs.
We collate the Cornell soil health test data and our management indi-
cators into detailed, custom benchmark reports for each collaborating
farmer. These reports serve as a reference point for conversations and
events where farmers can share and refine their soil health strategies.
We developed our methods with input from participating farmers and
scientists at Penn State University, Cornell University, Rodale Institute,
and Stroud Water Research Center.
For more details about our methods, please see our Methods Guide
for Research Collaborators.15
Soil Health Benchmarks 15Credit: Cheryl Burns, Capital RC&D
SOIL HEALTH
                     BENCHMARKS

                     T
                            his section outlines the soil health benchmarks achieved by the
                            21 pastured livestock, 26 row crop, and 48 vegetable farms in
                            Pennsylvania and Maryland that participated in our Soil Health
                     Benchmark Study in 2019. Our benchmarks are divided into five catego-
                     ries: physical benchmarks, biological benchmarks, chemical benchmarks,
                     overall soil health score benchmarks, and management benchmarks.

                     The 0–100 ratings throughout this section are color coded according to
                     Cornell University’s Comprehensive Assessment of Soil Health’s rating
                     scale and rating classes (see Figure 4 in Methods). A rating between 0–20
                     is constrained; 20–40 is low; 40–60 is average; 60–80 is excellent; and
                     80–100 is optimal.

                     Soil samples are grouped according to texture classes (coarse, medium,
                     and fine), and rated against a bell curve for all samples in Cornell’s data-
                     base for that texture class. The reference manual for the Comprehensive
                     Assessment of Soil Health provides a detailed review of the relationships
                     between measurements and ratings for each indicator.4

                     Physical benchmarks
                     We measured two indicators of a soil’s physical health using Cornell
                     University’s Comprehensive Assessment of Soil Health: available water
                     capacity and aggregate stability.

                     Table 3. Available water capacity measurements & ratings
                     by cohort, 2019

                                Measurements (g/g)                      Ratings (0–100)

                         Min.        Median          Max.       Min.       Median         Max.

Pastured livestock        0.2          0.3           0.3         78           91           99

    Row crop              0.2          0.2           0.3         68           89           98

   Vegetable              0.2          0.3           0.3         74           92           99

                                                                                           Soil Health Benchmarks   17
Available water capacity is a measure of the amount of water accessible
to plant roots relative to the total amount of water the soil can hold under
saturated conditions. It is measured in units of grams of water per grams
of dry soil. Soils with greater available water capacity allow plants to per-
form better under drought conditions.
Across pastured livestock, row crop, and vegetable cohorts, nearly all
farms had “optimal” available water capacity ratings in 2019, with 11
farms rated “excellent.”
Table 4. Aggregate stability measurements & ratings
by cohort, 2019
Measurements (% by mass) Ratings (0–100)
Min. Median Max. Min. Median Max.
Pastured livestock 22 53 66 35 86 97
Row crop 16 35 70 21 56 98
Vegetable 7 27 65 9 42 97
Aggregate stability is a measure of the extent to which soil structure can
withstand wind, rain, and other stressors. Aggregate stability is measured
as the percentage of soil aggregates that hold together through a stan-
dardized rainfall simulation. Good aggregate stability helps promote
germination and root growth.
Unlike ratings for available water capacity, we saw a great degree of varia-
tion among study cohorts’ aggregate stability ratings. Nineteen pastured
livestock farms had “optimal” aggregate stability ratings, with only one of
21 farms rated in the “low” rating group. Many farms in the row crop (14
of 28) and vegetable (36 of 48) cohorts had “average” or “low” ratings,
with vegetable farms generally rating lower than row crop farms.
18 Pasa Sustainable AgricultureBiological benchmarks
We measured four indicators of a soil’s biological health: organic
matter, soil protein, soil respiration, and active carbon.
Table 5. Organic matter measurements & ratings
by cohort, 2019
Measurements (% by mass) Ratings (0–100)
Min. Median Max. Min. Median Max.
Pastured livestock 3.0 4.4 7.2 50 92 100
Row crop 0.9 4.0 6.3 9 83 100
Vegetable 1.8 3.9 8.2 15 87 100
Organic matter is measured as the percent of total soil mass that contains
carbon compounds derived from living or once-living biomass. Organic
matter is a core measurement of soil health—it’s the foundation of soil life,
contributes to the formation of stable soil aggregates, helps to improve
available water capacity, and provides a slow-release supply of nutrients.
Across all cohorts, most farms showed “optimal” organic matter ratings,
but three of 26 row crop and five of 48 vegetable farms had “low” or
“constrained” ratings for their soil types. Only two pastured livestock
farms had ratings below “excellent.”
Table 6. Soil protein measurements & ratings by cohort, 2019
Measurements (mg/g) Ratings (0–100)
Min. Median Max. Min. Median Max.
Pastured livestock 5.4 7.4 12.1 37 62 94
Row crop 3.8 6.5 16.5 21 50 100
Vegetable 4.0 6.9 23.2 18 53 100
The Soil Protein measures the amount of protein contained in soil organic
matter. Proteins contain a substantial amount of nitrogen. Microbes in the
Soil Health Benchmarks 19soil can break down these proteins and make the nitrogen available to
plants. Soil protein is measured as milligrams protein extracted per gram
of soil.
Across all cohorts, soil protein was one of the lowest rated soil health
indicators. Seven row crop and 13 vegetable farms showed “low” or
“constrained” soil protein ratings. While 12 of 21 pastured livestock farms
rated “excellent” or above, soil protein was still the lowest-rated indicator
on most pastured livestock farms.
Table 7. Soil respiration measurements & ratings
by cohort, 2019
Measurements (mg/g) Ratings (0–100)
Min. Median Max. Min. Median Max.
Pastured livestock 0.4 0.7 1.2 23 66 96
Row crop 0.3 0.7 1.4 16 64 98
Vegetable 0.3 0.6 1.3 17 52 100
Soil respiration measures the abundance and activity of microbial life in
the soil. Soil microbes work to break down plant residues in the soil and
cycle nitrogen and other nutrients from organic matter into plant-avail-
able forms. As they break down organic matter, microbes release carbon
dioxide, so microbial activity can be measured by capturing the carbon
dioxide produced by soil microbes over a four-day incubation period in
the lab. Respiration is expressed in units of milligrams of carbon dioxide
per gram of soil.
The soil respiration measurements showed similar patterns as soil protein.
Five row crop and 13 vegetable farms had “low” or “constrained” soil
protein ratings. While 19 pastured livestock farms rated “excellent” or
better, four farms showed “low” respiration ratings.
20 Pasa Sustainable AgricultureTable 8. Active carbon measurements & ratings by cohort, 2019
Measurements (ppm) Ratings (0–100)
Min. Median Max. Min. Median Max.
Pastured livestock 556 743 1,041 62 89 100
Row crop 377 757 1,034 25 88 99
Vegetable 413 715 1,352 32 87 100
Active carbon is a measurement of the small portion of soil organic matter
that can serve as an easily available food source for soil microbes, thus
helping maintain a healthy soil food web. It is measured in parts per
million (ppm). Active carbon is a good leading indicator of biological soil
health, and tends to respond to changes in management earlier than total
organic matter content.
Across all cohorts, most farms showed “optimal” active carbon measure-
ments. Five row crop and nine vegetable farms had “average” or “low”
ratings, while pastured livestock farms consistently showed “excellent” or
“optimal” ratings.
Chemical benchmarks
We measured four indicators of a soil’s chemical health: pH level, phos-
phorus, potassium, and minor elements.
Table 9. pH measurements & ratings by cohort, 2019
Measurements (ph units) Ratings (0–100)
Min. Median Max. Min. Median Max.
Pastured livestock 5.9 6.4 7.0 68 98 100
Row crop 5.7 6.7 7.2 38 99 100
Vegetable 5.6 6.7 7.3 26 100 100
pH is a measurement of how acidic the soil is, which controls how
available nutrients are to crops. If pH is too high, nutrients such as
Soil Health Benchmarks 21phosphorus, iron, manganese, copper, and boron become unavailable to
the crop. If pH is too low, calcium, magnesium, phosphorus, potassium,
and molybdenum become unavailable. The value is presented in stan-
dard pH units, and rated using a hump-shaped curve, with a pH between
6.2–6.8 optimal for most crops.
Across all cohorts, almost all farms showed “optimal” pH ratings. Only
two pastured livestock farms rated “excellent”, while a two row crop and
five vegetable farms had “average” or “low” ratings.
Table 10. Phosphorus measurements & ratings by cohort, 2019
Measurements (ppm) Ratings (0–100)
Min. Median Max. Min. Median Max.
Pastured livestock 3 10 41 15 100 100
Row crop 3 14 247 0 88 100
Vegetable 2 20 251 0 69 100
Phosphorus (P) is an essential plant nutrient and is used by plant cells to
build DNA and regulate metabolic reactions. At high levels, phosphorus
can become a risk to water quality. At very high levels it can interfere with
plant uptake of micronutrients, including iron and zinc. Note that Cornell
scores phosphorus measurements using a hump-shaped curve, such that
both low and high parts per million (ppm) values get ratings towards zero.
Optimal values for phosphorus vary based on the texture and geology of
individual soil types, but ratings above 30 ppm are typically considered
excessive.
Phosphorus ratings were highly divergent. While most farms showed
“excellent” or “optimal” ratings, one pastured livestock farm, five row
crop farms, and eight vegetable farms received “constrained” ratings due
to problems with excessive phosphorus. The vegetable cohort showed
the most number of farms with excessive phosphorus challenges.
22 Pasa Sustainable AgricultureTable 11. Potassium measurements & ratings by cohort, 2019
Measurements (ppm) Ratings (0–100)
Min. Median Max. Min. Median Max.
Pastured livestock 57 130 296 82 100 100
Row crop 51 120 319 75 100 100
Vegetable 49 137 368 71 100 100
Potassium (K) is an essential plant macronutrient that contributes to heat
and cold tolerance and promotes fruit development in horticultural crops.
It is measured in parts per million by mass.
Almost all farms had “optimal” potassium ratings, with just two row crop
and one vegetable farm showing “excellent” levels.
Table 12. Minor element (magnesium, iron, manganese, zinc)
ratings by cohort, 2019
Ratings (0–100)
Min. Median Max.
Pastured livestock 71 100 100
Row crop 56 100 100
Vegetable 85 100 100
Minor elements including magnesium (Mg), iron (Fe), manganese (Mn),
and zinc (Zn) are essential for various plant biochemical reactions but are
only required in small quantities. If any minor elements are deficient, yield
and crop quality will decrease, but toxicities can also occur when concen-
trations are too high. Cornell provides individual measurements in parts
per million for each of these four minor elements, but aggregates all four
into a composite minor element rating.
Almost all farms showed “optimal” minor element ratings, with one pas-
tured livestock farm rated “excellent” and one row crop farm rated “aver-
age”. Among the three cohorts, vegetable farms consistently had the
highest minor element ratings.
Soil Health Benchmarks 23Overall soil health score benchmarks
Table 13. Overall soil health ratings by cohort, 2019
Ratings (0–100)
Min. Median Max.
Pastured livestock 71 86 95
Row crop 55 80 96
Vegetable 57 78 86
Cornell’s overall soil health score is a simple average of the ratings for the
full set of 13 chemical, biological, and physical indicators in the Cornell
Comprehensive Assessment of Soil Health. The overall score can be a
useful general summary, but individual indicators will be more valuable for
identifying specific strengths or management challenges in a given field.
In terms of the Cornell soil health indicators, the pastured livestock farms
clearly set the gold standard: 16 of the 21 pastured livestock farms rated
“optimal” for overall soil health, with the remaining five still achieving an
“excellent” rating. Row crop and vegetable farms had similar profiles,
with most farms rated “optimal” or nearly so, and two row crop and one
vegetable farm scoring in the “average” category.
Management benchmarks
In addition to the Cornell soil health indicator benchmarks, we created
three new management benchmarks that are designed to measure how
well a farm is adhering to key soil health management best practices,
like maximizing living vegetation, reducing soil disturbance, and limiting
off-farm inputs. Instead of lumping our farms into discrete management
systems (e.g. no tillage versus conventional tillage), these benchmarks
allow us to assess each farm along a continuous gradient of soil manage-
ment possibilities.
24 Pasa Sustainable AgricultureTable 14. Days of living cover (days per year) by cohort, 2019
Min. Median Max.
Pastured livestock 298 365 365
Row crop 93 326 360
Vegetable 76 218 350
Living vegetation protects soil from wind and water erosion while also
supplying the soil with fresh organic matter. Linking together annual
crops, cover crops, and perennial pastures and forages to maximize
days of living cover is a fundamental soil-building practice. Our days
of living cover benchmark is the number of days between crop or
cover crop seeding (or transplant) and termination (or winter kill), or
between pasture establishment and renovation. For each field, we
weighted the days of living cover for different crops and cover crops by
the area planted, then summed over all the crops and cover crops.
True to their perennial nature, most of our pastured livestock farms had
living cover all 365 days of the year, or with only a short gap where one
of the study fields may have been used to grow an annual feed crop.
Impressively, many of the no-till row crop farms also achieved year-round
living cover, typically by planting spring cash crops into living winter
cover crops, then terminating the cover crops with herbicides before
the cash crop emerged from the soil—a practice commonly known as
“planting green.” Generally, vegetable farmers had the fewest days of
living cover, either because they left the pathways between vegetable
beds bare during the summer growing season, or because they did not
consistently plant a fall cover crop in fields with late-season cash crops.
Table 15. Tillage intensity index by farm cohort, 2019
Min. Median Max..
Pastured livestock 0 1.6 23.3
Row crop 1.7 8 170.3
Vegetable 1.1 98.7 297.3
Soil Health Benchmarks 25Tillage can degrade soil structure and organic matter, but it can also be a
valuable tool for weed management and incorporating cover crops. The
tillage intensity index uses data from a Natural Resources Conservation
Service (NRCS) soil erosion model to assign a soil-disturbance score to all
management operations that can compact or disturb soil. We weighted
the scores for each machinery operation based on the area covered, then
summed over the season—the higher the score, the more soil distur-
bance. For context, NRCS assigns a single pass with a moldboard plow a
score of 65; a disc harrow a score of 19.5; and a grain drill a score of 2.4.16
Pastured livestock farms showed little to no soil disturbance. Row crop
farms demonstrated a wide range of tillage systems, including con-
tinuous no-till operations; organic and conventional farms with pri-
mary tillage multiple times a year; and organic and conventional farms
that alternate primary tillage some years with perennial forages other
years. Vegetable farms had the highest tillage intensities, although
our data set does include some innovative reduced-tillage systems.
Examples included rotating vegetable fields with perennial grazing
pastures, and transplanting vegetable seedlings into cover crop beds
terminated with herbicides and a single pass with a disc harrow.
Table 16. Organic matter inputs (tons of dry matter per acre)
by farm cohort, 2019
Min. Median Max.
Pastured livestock 0 0 1.8
Row crop 0 0.5 13.3
Vegetable 0 1 75.7
Organic matter inputs including composts, manures, and straw mulches
can stimulate the formation of soil organic matter, add microbiology to
the soil, and supply macro- and micro-nutrients. However, continuous
inputs can also contribute to soil health challenges, such as excessive
phosphorus levels.
Our organic matter input benchmark shows the total organic inputs—
composts, manures, and mulches—farmers apply in each field, measured
in units of tons per acre. We use farmer-supplied analysis or published
data to estimate the percentage of dry matter of each organic matter
input, then standardize all inputs on a dry-matter basis. We only take into
account inputs brought in from outside the study field; we don’t include
26 Pasa Sustainable Agriculturemanure deposited by animals grazing in that field, or biomass generated
by crops and cover crops.
We found that most pastured livestock farms had few off-farm organic
matter inputs, with the exception of some larger dairy farms with winter
manure storage from barns. Most row crop farms also had low amounts
of organic matter inputs, with the exception of a few farms connected to
confined animal operations that provide a cheap and accessible manure
source. Vegetable farms varied tremendously in their use of manures and
composts—some applied these off-farm inputs heavily in each field each
year, and others worked to provide fertility through cover crops or con-
centrated fertilizer sources.
Soil Health Benchmarks 27SOIL HEALTH INSIGHTS
Tough weather is tough on soil
Climate change is already happening in Pennsylvania and neighboring
states, and maintaining soil aggregate stability in the face of new weather
patterns has emerged as a key challenge on many of our collaborat-
ing farms. Total annual precipitation in the northeast United States has
increased over the past half century by about 10%, or five inches per year.
But this gradual change is overshadowed by a much sharper increase:
Incidents of extreme precipitation—defined as more than one inch of rain
during a 24-hour period—have increased 71% since 1950.17
In 2018, farmers in Pennsylvania and much of the Northeast and mid-At-
lantic regions experienced total precipitation 50% above normal, and
many locations experienced dozens of extreme precipitation events.18
Possibly as a result of this historic rainfall, we saw a crash in aggregate
stability on many farms between 2017 and 2018 (Table 17). Aggregate
stability improves water infiltration, helps prevent erosion, and provides a
better substrate in which roots and soil microbes can grow.
Fortunately, aggregate stability is a dynamic soil property. Previous
research suggests that soil aggregates can be repaired through cover
cropping and rotations that put living roots back in the soil.19 After a
year of more typical growing and field conditions in 2019, we observed
a median 64% and 53% rebound of aggregate stability on row crop and
vegetable farms, respectively.
Table 17. Annual precipitation in Pennsylvania & median
aggregate stability ratings by cohort, 2017–2019
Avg. Ratings (0–100)
Year precipitation
(in.) Pastured livestock Row crop Vegetable
2017 46.6 - 89 77
2018 64 81 36 27
2019 50.8 87 57 40
28 Pasa Sustainable AgricultureAs shown in the table above, crashes in aggregate stability occurred
mainly in annual cropping systems; aggregate stability on pastured
livestock farms remained high even after the fall deluges of 2018.
Interestingly, despite achieving nearly year-round crop cover and dras-
tically minimizing soil disturbance compared to vegetable farms, no-till
row crop farms were not spared the 2017–2018 drop in aggregate stabil-
ity (Table 17). During this time, many farmers reported that the difficult
weather conditions often forced them to bring planting, spraying, and
harvesting equipment into wet soils that weren’t ready to be worked, sug-
gesting that even without tillage or cultivation, farmers can still put sub-
stantial stress on soil structure with heavy machinery. In 2019, we found
that row crop farms, including no-till and conventionally tilled farms, both
rebounded their aggregate stability more than vegetable farms (Figure 5).
Figure 5. Relationships between tillage systems, tillage
intensity & aggregate stability ratings, 2018 & 2019
Bars indicate the mean aggregate stability for each tillage system, while the numbers above each bar indicate the
mean tillage index. For context, NRCS assigns a single pass with a moldboard plow a score of 65; a disc harrow a
score of 19.5; and a grain drill a score of 2.4.16
100
100
2
2018 2019
OPTIMAL
OPTIMAL
1
80
80
EXCELLENT
EXCELLENT
Aggregate stability rating
Aggregate stability rating
5 67
60
60
AVERAGE
AVERAGE
24 99
4 142
40
40
POOR
POOR
20
20
CONSTRAINED
CONSTRAINED
0
0
Perennial Row (No-Till) Row (Till) Veg (Till) Perennial Row (No-Till) Row (Till) Veg (Till)
Planting fibrous-rooted cover crops and successfully timing field oper-
ations may be a key strategy for rebuilding soil aggregates after years
with severe weather. In general, the row crop farmers in our study planted
cover crops more consistently than the vegetable farmers (Table 17).
Soil Health Benchmarks 29Wheat cover crop planted and growing in soybean stubble at Woodside Vu Farm
PARTICIPANT CASE STUDY: WOODSIDE VU FARM
For row crop farmers, the window between been exploring earlier-maturing soybeans
harvesting corn silage, soybeans, or corn grain and is considering switching from a later-ma-
and successfully planting a winter cover crop turing soybean. Although they will probably
can be very narrow. At Woodside Vu Farm experience some yield loss with a shorter-sea-
in York County, Pennsylvania, father and son son variety harvested in late September, the
team Joe and Ben Hushon have been planting Hushons feel that having three to four extra
cover crops, including winter rye and barley, weeks of good October weather to plant and
for a decade, but they’ve had a mixed record grow cover crops will more than compensate
of success. The deciding variables often seem the farm with soil health benefits. As they
to be the timing of days where the soil is fit continue to participate in our Soil Health
to handle machinery and the number of mild Benchmark Study, the Hushons can monitor
fall days after cover crops get in the ground. whether their updated cover crop strategy
is effectively defending their soil from drops
Motivated to fine-tune their cover crop strat-
in aggregate stability, and ultimately helping
egy after the big drop in aggregate stability
their farm better withstand severe weather.
they observed on their farm in 2018, Ben has
30 Pasa Sustainable AgricultureTillage can be part of a holistic
soil health system
Discussions around soil health can often become entrenched around pre-
scriptive extremes, with advocates passionately promoting strictly defined
systems and formulaic sets of practices. Contrary to these polarized per-
spectives, our data point to a wide spectrum of management systems that
can build healthy soils.
In many ways, organic matter is the central soil health indicator. Organic
matter influences the formation of stable aggregates; provides long-term,
slow-release soil fertility; and provides food and habitat for beneficial
microorganisms. Viewed through the lens of soil organic matter, our data
show that healthy soils can be achieved with a range of management
systems and tillage practices.
Farmers have traditionally worked soils to control weeds and prepare
seed beds for planting. Tilling and cultivating can severely deplete
soil organic matter by disturbing soil structure and exposing soil to air
(oxygen stimulates microbes to metabolize organic materials). It would
therefore be reasonable to predict that soil disturbance could have a
drastic and unavoidable negative impact on soil health. If this were true,
we would expect a steep and consistent negative relationship between
tillage intensity and organic matter (Figure 6, left panel). Where cases of
heavy tillage co-occurred with healthy organic matter levels on individual
farms, we would expect to see consistent and heavy inputs of organic
matter from outside the farm (e.g. manure, compost, or mulch) to coun-
terbalance the negative effects of soil disturbance.
Our data do not support these predictions. Instead, we found a shallow
and weak correlation between tillage intensity and organic matter (Figure
6, right panel). We also observed nine row crop and vegetable farms that
utilize primary tillage implements, which score greater than 50 on the
Tillage Intensity Index (tillage index >50), yet these farms still achieved
an “optimal” rating for level of organic matter according to Cornell’s
Comprehensive Assessment of Soil Health. Interestingly, many of these
farms apply relatively small quantities of organic matter inputs to their
fields annually, although some farms may have had significant inputs in
years before our study began.
The no-till approach to building soil health is based on the idea that
eliminating nearly all soil disturbance on annual crop farms will result in
a high degree of soil health that could not be achieved with even judi-
cious tillage. Most no-till farmers are able to avoid tillage by relying, to
Soil Health Benchmarks 31some degree, on herbicides to control weeds and terminate cover crops.
While some small farms and farming organizations are experimenting with
organic no-till methods, this approach remains largely elusive to organic
farmers who typically need at least some “steel in the field” to effectively
control weeds. At the same time, because of the escalating prevalence of
herbicide-resistant weeds and the growing public health and environmen-
tal problems associated with herbicide use, continuous no-till may not be
a sustainable soil health management method.20
Our data indicate it’s possible to achieve optimal soil health while still
conservatively tilling and cultivating to control weeds and terminate cover
crops. These findings point to exciting possibilities for blending the best
practices from both no-till and organic systems to help farmers and other
stakeholders make more informed decisions about how to best preserve
soil health while also protecting human and ecosystem health.
Figure 6. Expected & observed relationships between tillage
intensity, organic matter inputs & organic matter rating
by cohort, 2019
The graph on the left shows the expected relationship between tillage intensity, organic matter inputs, and organic
matter rating, while the graph on the right shows the observed results. Each data point reflects the average of a
collaborating farm’s three study fields.
In the graph on the right, the dashed line shows a linear regression model between tillage intensity and organic
matter rating (p=0.01, r2=0.15). For context, the USDA Natural Resources Conservation Service assigns a single pass
with a moldboard plow a Tillage Intensity Index of 65; a disc harrow a score of 19.5; and a grain drill a score of 2.4.
Expected Observed
100
100
OPTIMAL
OPTIMAL
80
80
EXCELLENT
EXCELLENT
Organic matter rating
Organic matter rating
60
60
AVERAGE
AVERAGE
40
40
POOR
POOR
20
20
CONSTRAINED
CONSTRAINED
0
0
0 50 100 150 200 250 300 0 50 100 150 200 250 300
Tillage intensity index Tillage intensity index
Organic matter inputs
Farm type
Pastured livestock Row crop Vegetable 8 tons per acre
32 Pasa Sustainable AgricultureCovers protect Spiral Path’s windrows of homemade compost until it is spread in the field (Credit: Spiral Path Farm)
PARTICIPANT CASE STUDY: SPIRAL PATH FARM
At Spiral Path Farm—an organic vegetable The Brownbacks also implement a detailed
farm in Perry County, Pennsylvania—the crop rotation that includes alternating uses
Brownback family have grown their soil of winter-kill and overwinter cover crops—in
organic matter levels to 5% on soil types 2019, they were near the top-of-the curve with
that typically show only 2% organic matter, 301 days of living cover, while the median
despite many years of annual passes with a value on vegetable farms in our study was
disc harrow and occasional use of a mold- only 218 days. Among other benefits, the
board plow (their average Tillage Intensity diverse cover crop schedules help them avoid
Index score is 165, while the median value field work bottlenecks that might bind them
for vegetable farms in our study was 98.7). into bringing heavy equipment into fields
They feel they have achieved this feat through that aren’t ready to be worked. They recently
an advanced on-farm composting system began phasing out the disc and moldboard
that stimulates soil microbial life and helps plow, and instead terminating cover crops
provide crops with optimal nutrition. The with one or two passes of a spader machine.
Brownbacks apply compost at moderate rates Perhaps especially for organic farmers, obser-
(0.9–2.3 tons dry matter per acre; the median vations from Spiral Path Farm and similar
value on vegetable farms in our study was farms in our study indicate that farmers can
1.0) that provide some fertility and stimulate integrate a range of techniques to sustain soil
microbes without major inputs of organic health to counteract the impact of tillage.
matter. Vigorously growing crops and cover
crops then return carbon and organic matter
to the soil, helping build soil health in return.Better-calibrated fertilizer inputs will
improve soil health & water quality
Many vegetable farms and some row crop farms in our study struggle
with excessive phosphorus levels (Table 18). Through runoff and erosion,
excessive phosphorus can leak from fields and pollute streams and estu-
aries by causing blooms of algae that exhaust oxygen from the water and
kill other life forms. At the global scale, phosphorus is a nonrenewable
resource, mined from a limited number of deposits across the globe, then
shipped to crop farms.21 Once phosphorus is lost to rivers and diluted in
the vast ocean, it won’t be available again to future generations.
For vegetable farmers, excessive phosphorus can also significantly
weaken crop vigor. At parts per million levels in the hundreds, depending
on soil type and crop, phosphorus can inhibit a plant’s uptake of iron and
zinc.22 Deficiencies in these micronutrients can impede crop growth and
increase susceptibility to pests. In most cases in our study, high phospho-
rus levels could be attributed to heavy manure or compost applications.
For farms relying on manure or compost as a nitrogen source, phosphorus
is typically supplied in excess of crop needs.
“Phosphorus is a nonrenewable
resource ... Once [it] is lost to rivers
and and diluted in the vast ocean,
it won’t be available again to future
generations.”
For vegetable and row crop farms in our study, the distribution of phos-
phorus ratings according to Cornell’s Comprehensive Assessment of Soil
Health tended to be polarized (Table 18). Most farms had either devel-
oped a fertility program that successfully balanced phosphorus inputs
with other crop nutrient needs, or they were dealing with a major, long-
term excessive phosphorus challenge; relatively few farms fell between
these poles. To prevent or correct excessive phosphorus in soil, farmers
can develop a balanced fertility plan by reviewing the specific nutrient
needs of their crops, the chemical composition of the amendments and
fertilizers they use, and the existing levels of phosphorus and other nutri-
ents in their soil.
34 Pasa Sustainable AgricultureYou can also read