BETTER BALANCE - Knowledge Auckland
←
→
Page content transcription
If your browser does not render page correctly, please read the page content below
FINDING A
             BETTER
              BALANCE
The role of migrant NOVEMBER 2017
     workers in the
  aged-care sector
This paper has been prepared jointly by St Andrew’s Village and The Salvation Army’s Social Policy and
Parliamentary Unit. We would like to thank those organisations and individuals who took part in this
research. In particular we would like to thank members of the St Heliers Presbyterian Church community
who initiated this project out of a concern for social justice. We welcome any comment or feedback.

The Salvation Army Social Policy                St Andrew’s Village
& Parliamentary Unit                            PO Box 18376,
PO Box 76249,                                   Glen Innes,
Manukau,                                        Auckland 1743
Auckland 2241                                   ph: (09) 585 4020
ph: (09) 262 2332                               fax: (09) 575 3216
social_policy@nzf.salvationarmy.org             quality@standrewsvillage.co.nz
facebook.com/SPPUNZ                             https://www.facebook.com/standrewsvillagenz
twitter.com/SPPU

2 FINDING A BETTER BALANCE November 2017
TABLE of C0NTENTS

  INTRODUCTION                                                             4

1 AN OVERVIEW OF THE RESIDENTIAL AGED-CARE SECTOR                          5

2 FUTURE DEMAND FOR AGED CARE                                              8

3 FUTURE DEMAND FOR LABOUR IN THE AGED-CARE SECTOR                         11

4 FUTURE OUTLOOK FOR NEW ZEALAND’S LABOUR MARKET                           13

5 MIGRANT EMPLOYMENT IN THE AGED-CARE SECTOR                               16

6 IMPACT OF RECENT IMMIGRATION POLICY CHANGES                              18

7 PERSONAL STORIES OF MIGRANT WORKERS                                      20

8 CONCLUSIONS AND RECOMMENDATIONS                                          22

  REFERENCES                                                               23

                                         FINDING A BETTER BALANCE November 2017 3
INTRODUCTION New Zealand’s aging population—and in particular the retirement of the Baby Boomer generation—poses a number of challenges. Three important ones are around the future labour force, the growing need for aged care, and the required taxation to fund this care. These problems are, of course, inter-related in that the working-age population that makes up the majority of the workforce will need to both provide the labour and taxes to care for the elderly. Current population projections suggest that over the next 20 years the working age population will grow only slowly, if at all. There does not appear to have been a great deal of thought given to the immediate and future implications of these challenges. There is certainly no short-term or even medium-term plan for the provision of aged-care services despite the fact that future demand for such care can be easily forecast. Given this lack of overall planning for aged-care services insufficient provision has been made for future workforce requirements to provide this care. This lack of interest in the future requirements for aged care and the people who provide this care is already having an impact on service provision around the commercial viability of aged care providers and the difficulties they are having in recruiting staff. This is visible in the recent closure of more than 15 small residential aged-care facilities and ongoing problems remaining providers are having in recruiting New Zealand citizens and residents to positions, especially as healthcare assistants. This latter point—recruitment of citizens and residents as health care assistants—has driven the need to employ temporary migrants in their thousands into these positions. A recent survey of five major residential aged-care providers in Auckland found that more than one-quarter of their healthcare assistants were working on temporary so-called ‘Essential Skills’ migrant visas. There are at least three difficulties with this arrangement. Firstly, it is not fair on the workers involved, mainly because they remain in New Zealand on a sequence of short-term visas but are never able to settle here and feel as though they belong. This is often despite the fact that they have made an economic and social contribution to New Zealand life, sometimes for more than a decade. Secondly, this arrangement is not entirely fair to the residents and patients cared for by these migrant workers. In general, the standard of care offered by these workers and the facilities in which they work in is excellent. However, the ongoing standard of care is under threat if the emerging shortage for skilled healthcare assistants is not addressed. This leads to a third difficulty: these skills and labour shortages are about to be exacerbated by recent changes in immigration policy. This paper is offered by St Andrew’s Retirement Village and The Salvation Army’s Social Policy and Parliamentary Unit to highlight these difficulties and suggest changes that we believe will be more than just for the migrant workers concerned and also provide a sounder basis for providing residential aged-care services. These changes are recommended to an immediate audience of central government politicians and their policy advisers. A secondary, but by no means second- thought audience is the New Zealand public, many of whom we believe are concerned about the injustices within our current migration policies as well as the current unmet challenges around aged-care services. 4 FINDING A BETTER BALANCE November 2017
1 AN OVERVIEW OF THE RESIDENTIAL AGED-CARE SECTOR
In New Zealand, older people are cared for and housed in a number of ways. These can be placed
along a continuum from supported living in a private home to secure care in a hospital dementia
unit. This continuum is offered in graphical form in Figure 1 below.

Figure 1: Aged-care and Accommodation Continuum

                                                     REST HOME          HOSPITAL          SECURE
   PRIVATE        RETIREMENT         ASSISTED
                                                       LEVEL             LEVEL           DEMENTIA
   HOUSING         VILLAGES           LIVING
                                                      OF CARE           OF CARE            CARE

            EXTRA-MURAL CARE                               RESIDENTIALLY-BASED CARE

                              Increasing levels of care required

This paper considers the impact of migration policy on the labour force employed in the
residentially-based care part of this continuum.

The earlier part of the continuum relates to those who rely on some level of extra-mural care.
Of course, this part of the continuum requires people to provide care. In addition, significant
numbers of people are employed in retirement villages to take care of the grounds and
facilities, and other staff who may offer personal and household services to residents. Many
of the difficulties experienced by the residential aged-care sector in recruiting and retaining
suitable staff will also be felt by those in this earlier end of the aged-care continuum. This inter-
relationship is probably more pronounced now with the pay equity agreement recently provided
to aged-care workers. For example, it seems likely the higher wages offered to residential aged-
care and home-care workers through this agreement will lead to calls for relativity with other
similar occupations. There may, on any account, be a shift in people out of these comparable
sectors into aged-care and home-care work on account of these higher wages.

This inter-relationship is simply noted here, as is the likelihood that the difficulties the aged
care sector is experiencing around recruiting and retaining staff are also likely to be felt in the
home-care and retirement-village sectors as well.

The residential aged-care sector comprises 672 certified rest homes and other aged-care facilities
providing around 39,300 beds.1 The body representing this sector, the New Zealand Aged Care
Association (NZACA) reported that in June 2017, amongst its members, there were 668 separate
facilities offering 38,700 beds to almost 33,700 residents. Data from NZACA’s Quarterly Bed
Survey for June 2017 is provided in Table 1.

As shown in Table 1 the residential-care sector is complex and does not just serve older people
in need of high levels of care. The sector also caters for younger people with disabilities (YPD)
and private paying as well as publicly subsidised residents. For people aged over 65, care is
offered at a number of levels: rest home, hospital, dementia and psychogeriatric.

                                                           FINDING A BETTER BALANCE November 2017 5
Table 1: Summary of capacity and use of aged-care facilities—June 2017 2
Number of Care Facilities
Type of bed offered Beds Residents Occupancy
Providing
Dedicated Rest Home Beds 441 11,088 9,982 90.0%
Dedicated Hospital Beds 253 8,299 7,416 89.4%
Dual Service Beds 344 10,812 9,507 87.9%
ORA Rest Home Only 90 1,894 1,251 66.1%
ORA Hospital Only 5 66 52 78.8%
ORA Dual Service Beds 40 738 510 69.1%
Dementia Beds 207 4,587 3,930 85.7%
Psychogeriatric Beds 35 948 851 89.8%
Dedicated YPD Beds 18 63 40 63.5%
Other Beds 43 202 133 65.8%
Total 668 38,697 33,672 87.0%
Figure 2 reports the number of beds available in residential care facilities and the number
of residents filling these beds over the past four years. This graph shows two notable things.
The first is the slow but consistent growth in the supply and occupancy of care facility beds—
over the four years an overall growth of just over 6%. The second feature is the consistent
underutilisation of the available capacity. Facility utilisation has consistent stayed at around
87% to 89%.
Figure 2: Supply and occupancy of residential care facilities—2013 to 2017 3
45,000
40,000
35,000
30,000
25,000
20,000
15,000
10,000
5,000
0
Sep–13 Mar–14 Sep–14 Mar–15 Sep–15 Mar–16 Sep–16 Mar–17
Total beds Total residents
The reason for this underutilisation is puzzling, at least on the face of it. Most residents of
residential aged-care facilities are publicly subsidised, meaning their access is determined by
a clinical assessment process. This process is administered by District Health Boards (DHBs),
which are funded on a bulk-grant basis by Government to provide these services. The fairness
of such a process, where in effect the funder of an essential service directly determines access,
is questionable given the competing objectives at play and the absence of a transparent process.
In addition, most providers of residential aged-care facilities are privately owned businesses
operating on a for-profit or not-for-profit basis. Underutilisation of their facilities—in effect
6 FINDING A BETTER BALANCE November 2017by their funders, who determine access, will undermine profitability and viability and so limit
further investment in new facilities. This appears not to have been the case over the past four
years as capacity has grown alongside occupancy while the level of underutilisation has remained
fairly constant.
There is some ambiguity over the total cost to taxpayers of residential aged-care facilities, adding
to the lack of transparency attached to this area of aged care. Residential aged-care is funded
in three ways: though fee-for-service contracts between the facility provider and local DHBs;
through the abatement of residents’ New Zealand Superannuation payments; and through a full
or part contribution by the residents themselves. The problem is these funding streams are not
reported publicly, so it is difficult to know both what the true costs of residential aged care are to
taxpayers and residents and how these are changing over time.
For example, the Ministry of Health (MoH) reports that in the 2014/15 financial year DHBs
spent almost $1 billion on support services for older people, of which 60% or around $590
million was for residential care. This rose from more than 50% between 2005/06 and 2015/16.4
Yet a 2012 Treasury report claimed that the MoH subsidies for in-patient long-term nursing care
in 2009/10 was $1,277 billion.5 This cost may include the costs of geriatric care within public
hospitals, but it seems unlikely that such care makes up half of the total cost of caring for our
more dependent elderly.
Overall, the lack of clarity around how residential aged care is funded and how access to it is
managed alongside the management of budgets, making it difficult to assess the fairness of
current levels of provision or likely future demand. If New Zealanders are to have an informed
and productive discussion around the future provision of aged-care services this ambiguity
needs first to be addressed.
FINDING A BETTER BALANCE November 2017 72 FUTURE DEMAND FOR AGED CARE
Future demand for aged-care facilities will increase over the next 20 to 30 years as New
Zealand’s population ages and the Baby Boomer generation reaches advanced old age. This
increase has, of course, been expected for some time and some thought has already been given
to its fiscal consequences,6 although with few exceptions little consideration appears to have
been given to the practical ones.
Over the next decade, the population aged over 65 years is expected to grow by 40% to 45%
and from approximately 800,000 people in 2017 to 1.15 million by 2027. Over the same period,
the population aged over 85 years is forecast to grow by more than 50%—from around 85,000
presently to 125,000 to 130,000 by 2027. These trends are illustrated in Figure 3.7
Figure 3: Projections of number of people aged over 65 years—2017 to 2028 8
1,400,000
1,200,000
Number of people
1,000,000
800,000
600,000
400,000
200,000
0
2017 2018 2019 2020 2021 2022 2023 2024 2025 2026 2027 2028
Over 85 years old 65 to 84 year olds
One of the practical ramifications of this fairly rapid increase in the population of older people—
especially those aged over 85 years old—is the demands this group places on the working-age
population to pay taxes and provide services to support them. Meeting this challenge could be
partly resolved through growth in the working-age population and continuous improvements
in labour productivity so that more goods and services can be produced for any given number of
workers. The productivity question is considered below, while Figure 4 provides an estimate of
the share of the population aged over 65 and 85 for the next 20 years.
Over the next 20 years, the over-65s’ share of the population is expected to grow from 15% to
over 22%, while the over-85s’ share will grow from less than 2% to almost 4%. These forecasts
are based on optimistic assumptions around growth in the working-age population, which more
or less align to Statistics New Zealand’s ‘very high migration’ scenario.
Any debate around future migration policy needs to take this demographic challenge into
account, perhaps by considering the impact on New Zealand’s population structure and hence
on our society and economy if we had low or nil migration.
Statistics New Zealand provides a population forecast based on a ‘no-migration’ scenario. As
expected, this scenario suggests slower population growth, with New Zealand’s population
exceeding five million people around 2038 instead of 2023 under more migration-focused scenarios.
The biggest impact, however, is in the working-age population that, without migration, will
gradually decline by 50,000 people between 2018 and 2038 and will be 450,000 fewer people than
under scenarios with more expansive migration policies. Furthermore, under the ‘no-migration’
scenario the over 65-year-olds’ population will reach 25% of the total population within 20 years.
8 FINDING A BETTER BALANCE November 2017Figure 4: Proportion of population aged over 65 years—2017 to 2038 9
25%
Proportion of total population
20%
15%
10%
5%
0%
2017 2019 2021 2023 2025 2027 2029 2031 2033 2035 2037
Over 65s as % of population Over 85s as % of population
The most recent and most authoritative study of future demand for residential aged care is that
undertaken in 2010 by consulting firm Grant Thornton commissioned by DHBs and NZACA.10
The Grant Thornton study used scenario planning to assess the direction and scale of change in
demand for residential aged care through to 2026. The study’s authors adopted two scenarios
that were both based on an assumption that utilisation of rest home beds would initially decline
(as they did for the years prior to the study) and then begin to increase in line with demand
generated by demographic changes. The projections offered by each of these scenarios are
illustrated in Figure 5.
Figure 5: Future demand scenarios for aged residential care 11
1,800,000
Aged residential care bed days per month
1,600,000
1,400,000
1,200,000
1,000,000
800,000
600,000
400,000
200,000
0
2004 2006 2008 2010 2012 2014 2016 2018 2020 2022 2024 2026
Actual Scenario A Scenario B
The study’s Scenario A is the more demanding of the two in that it assumes a smaller initial
fall in rest home bed utilisation/demand and so by 2026 a higher demand for aged-care beds
overall. A noticeable feature of the projections offered in Figure 4 is that 2017 is something of
a milestone or turning point when the full impact of an aging population on future demand is
assumed to kick in. If this is so then it is possible to compare actual levels of provision of beds
as reported in Table 1 with expected changes through to 2026 to gain an impression of possible
increases in demand for the next nine years.
FINDING A BETTER BALANCE November 2017 9Tables 2a and 2b provide a summary of the projections offered by Grant Thornton. If we take a narrower account of the numbers offered here and simply look at suggested changes between 2016 and 2026 –largely between now and the end of the forecast period—we see the anticipated changes are little different between one scenario and the other. In fact, the only difference is the suggested increase in rest-home beds, a difference of little over 500 beds. Table 2a: Estimated demand for beds—Scenario A 12 Facility Type 2008 2011 2016 2021 2026 Change 2016-26 Rest homes 18,119 16,686 18,745 21,270 25,827 7,082 Hospitals 9,821 10,697 12,309 13,889 16,615 4,306 Dementia care 2,559 3,060 4,093 5,211 6,639 2,546 Other 1,770 2,954 2,410 2,776 3,210 800 TOTAL 32,269 32,497 37,557 43,146 52,291 14,734 Table 2b: Estimated demand for beds—Scenario B 13 Facility Type 2008 2011 2016 2021 2026 Change 2016-26 Rest homes 18,119 14,917 11,145 13,366 17,665 6,525 Hospitals 9,821 10,697 12,309 13,889 16,615 4,306 Dementia care 2,559 3,060 4,093 5,211 6,639 2,546 Other 1,770 2,954 2,410 2,776 3,210 800 TOTAL 32,269 30,728 29,957 35,242 44,129 14,172 A comparison of bed numbers reported in Table 1 for mid-2017 and those offered as projections to 2016 in Scenario A show strong similarity. Overall, Scenario A suggests that by 2016 there would need to be 37,557 beds provided in aged-care facilities, while by mid-2017 there were 38,700 available. The mix of bed types is a little different between those reported by NZACA and those offered by Grant Thornton, although much of this difference can be accounted for by so-called dual beds—those that might be used for rest home or hospital care. Perhaps the most notable difference is Grant Thornton’s projection of around 4,100 beds by 2016 and the mid-2017 outcome of 4587 beds—a 6% under-estimation. While this difference is probably not significant, either as a difference or in terms of overall numbers, dementia care beds may be trending ahead of expectations. Such a trend poses significant problems for service configuration and delivery, and a smaller but still notable impact on labour requirements. 10 FINDING A BETTER BALANCE November 2017
3 FUTURE DEMAND FOR LABOUR IN THE AGED-CARE SECTOR
There is no published data on the number of people currently employed in the aged-care sector,
or of the occupational structure of this workforce. Grant Thornton reported that in 2009 over
33,000 people were employed in the residential aged-care sector and that the occupational
structure was as indicated in Table 3.

Table 3: Aged-care sector workforce structure—200914
Number of staff

                  Facility managers       Nurses     Caregivers       Therapists    Non-care      Total
Full-time                533              2,129        6,223             340          1,277      11,402
Part-time                 33              2,576        11,927            977          6,552      22,032
Total                    566              4,705       18,150            1,284        8,729       33,434

A later piece of work by economic consultancy Berl for Careerforce, the training organisation for
the aged-care sector, also looked at employment in the sector. This study drew from the 2013
Census and really only covered non-nursing staff. The study identified 14,400 people as working
in the aged-care sector of which 92% or 13,200 were carers or support workers.15 Clearly, these
figures underestimate the actual number employed within the aged-care sector, but they do
illustrate the paucity and poor quality of data available on this workforce.

If Grant Thornton’s data is reliable then two things are clear about the structure of the workforce
within the residential aged-care sector. This workforce is predominantly part-time and dominated
by caregivers, who make up almost 54% of all employees.

Grant Thornton’s analysis offers some projections of future labour demand. This is presented in
Table 4a and 4b for a high and low scenario.

Table 4a: High scenario for labour demand projections by occupation—2016 to 2026 16
Additional workers required

                      Facility managers     Nurses     Caregivers      Therapists   Non-care     Total
2016                           659           6,889       23,565           2,047       12,912     46,097
2026                           917           9,544       32,839           2,861       17,935     64,097
Change                         258           2,655       9,270            814         5,043      18,023

Table 4b: Low scenario for labour demand projections by occupation—2016 to 2026 17
Additional workers required

                      Facility managers     Nurses     Caregivers      Therapists   Non-care     Total
2016                           525           5,043       18,272           1,285       7,900      33,026
2026                           774           7,168       26,520           1,873       11,601     47,936
Change                         249           2,125       8,248            688         3,701      14,910

                                                                FINDING A BETTER BALANCE November 2017 11
Tables 4a and 4b are useful regardless of what the actual level of employment and demand for labour in the residential aged-care sector is presently. These tables offer us some idea of the scale of the change in labour demand that we are likely to see in the sector over the next decade. As well, these tables provide us with some idea of the importance of care workers to this future demand. Over the next 10 years, if Grant Thornton’s projections prove accurate, we are likely to see a 39% to 45% growth in demand for labour within the residential aged-care sector. More than 50% of this growth will be for caregivers. 12 FINDING A BETTER BALANCE November 2017
4 FUTURE OUTLOOK FOR NEW ZEALAND’S LABOUR MARKET
Increased demand for aged-care facilities and beds and for workers to staff these should be seen
in the context of the outlook for New Zealand’s labour markets over the next 10 years or so.
The skills and labour shortages being experienced in the aged-care sector—at whatever skill
level—seem likely to become commonplace across most, if not all, of the economy over the next
decade or so. This is the case even with moderately high levels of net migration. The reason
for this is the flip side of the forthcoming increase in demand for aged care: that of an aging
population (as illustrated in Figure 3) and with this, of course, an aging workforce.

Projections of the future size of the labour force essentially rely on two drivers: the proportion
of the adult population that chooses or is able to participate in the labour market; and migration
patterns. A third influence, that of the mortality of the working-age population, is of relatively
minor effect given the low mortality rates of the under-65s population and their stability over
the medium term.

Statistics New Zealand provides a number of forecasts of the working age population based on
assumptions around labour market participation,18 migration patterns and mortality rates.
Two extremes of these forecasts are scenarios based on assumptions of no net migration and
very high migration. The expected size of the work force for each of these extreme scenarios is
illustrated in Figure 7 for the period 2015 through to 2028. These scenarios show that by 2028
the workforce will be between 2.6 million people (no migration) and 2.9 million people (very
high migration). In 2017 there were 2.5 million people in jobs in the New Zealand economy.

Forecasting the number of jobs we are likely to have, or at least could potentially have in the
economy by 2028, is more speculative than demographic forecasts. This is mainly because such
forecasts rely on rates of economic growth and changes in productivity that are more difficult
to predict—especially over an extended period of time. Overcoming such uncertainty relies on
us seeing these future expectations as scenarios rather than forecasts. In other words, to make
some clear underlying assumptions about things like long-run economic growth and labour
productivity improvements, and then estimate the size of the job market from these. This is
what has been done in the analysis offered in Figure 6.

Over the past 20 years, the growth in GDP has averaged 2.8% in inflation-adjusted terms, while
the number of jobs filled by workers has grown at an annual average rate of 1.8%. These growth
trends are illustrated in Figure 6 and show anything but a smooth path, especially around the
time of the Global Financial Crisis between 2008 and 2010. These 20-year averages have been
used as the basis for the simple job forecasts offered in the analysis presented in Figure 7—this
assumes that the economy will grow at an average rate of 3% annually, that labour productivity
will improve by 1% on average each year, and that as a result the number of available jobs will
grow by 2% in a typical year.

                                                        FINDING A BETTER BALANCE November 2017 13
Figure 6: Changes in GDP and job growth—1997 to 2017 19
6%
5%
4%
3%
2%
1%
0%
1997 1999 2001 2003 2005 2007 2009 2011 2013 2015 2017
-1%
-2%
GDP growth Job growth
Figure 7: Forecasts for changes in labour demand and supply—2015 to 2028 20
3,250,000
3,000,000
Number of people
2,750,000
2,500,000
2,250,000
2,000,000
2015 2016 2017 2018 2019 2020 2021 2022 2023 2024 2025 2026 2027 2028
No migration Very high migration People in jobs
The picture offered in Figure 7 clearly illustrates the challenge New Zealand faces almost
immediately. This challenge is in finding enough people to undertake the work that is likely to
be available in the economy, something made more daunting when we consider the realism of
the assumptions underlying the analysis offered in this graph.
For example, Statistics New Zealand’s forecasts offered here are of the whole working-age
population aged 15 to 64, with some allowance for over-65s to remain the workforce. However,
this is clearly not the case in the actual job market as some people are unable to work because
of sickness, injury or disability and some are not available for work in paid employment because
they are studying or caring for family members. For instance, in June 2017 only around 80% of
15- to 64-year-olds were participating in the labour market.21
Furthermore, jobs will only exist if there are people to fill them. If New Zealand experiences
serious and on-going labour shortages the economy will likely take a different trajectory to the
one implicitly considered here and to some extent illustrated in Figure 5. In particular, economic
growth is likely to be choked off by labour shortages and these may drive greater efforts to lift
labour productivity in response both to these shortages and the higher wages that will eventuate
as a consequence. In turn, available workers will drift toward the more productive and higher-
paid sectors, leaving work in the less productive and poorer-paid sectors undone.
14 FINDING A BETTER BALANCE November 2017For the residential aged-care sector such a scenario poses a double whammy. At the macro or
national level, reduced economic growth impacts directly on the tax base—a one percent average
annual drop in the economic growth rate reduces tax revenue by the same amount unless a decision
is made to tax companies, workers and consumers more heavily. This makes it more difficult for
the government—and our society more generally—to meet the costs of an aging society. Amongst
these costs are, of course, the public subsidies that support residential aged care.
At the micro or local level, the drift of available workers to higher-paid sectors with improving
productivity will make it increasingly difficult for the residential aged-care sector, as well as
other care and services sectors, to recruit and retain staff. The aged-care sector already has
problems around staff retention that centre to some extent on the conditions and pay offered to
those working in this sector.22 There are few ways out of this conundrum. There are very limited
options for lifting productivity in the sector given the highly personal nature of aged care—
essentially care is a person-to-person activity that takes time if done well. Paying higher wages,
such as is now being offered through the pay equity settlement, requires more government
subsidies, but these are limited by the reduced tax base arising from lower economic growth.
To date, the immigration debate has not really considered such challenges. It is the intention
of this paper to raise them in the context of the needs and demands of the aged-care sector.
FINDING A BETTER BALANCE November 2017 155 MIGRANT EMPLOYMENT IN THE AGED-CARE SECTOR
The residential aged-care sector relies heavily on migrant workers. Therefore, the legal status
of these workers can be harmful to the workers themselves, to their employers, and potentially
to the people they serve.
Given the paucity of information around the size of the aged-care workforce it is difficult to
accurately know the extent to which this sector relies on migrant labour. The 2013 overview of
the wider care sector reported that 30% of its workforce was born overseas and 32% of caregivers.
This compares with 28% of the national workforce. The New Zealand Aged Care Workforce Survey
2014 reported that 30.5% of respondents were overseas born, with 37% of these from the UK and
a further 10% from Australia.23 The latter New Zealand Aged Care Workforce Survey 2016 reported
that just 25% of respondents to the survey were born overseas.24 This is possibly because of a
sampling bias in both surveys.
However, a survey of major providers of residential aged care in Auckland suggests the reliance
on labour from overseas-born workers is considerably higher than these proportions. This
survey was undertaken in early 2017 and summarised in Tables 5 for healthcare assistants
and on Table 6 for registered nurses.
Table 5: Employment of recent migrants as healthcare assistants—2017
Facility operator HCAs employed HCAs NZ born HCAs on temporary
work visas
St Andrew’s Village 90 19 31
Christian Healthcare 469 NA 112
Caughey Preston 81 9 19
Mercy Parklands 64 NA 30
Elizabeth Knox 112 8 35
TOTALS—numbers 816 36 227
–% 13% of those reporting 28%
Table 6: Employment of recent migrants as registered nurses—2017
Facility operator RNs employed RNs NZ born Overseas IQNs
St Andrew’s Village 30 2 28
Christian Healthcare 138 43 95
Metlifecare 59 38 21
Caughey Preston 31 6 25
Mercy Parklands 19 1 18
Elizabeth Knox 36 1 35
TOTALS – numbers 313 91 222
–% 29% 71%
16 FINDING A BETTER BALANCE November 2017Because of Auckland’s position as the migration gateway into New Zealand, these proportions of
overseas-trained employees alongside New Zealand-born ones are probably not reflected across
the country. The prevalence of overseas-born healthcare assistants and nurses in the Auckland
facilities cited in Tables 5 and 6 could lead to claims these businesses are actively recruiting
foreign-born migrants in preference to local unemployed people. However, these businesses
report a number of difficulties in recruiting local people into the residential aged-care sector.
The main reason for this is an almost complete lack of New Zealand citizens and residents with
suitable skills to undertake nursing and healthcare work in these facilities.
Other difficulties include:
• poor after-hours public transport schedules make it difficult for local unemployed people
to meet the requirements of shift work rosters with early starts and late finishes
• the poor status of aged care within the nursing and allied health fields mean most locally-
qualified nurses prefer to work in hospitals or primary health care
• the emotional stress of always working with clients and patients who die, some within
weeks or months of moving into a residential facility, means middle-aged people with
considerable life experience are more suited to working in aged-care facilities than
younger adults
• poor pay, set by national awards and funding contracts, in a city with expensive living costs.
It is the case too that Auckland is home for 50% to 60% of migrants coming to New Zealand
and has large local migrant communities that offer support for new migrants. In addition, the
Auckland job market is a great deal more buoyant than most other regions—over the past five
years 56% of all the new jobs created in the New Zealand economy were in Auckland.25 In these
circumstances it is quite reasonable to expect that migrants who might commonly face entry
barriers in the labour market will end up working in jobs that locals consider as being of lower
status and poorly paid.
It may be argued that the pay equity settlement for care workers will address the issue of poor
pay within the sector and for this group of occupations, although the outcome of this settlement
is by no means clear at this stage. This absence of clarity is driven mainly by the fact that the pay
settlement has not been fully funded by government. This has meant aged-care service providers
are being squeezed financially. The ramifications of this squeeze are still being felt, although two
emerging trends appear to be the closure of small and perhaps more marginal operations, and a
finer division of labour in order to exclude some workers from the pay equity agreement.26
Whether or not the reliance on migrant labour is only an Auckland problem, the gaps likely
to emerge in the labour market as identified in Figure 7 are of such a scale that even with
high rates of migration it is difficult to see how Auckland’s difficulties around recruiting and
retaining workers in the care sectors will not spread to other regions. In addition, much of this
more skilled workforce within the aged-care sector and across New Zealand is itself aging, so
employers are likely to find growing problems around the availability of suitably-skilled staff.
In addition, the precarious residency status of perhaps more than one-quarter of healthcare
assistants in the residential aged-care sector in Auckland does little to address the current
shortage of suitably-skilled and motivated people to undertake this work. As discussed below,
this problem has to some extent been created by poorly considered public policy—and behind
this, uninformed public debate around the role of immigration in New Zealand social and
economic future.
FINDING A BETTER BALANCE November 2017 176 IMPACT OF RECENT IMMIGRATION POLICY CHANGES In April 2017, the government announced a number of changes in immigration policy that will have a significant impact on the employment of migrant workers in the aged-care and related sectors. These changes came into effect in August 2017 and relate to two principal areas of immigration policy: the Skilled Migrant and Essential Skills visa categories. Changes in the Skilled Migrant visa category section include the introduction of a two-tiered remuneration threshold system. Under this system, occupations that have recognised skill levels at ANZSCO skill Levels 1, 2 or 3 face an income threshold of $41,000 per year, while other occupations that don’t have such recognised skill levels face a higher income threshold of $73,299 per year. These thresholds must be exceeded for a person already working here under a temporary visa if they are to be considered for a Skilled Migrant visa. Occupations such as a registered nurse meet the ANZSCO Level 3 status, so will face the lower- income threshold. Other occupations commonly employed in the residential aged-care sector are unlikely to meet this Level 3 status, so face the higher income threshold as skilled occupations or positions. In most cases, this higher income threshold will not be met by people working in aged residential care, which means they will not be successful in applications for a Skilled Migrant visa. This applies especially for healthcare assistants who often have recognised and relevant skills and qualifications, but these are not recognised as being at a sufficient level to meet the lower income threshold. The main change to the Essential Skill visa category is that these visas will in future be granted only for three sequential one-year periods, after which a person must leave New Zealand for at least 12 months before being able to reapply. It has been common practice for migrants working as healthcare assistants to work in New Zealand, often for the same employer, for extended periods on a sequence of short-term visas. While this was possible, it did not, of course, offer any stability for the migrants and their families. It also limited the extent to which employers would take an interest in such things as training and career development for their employees. The personal stories offered below illustrate the burden and costs imposed by this pattern of sequential temporary visas. The changes introduced in August 2017 to require a 12-month absence from New Zealand between visas will end such practices. They may also mean that fewer people will be interested in coming to New Zealand to work as healthcare assistants when there is little or no chance of permanent residence. This stands in sharp contrast with the opportunities for permanent residence offered to those entering on student visas when many attend courses of dubious academic quality.27 An important contribution to the tenuous residency status of migrant healthcare assistants working in New Zealand on Essential Skills visas is the status accorded to their skills. Presently, eligibility for a Skilled Migrant visa requires the applicant to have a qualification recognised as being at Levels 1, 2 or 3 under the ANZSCO classification system. Many migrant healthcare assistants have or gain qualifications at NZQA Level 4, but this is one of few Level 4 qualifications not recognised by Immigration New Zealand as equivalent to ANZSCO Level 3. The reason for this anomaly is unclear, but probably in part arises from the outdated state of the ANZSCO system, which has failed to keep track with changes in the nature and complexity of work. 18 FINDING A BETTER BALANCE November 2017
A classification system for grading skills is useful for determining which skill sets are of
sufficient complexity or intricate enough to warrant being seen as sufficiently ‘skilled’ to allow
entry as a migrant. However, a two-fold reality is emerging. Firstly, most occupations have
increasing skill content, especially in the use of technology and increasing complexity around
on-the-job practice. Secondly, as illustrated in Figure 7, even with high levels of net inward
migration and more effective training and education for marginalised young people, it is unlikely
there are sufficient people to undertake all the work available in the New Zealand economy.
The grading of potential migrants according to what is increasingly becoming an arbitrary
classification system is unlikely to assist us to cover all the skills and labour gaps in the New
Zealand economy over the next decade and beyond.
It will often be the case that a particular industry sector argues it deserves special exemptions
from immigration rules.28 Such exemptions, if granted, can become ad-hoc and quite unfair,
especially if the exemptions seem to undermine the purpose of the policy or policy changes.
The recent immigration policy changes that have made access to work visas more restrictive
for people without ‘essential skills’ have to some extent been driven by public concern around
current immigration policies.29 While labour-market abuses of migrant workers do not feature
prominently in New Zealanders concerns around immigration, such abuses regularly feature in
the media and occasionally in official or academic studies. One study of migrant labour abuses
found such abuses were most common in construction, dairying, hospitality and horticulture
sectors.30 These sectors are relatively unregulated, unlike the aged-care sector, which because
of its reliance on public subsidies is heavily regulated. Any argument for exemptions to
recent immigration policy changes needs to be mindful both of the public opinion to recent
immigration patterns and levels, and the extent to which such exemptions will contribute
more positively to New Zealand social harmony and economic prospects.
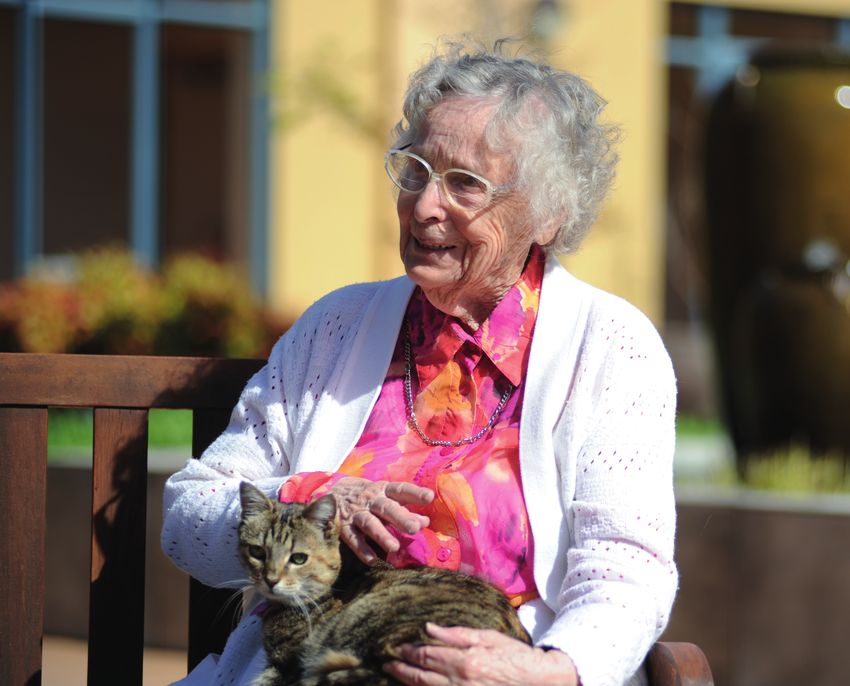
FINDING A BETTER BALANCE November 2017 197 PERSONAL STORIES OF MIGRANT WORKERS The following three stories are of migrant health care workers employed at St Andrew’s Retirement Village in St Heliers, Auckland. Two of these stories are to some extent those of perseverance and eventual success, while the third may not end so well. All three are most likely representative of the commitment that hundreds and perhaps thousands of migrants working legally within the aged-care and other care sectors have made to their employers, their clients and to New Zealand over extended periods. These stories are important to know because not only do they humanise some of the difficulties and complications raised in this paper, they also illustrate well the sort of New Zealanders we might gain as colleagues, neighbours and friends if we had more informed and purposeful immigration policies. Josie Josie is a healthcare assistant who has worked at St Andrew’s Village since April 2006 on a series of temporary ‘Essential Skills’ work visas. She is 59 years old. In 2006, Josie migrated to New Zealand from the Philippines, initially on a visitor’s visa, with her husband and their four children. Her children are now aged between 21 and 31 and are all permanent residents of New Zealand in their own right. Two have trained as registered nurses in New Zealand, another as a chef, and the fourth as a diversional therapist. While Josie’s husband has worked in New Zealand he is not currently employed. Before her migration, Josie was a registered nurse in the Philippines with 13 years’ experience in medical and emergency services. During her stay in New Zealand she has completed the National Certificate in Health Care Assistance at Level 4. Josie’s temporary work visa expires in June 2018, and under present immigration regulations she is required to apply annually for the next three years for a renewal and then to leave New Zealand for at least 12 months before applying again for a work visa. She is not eligible to apply for permanent residency in New Zealand under a skilled migrant category because she is now over 55 years old, although she applied twice for permanent residency before she reached 55 only to be declined because of her lack of skills. Josie wishes to stay permanently in New Zealand with her children, but in three years time, after have 15 years’ working for St Andrew’s as a healthcare assistant, she most likely will have to return to the Philippines with little chance of returning. Shirley Shirley works as a healthcare assistant at St Andrew’s Village and has done so since migrating to New Zealand in February 2007. Before coming to New Zealand she worked as a registered nurse in the Philippines and the Middle East, and as an intensive care nurse in those places. In 2009, Shirley sponsored the migration of her husband and two of her four children. Her children are aged between 19 and 27 and currently three live in New Zealand—two are working and the other studying at university. Shirley has completed Levels 3 and 4 of the National Health Care Certificate through Careerforce and is currently undertaking further Level 4 study in dementia care online through the University of Tasmania. 20 FINDING A BETTER BALANCE November 2017
In 2009, Shirley’s application for an extension of her work visa was declined on the basis that she
lacked necessary skills and qualifications. This decision was reviewed and reversed through the
advocacy and support of her employer. In 2014, Shirley applied for permanent residency on the
basis of her skills and experience as a healthcare assistant and her then seven years employment
at St Andrew’s. This application was declined again on the basis of insufficient skills.

Shirley’s husband is also employed at St Andrew’s Village as a skilled painter, and it has been
through his occupation that both he and Shirley have gained permanent residency in New Zealand.

Ed
Ed works as a healthcare assistant at St Andrew’s Village—a job he has held since his arrival
in New Zealand in 2005 on a temporary work visa. He is married and he and his wife have
two sons. Their 20-year-old is undertaking tertiary study in business. Their 30-year-old son is
married, works as part of the maintenance team at St Andrew’s and has permanent residence.
Ed’s wife also works at St Andrew’s as a chef.

Ed trained as a healthcare assistant in the Philippines, but also has a Filipino qualification
in public administration that has been credited at Level 7 in the NZQA framework. With the
sponsorship and support of St Andrew’s he has completed his first year of study or a Bachelor
of Nursing qualification. Because of the cost, course fees and time requirements, Ed has not yet
been able to complete this course.

Ed and his family’s residency status remains temporary, despite the fact that they have worked in
New Zealand for the past 12 years—and for the same employer for this entire period. In 2014,
Ed attempted to gain permanent residency in his role as a healthcare assistant at St Andrew’s.
This application was unsuccessful because of the low status afforded by his occupation. The family
hopes to renew their temporary visas in late 2017 when their current visas lapse and then will have
two further chances to apply for such renewals.

In response to his residency status and treatment Ed says he feels that ‘you are not welcome despite
what you have done. My efforts have been beneficial to New Zealand, and through this St Andrew’s
has been very supportive.’

                                                         FINDING A BETTER BALANCE November 2017 21
8 CONCLUSIONS AND RECOMMENDATIONS To recap the main points raised in this short advocacy paper: 1 Demand for aged care in residential facilities may rise by as much 40% over the next 10 years. With such an increase, the requirement for workers, including healthcare assistants, may expand by as much as 45%. 2 The expense of public subsidies and the allocation of places in residential aged care are anything but transparent. The cost is likely to exceed $1 billion annually, with this cost hidden in the budgets and financial reports of 20 DHBs and in MSD’s superannuation bills. The DHBs have every incentive to ration access for financial reasons, and given their role in deciding access to residential aged care it seems highly likely that such rationing is taking place. 3 Aged care facility operators - and especially those in Auckland, continue to have trouble in attracting and retaining New Zealand residents as staff, especially in lower-paid occupations such as healthcare assistants. The recent pay equity settlement has improved the remuneration offered to caregivers in the aged-care sector and this may make such positions more attractive. However, it seems likely the changed relativities this settlement has brought will simply create recruitment and retention problems in other parts of the sector, especially within the ranks of registered nurses and non-care staff. 4 In Auckland in particular, aged-care facility operators are heavily reliant on foreign-born workers and people on temporary work visas to staff their facilities. Recent changes to immigration laws will make it more difficult to find staff for the care positions both for facility-based and home-based caring. 5 These recent immigration law changes are unjust because they have left hundreds of care workers in a position where they will need to leave New Zealand over the next three years as their temporary visas expire. This is after they have shown a long-term commitment to New Zealand, their employers and the people they care for. This treatment stands in sharp contrast to that of people on other forms of visas, and especially student visas, which in some instances appear to being abused for the simple reason of gaining permanent residency. In response to these circumstances and outcomes, we recommend the following short-term and medium-term responses on the part of the New Zealand Government, the aged-care sector and concerned New Zealanders: 1 That Immigration New Zealand immediately review the status of healthcare assistants under current immigration regulations with a view to including this occupational category into the skill migrant status—although with provisos around qualifications and experience. 2 That the Ministry of Health begins to openly report total aged-care budgets administered by it and District Health Boards, as well as the overall operation of home-based and residential aged-care services and facilities. 3 That government agencies and representatives from the aged-care sector and from trade unions within this sector develop an aged-care workforce plan. That this plan is completed by the end of 2018 and that it addresses the need to recruit and train more New Zealanders into the aged-care sector and the migration pathways needed to address remaining skills and labour shortages. 4 That the newly-elected government, as well as opposition parties alongside civil society organisations, conduct and lead a broader public debate around immigration in New Zealand’s social and economic future. Such a debate should be seen as a vital input into the development of New Zealand’s migration strategy. 22 FINDING A BETTER BALANCE November 2017
REFERENCES
1    The number of rest homes is reported by the Ministry of Health at www.health.govt.nz/your-health/
     certified-providers/aged-care
2    New Zealand Aged Care Association’s Quarterly Bed Survey—June 2017.
3    Ibid.
4    www.health.govt.nz/nz-health-statistics/health-statistics-and-data-sets/older-peoples-health-data-and-stats/
     dhb-spending-services-older-people
5    New Zealand Treasury (2012). Long-term care and fiscal sustainability. Table 2 p.10.
6    See New Zealand Treasury (2012).
7    These forecasts are based on Statistics New Zealand’s Population Forecasts—2014 base, using the 90th percentile
     projections. Statistics New Zealand offers a number of forecasts, many of them with lower growth estimates
     than the ones cited here. The 90th percentile projections are based on estimates that there is a 90% chance actual
     eventual figures will be at this number or less. Unless otherwise stated, the forecasts offered in this paper are
     based on this 90th percentile projection.
8    Source: Statistics New Zealand’s Population Forecasts—2014 base using the 90th percentile projections.
9    Ibid.
10 Grant Thornton (2010) Aged Residential Care Service Review, Available at www.grantthornton.co.nz/insights/
   aged-residential-care-service-review
11   Grant Thornton (2010) Figure 1 p.7.
12   Ibid. Table 28 p.93
13   Ibid. Table 29 p.93
14 Ibid. Table 33 p.108
15   Berl (2014) Profile of Careerforce’s 2013 workforce.
16 Grant Thornton (2010) Table 39 p.115
17   Ibid.
18 These forecasts make some assumptions around the labour market participation of the over-65s population,
   but assume here that 100% of the working age population (aged 15 to 64) is available for work.
19 Data is taken from Statistics New Zealand’s National Accounts and Labour Market Surveys databases.
20 Labour force projections are based on Statistics New Zealand’s projections for the working-age population,
   while the job forecasts are based on an assumption of 2% average annual growth.
21 Statistics New Zealand’s Labour Market Surveys—Household Labour Force Survey.
22 Ravenswood, K. and Douglas J (2016) The New Zealand Aged Care Workforce Survey 2016.
23 Ravenswood, K. Douglas, J. and Teo, S (2014) The New Zealand Aged Care Workforce Survey 2014. p.7.
24 Ravenswood, K. and Douglas J (2016).
25 Data from Statistics New Zealand’s Household Labour Force Survey database for the period June 2012 to June 2017.
26 See, for example, the announcement of the closure of the Caughey-Preston rest home, with a projection that
   hundreds of small ones are at risk of closure due to the pay equity settlement. www.newshub.co.nz/home/
   new-zealand/2017/08/rest-home-sinks-following-pay-equity-settlement.html. As an example of changing
   divisions of labour see the example of the Tasman Rest Home in Nelson at https://www.stuff.co.nz/nelson-mail/
   news/96415612/nelson-rest-home-to-restructure-staff-following-pay-equity-settlement
27 See, for example, a Radio New Zealand article on Indian business owners exploiting foreign students at
   www.radionz.co.nz/news/national/336687/indian-businesses-sell-jobs-for-visas-to-students
28 See, for example, the special exemptions from recent immigration policy changes already made to the South
   Island dairy industry at http://www.stuff.co.nz/business/farming/93015348/farmers-set-to-continue-having-
   access-to-migrant-workers
29 See UMR public opinion survey from June 2017 on New Zealander’s attitudes to immigration at
   http://umr.co.nz/sites/umr/files/final_full_nz_insight_slides.pdf
30 See article on University of Auckland academic Christina Stringer’s research at https://www.auckland.ac.nz/
   en/about/news-events-and-notices/news/news-2016/12/worker-exploitation-widespread-study.html

                                                                   FINDING A BETTER BALANCE November 2017 23
You can also read