Beyond the potential - Cryo TEM-EELS for bio samples - CCP4-EM Spring Symposium 2021 - CCP-EM
←
→
Page content transcription
If your browser does not render page correctly, please read the page content below
CCP4-EM Spring Symposium 2021
Beyond the potential – Cryo TEM-EELS
for bio samples
Matthias Wolf
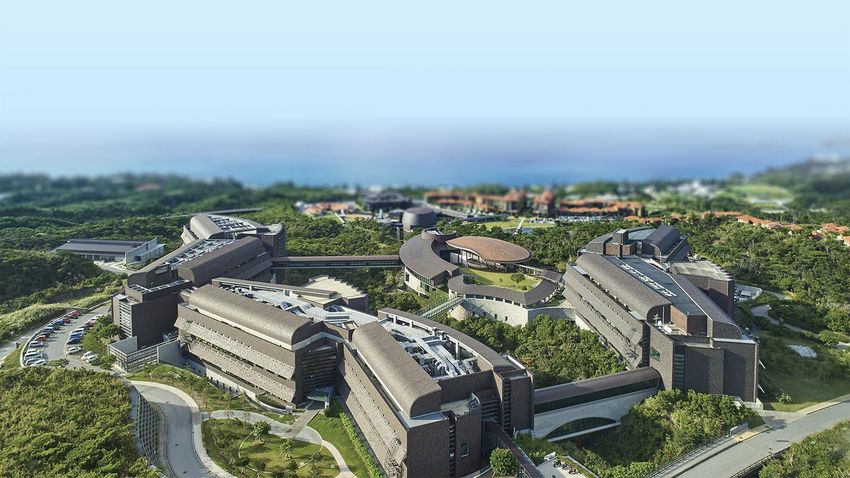
© Okinawa Institute of Science and Technology Graduate University 2020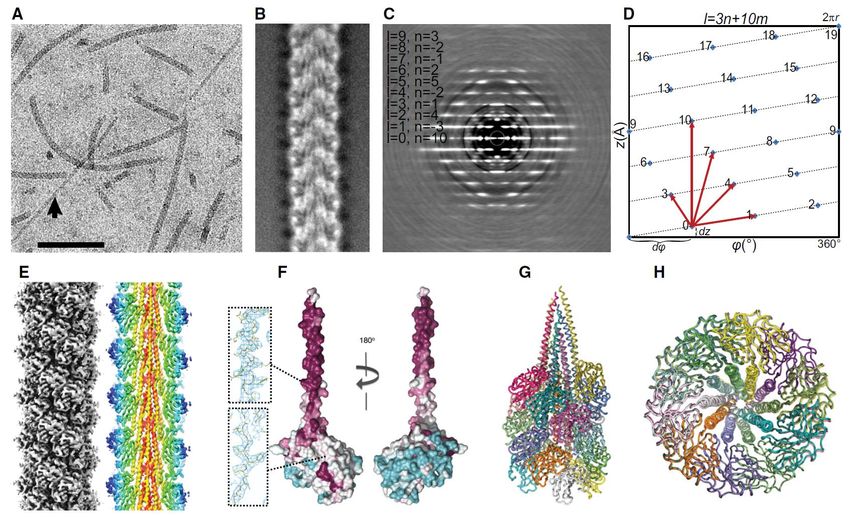
Matthias Wolf
                                                                                             Okinawa Institute of Science and Technology Graduate
                                                                                             University, Okinawa, Japan
                                                                                             Academia Sinica, Institute of Biological Chemistry, Taiwan

                                                                                             Makoto Tokoro Schreiber
          Direct                                                                             PhD student in Wolf Unit – will graduate this year!
                                                                                             Alan Maigné

          Detection                                                                          Stewart Blossom Quantum Science Institute, UBC, Canada

          TEM-EELS                                                                           Research
                                                                                             Support
          Acknowlegments
                                                                                             Maigné, A., and Wolf, M. (2018). Low-dose electron energy-loss
                                                                                             spectroscopy using electron counting direct detectors. Microscopy
                                                                                             (Oxford, UK) 67, i86–i97.
                                                                                             Meshcheryakov et al (2019). High-resolution archaellum structure
                                                                                             reveals a conserved metal binding site. EMBO Reports.
2 0 2 1 / 4 / 2 4   © Okinawa Institute of Science and Technology Graduate University 2020                                                                       2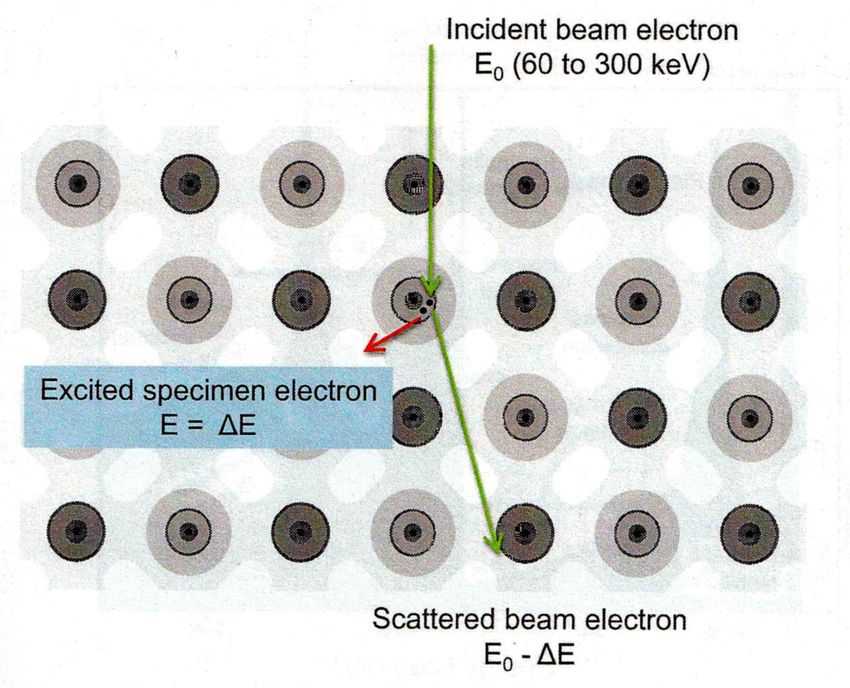
“Images in TEM are projections of a 3D object”

                            The New Yorker February 25th, 1991 by John O'Brien
                    and Frank J., 3D-EM of macromolecular assemblies, Assoc. Press, 1996
2 0 2 1 / 4 / 2 4                             © Okinawa Institute of Science and Technology Graduate University 2020   3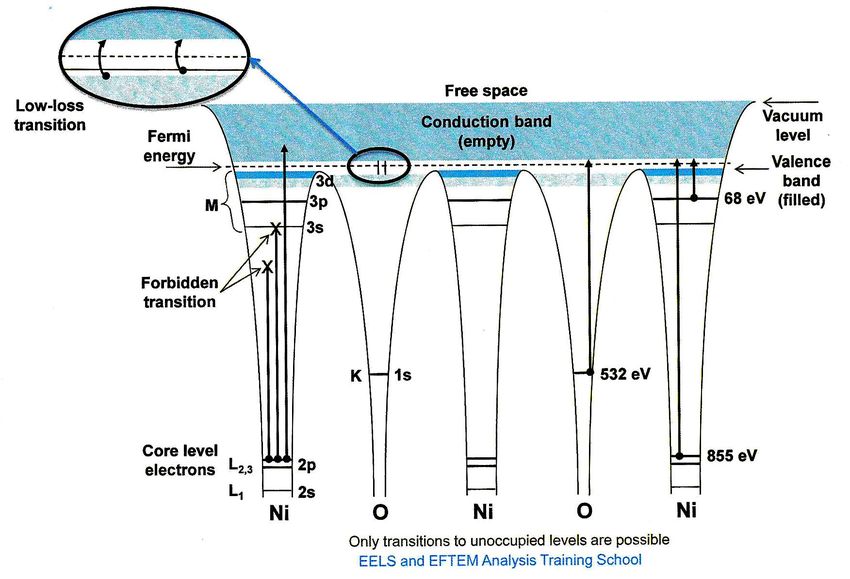
For a typical cryo-EM 3D reconstruction, two assumptions are made:
                               The image is a projection of a thin phase object

               The image is a true projection                                              …of a pure phase object
               • object has zero thickness                                                 • image is a result only of elastic
                 (“thin”)                                                                    scattering

                                        In reality, this is not the case

               The image is NOT a true projection                                          It is NOT a thin phase object
               • it has thickness in Z                                                     • it is a combination of both elastic and
               • Partial solution: Ewald sphere                                               inelastic scattering
                 correction                                                                • Partial solution: zero-loss energy filter
                                                                                           • Exit wavefront reconstruction
2 0 2 1 / 4 / 2 4                               © Okinawa Institute of Science and Technology Graduate University 2020                   4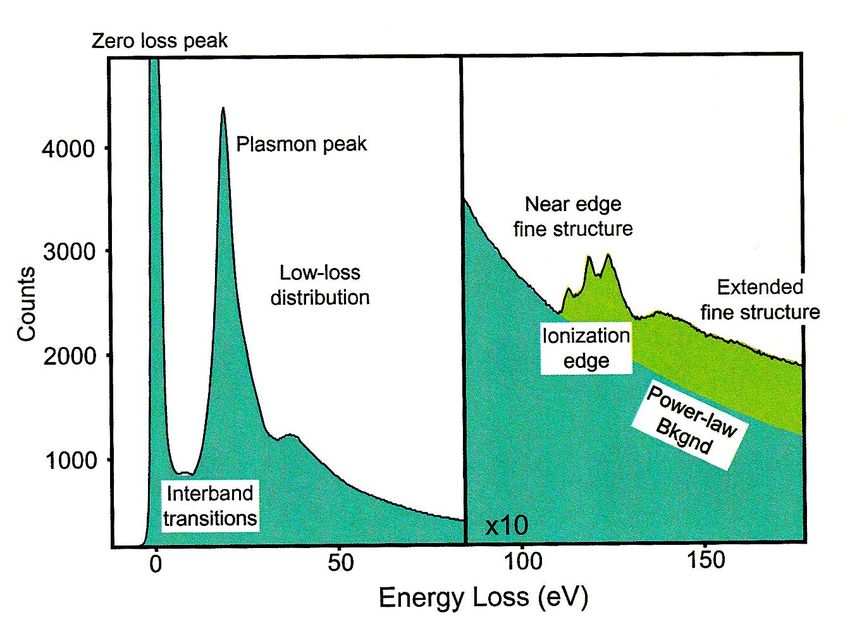
TEM beam interaction with specimen and signals

                                  Gatan EELS School, 2016
2 0 2 1 / 4 / 2 4                    © Okinawa Institute of Science and Technology Graduate University 2020   5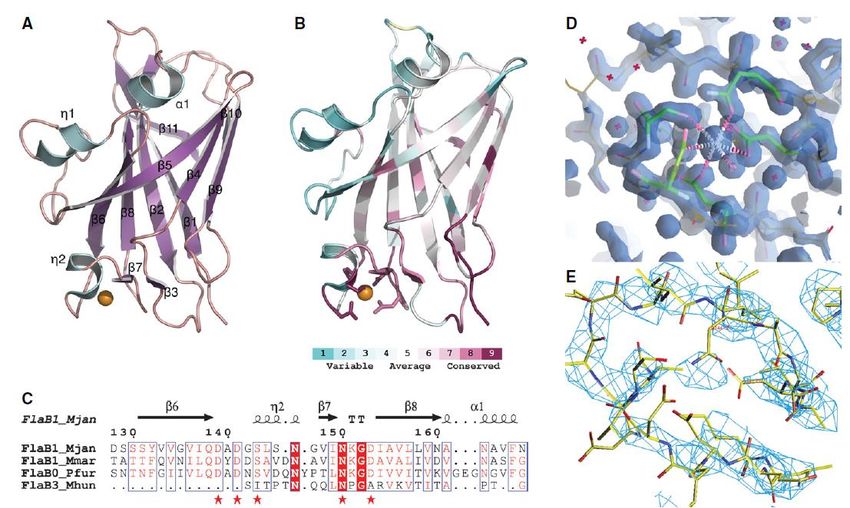
Electron Energy-Loss (EEL) at atomic scale

                               Gatan EELS School, 2016
2 0 2 1 / 4 / 2 4                 © Okinawa Institute of Science and Technology Graduate University 2020   6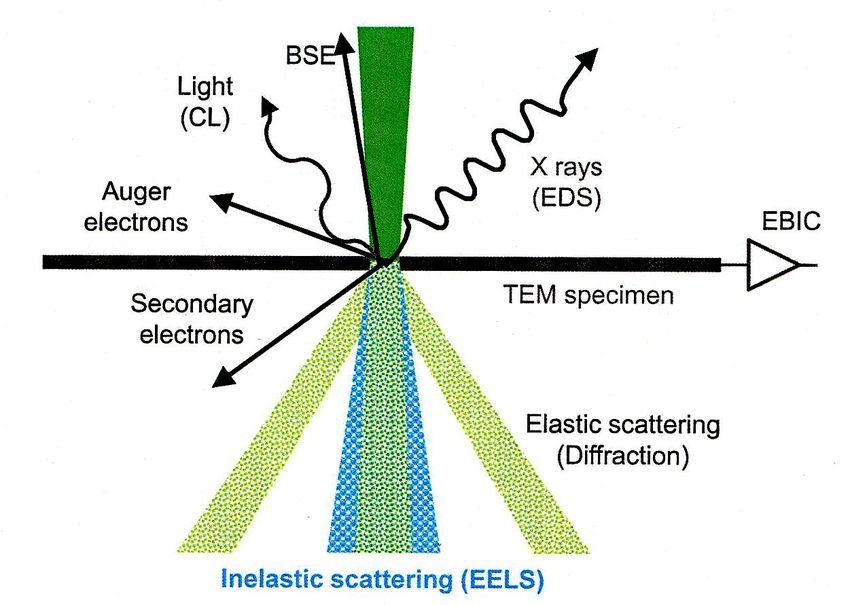
Structure and energy levels of specimen electrons

                                   Gatan EELS School, 2016
2 0 2 1 / 4 / 2 4                     © Okinawa Institute of Science and Technology Graduate University 2020   7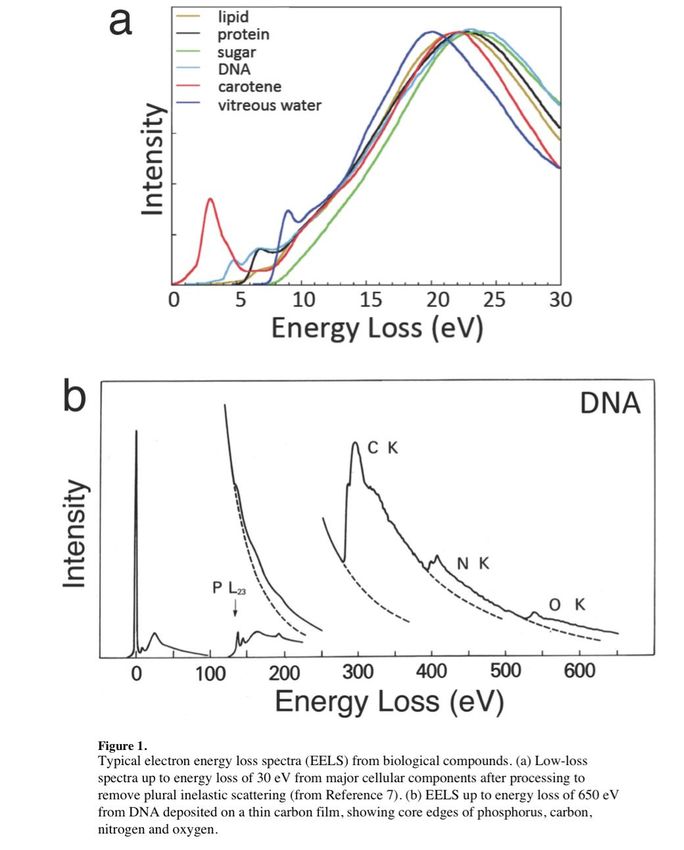
Typical Electron Energy Loss Spectrum (EELS)

                                Gatan EELS School, 2016
2 0 2 1 / 4 / 2 4                  © Okinawa Institute of Science and Technology Graduate University 2020   8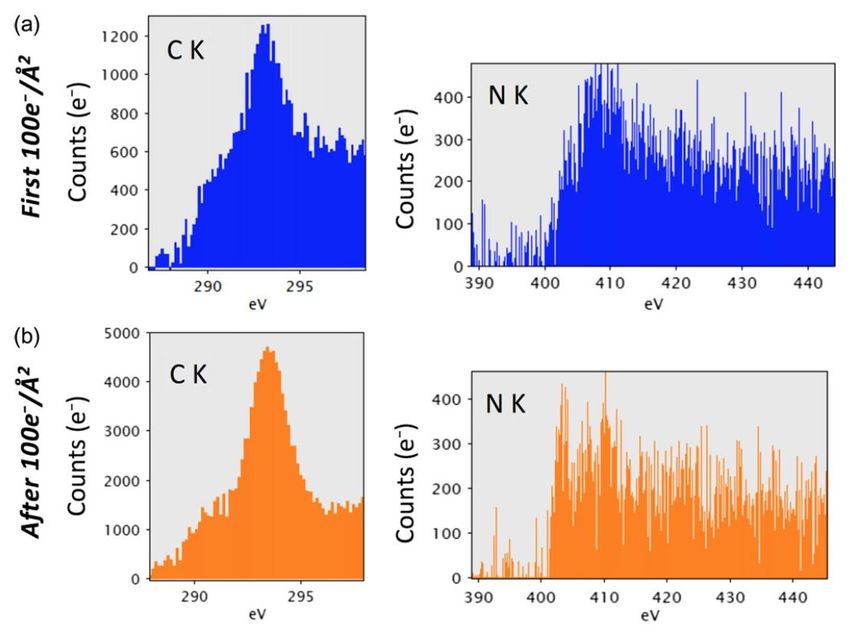
Dual camera
          EELS setup
          at OIST
          Gatan Orius plus K2 Summit
          direct electron counting in
          movie mode

2 0 2 1 / 4 / 2 4   © Okinawa Institute of Science and Technology Graduate University 2020   9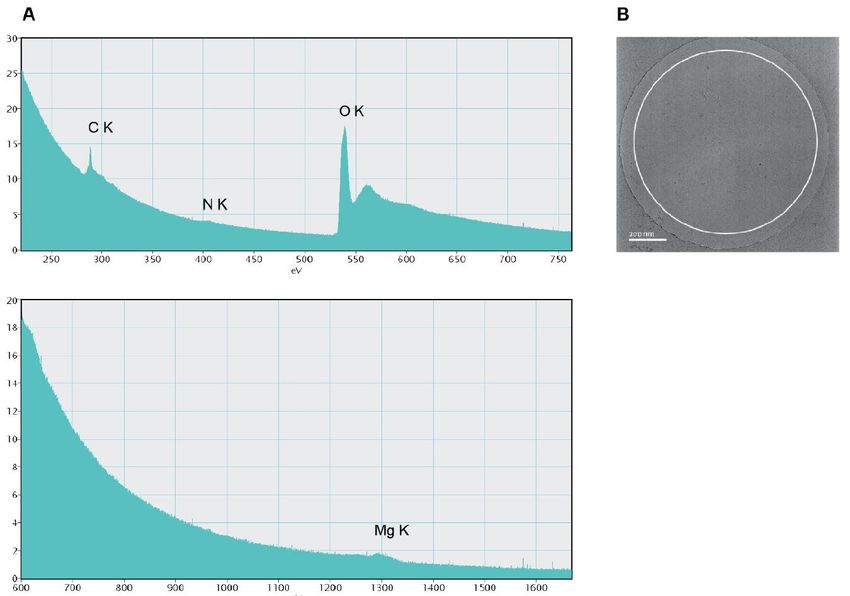
Unique GIF dual-camera setup on OIST Titan Krios

                                                                                                                                                                         Orius          K2
                                                                   Sensors on same
                                                                   mechanical plane                                                                       pixels         2048 x 2048    3838 x 3710
                                                                                                                                                          Pixel size     7.4 µm         5 µm
                                                                                                                                                          fastest full   ~0.1 s         0.025s
                                                                                                                                                          frame read     ~10 fps        40fps
                                                                                   Orius
                                                                                                                                                          out
                                                                                    CCD
                                                                                  camera                                                                  Use            -Alignments    -high
                                                                                                                                                                         -calibration   sensitivity/
                                                                                                                                                                         reference      framerate
                                                                                 Detector                                                                                -zero-loss     recording
                                                                                 housing                                                                                 recording

                                                                                    K2
                                                                                   DED
                                                                                  camera
Crozier P.A., Miller B.K. (2016) Spectroscopy of Solids, Gases, and Liquids in the ETEM. In: Hansen T., Wagner J. (eds) Controlled Atmosphere Transmission
Electron Microscopy. Springer, Cham. https://doi.org/10.1007/978-3-319-22988-1_4
2 0 2 1 / 4 / 2 4                                                                © Okinawa Institute of Science and Technology Graduate University 2020                                                10
Center beam in ice hole
M.T. Schreiber
2 0 2 1 / 4 / 2 4 © Okinawa Institute of Science and Technology Graduate University 2020 11EELS spectrum on camera (K2 counting, movie mode)
Longer edge of K2
Shorter edge of K2
Crop spectral signal
Energy loss direction
To reduce file size
M.T. Schreiber
2 0 2 1 / 4 / 2 4 © Okinawa Institute of Science and Technology Graduate University 2020 12Signal depends on how channels are summed
Single 0.025s frame Sum of 2400 0.025s (30s) frames
Line profile single channel Line profile single channel
pixels pixels
2 0 2 1 / 4 / 2 4 © Okinawa Institute of Science and Technology Graduate University 2020 13Signal depends on how channels are summed
Single 0.025s frame Sum of 2400x 0.025s (30s) frames
Line profile sum ~330 channels Line profile sum ~330 channels
pixels pixels
M.T. Schreiber
2 0 2 1 / 4 / 2 4 © Okinawa Institute of Science and Technology Graduate University 2020 14Same area, same dose on two different cameras
Orius 0.5s exposure K2 sum of 10x 0.05s (0.5 s) exposure
Carbon K-edge Oxygen K-edge Carbon K-edge Oxygen K-edge
284 eV 532 eV 284 eV 532 eV
Energy loss (eV) pixels
M.T. Schreiber
2 0 2 1 / 4 / 2 4 © Okinawa Institute of Science and Technology Graduate University 2020 15Calibrating K2
Energy loss direction
K2 sensor length along energy
Orius dispersion direction is slightly
K2 longer than on Orius
Orius • Known peaks at low energy
losses (ex. C, O) used to
calibrate K2 spectrum
• New calibration for each energy
shift and dispersion used
K2 • Frequently check ZLP centered
on Orius
M.T. Schreiber
2 0 2 1 / 4 / 2 4 © Okinawa Institute of Science and Technology Graduate University 2020 1628
26
24
Carbon K-edge
22 284 eV Oxygen K-edge
20 532 eV
18
16
14
Nitrogen K-edge
12 401 eV
10
8
6
4
2
0
250 300 350 400 450 500 550 600 650 700 750
eV
20
18
16
14
12
10
8
6 Magnesium K-edge
4
1305 eV
2
0
600 700 800 900 1000 1100 1200 1300 1400 1500 1600
2 0 2 1 / 4 / 2 4
eV
© Okinawa Institute of Science and Technology Graduate University 2020 17With caution can measure low-loss regimen
1s at 40 fps spot 11
Plasmon
peak
Possibly
Hydrogen K-edge
~13 eV
M.T. Schreiber
2 0 2 1 / 4 / 2 4 © Okinawa Institute of Science and Technology Graduate University 2020 18General points
• For lower energy shift / higher dispersion, use faster frame rate, more channels
and lower dose rate
• For high energy shifts can use lower frame rates and more dose.
• Need to test dose on camera before full measurement
• The more concentrated the sample the better
2 0 2 1 / 4 / 2 4 © Okinawa Institute of Science and Technology Graduate University 2020 19Metal identification in archaeal filaments
Gas composition during radiolysis
Applications DED EFTEM-spectrum imaging of vitrified bio samples
2 0 2 1 / 4 / 2 4 © Okinawa Institute of Science and Technology Graduate University 2020 20Cryo-EM of Methanococcus maripaludis filaments (“archaella”)
Meshcheryakov et al (2019). High-resolution archaellum structure reveals a conserved metal binding site. EMBO Reports.
2 0 2 1 / 4 / 2 4 © Okinawa Institute of Science and Technology Graduate University 2020 21Methanococcus FLAB1 X-ray and cryo-EM structures
X-ray
(1.5 Å
resolution)
cryo-EM
(4.0 Å
resolution)
Meshcheryakov et al (2019). High-resolution archaellum structure reveals a conserved metal binding site. EMBO Reports.
2 0 2 1 / 4 / 2 4 © Okinawa Institute of Science and Technology Graduate University 2020 22Low-dose DED TEM/EELS of Methanococcus maripaludis
Meshcheryakov et al (2019). High-resolution archaellum structure reveals a conserved metal binding site. EMBO Reports.
2 0 2 1 / 4 / 2 4 © Okinawa Institute of Science and Technology Graduate University 2020 23Mg2+ was consistent with LC-MS/MS and ICP-MS
Meshcheryakov et al (2019). High-resolution archaellum structure reveals a conserved metal binding site. EMBO Reports.
2 0 2 1 / 4 / 2 4 © Okinawa Institute of Science and Technology Graduate University 2020 24Regioselective gas formation due to radiolysis (“bubblegrams”)
Internal Protein of HSV mapped by bubblegrams, Wu et al, JVirol (2015)
2 0 2 1 / 4 / 2 4 © Okinawa Institute of Science and Technology Graduate University 2020 25Chemical modification due to radiolysis (archaeal filaments)
Maigné, A., and Wolf, M. (2018). Low-dose electron energy-loss spectroscopy using electron counting direct
detectors. Microscopy (Oxford, UK) 67, i86–i97.
2 0 2 1 / 4 / 2 4 © Okinawa Institute of Science and Technology Graduate University 2020 26Biomapping with DED EFTEM-SI
(direct electron detection energy-filtered TEM spectrum imaging)
• At low kV and possibly with
monochromator, we should
be able to see very clearly the
low loss energy loss of the
different chemical entities
• While phase images (TEM) or
scattering base images (STEM)
may not provide contrast,
EELS could provide a map of
these entities.
• Additional elements can also
be mapped such as P, Ca …
• Lower kV means larger cross
section, higher EELS signal
2 0 2 1 / 4 / 2 4 © Okinawa Institute of Science and Technology Graduate University 2020 27Thank you!
You can also read