Biochemical semi-automated acoustics by Dipstick image processing based on arduino
←
→
Page content transcription
If your browser does not render page correctly, please read the page content below
Original Articles

                                                                                                                    DOI: 10.17765/2176-9206.2021v14n2e7991
                                                                                                                                           e-ISSN: 2176-9206

            Biochemical semi-automated acoustics by Dipstick image processing
                                   based on arduino

            Acústicas bioquímicas semi-automatizadas por processamento de imagem Dipstick
                                         com base em arduino

 Ronneery Moura Teles1, Ronneesley Moura Teles2, Antonio Márcio Teodoro Cordeiro Silva3, Denise da Silva
                Pinheiro4, Lee Chen-Chen5, Xisto Sena Passos, Cristiene Costa Carneiro6
  1
    Biomedical graduate from Universidade Paulista, Campus Goiânia-Flamboyant, Goiânia (GO), Brazil; 2 Permanent professor at the Federal Institute of
Goiás, Campus Ceres, Ceres (GO), Brazil; 3 Permanent professor at the School of Medical, Biomedical and Pharmaceutical Sciences at the Pontifical Catholic
 University of Goiás, Goiânia (GO), Brazil; 4 Biomedical in the Institute of Biological Sciences at the Federal University of Goiás, Goiânia (GO), Brazil; 5 Per-
manent professor at the Institute of Biological Sciences, Federal University of Goiás, Goiânia (GO), Brazil; 6, 7 Professor at the Institute of Health Sciences at
                                          Universidade Paulista, Campus Goiânia-Flamboyant, Goiânia (GO), Brazil.
                                   *
                                       Corresponding author: Cristiene Costa Carneiro - E-mail: profacristiene@gmail.com

             ABSTRACT
             Although many devices are available to read urinalysis reactive strips, potential failure, based on human interpreta-
             tion, persists in routine tasks. Current study develops and evaluates the performance of an Arduino-based device for
             the semi-automated reading of reactive strip parameters. The glucose parameter of a commercial reactive strip model
             was analyzed by the system, which predicts analyte concentration by submitting the color observed in the strip to a
             regression model, adjusted to a database of color patterns. The system was assessed by reading of 80 strips with 16
             samples of random glucose concentrations. The lowest coefficient of variation after five replicated readings was 4.5%
             and the highest was 16.6% (MSE=68.7 mg/dL; r=0.979). The device featured satisfactory results plus low costs. To
             make it useful in the laboratory routine, further experiments with other parameters and other classes of urinalysis
             reactive strips would be necessary.

             Keywords: Automation. Arduino. Urinalysis.

             RESUMO
             Apesar da ampla disponibilidade de dispositivos para leitura de tiras reativas para análise de urina, falhas potenciais
             persistem na rotina baseada na interpretação humana. O objetivo deste estudo foi desenvolver e avaliar o desempen-
             ho de um dispositivo baseado em Arduino para a leitura semi-automática de parâmetros de fitas reativas. O parâmetro
             glicose de um modelo de tira reativa comercial foi analisado pelo sistema, que prevê a concentração do analito sub-
             metendo a cor observada na tira a um modelo de regressão, ajustado a um banco de dados de padrões de cores. O
             sistema foi avaliado através da leitura de 80 tiras com 16 amostras de concentrações aleatórias de glicose. O menor
             coeficiente de variação após cinco leituras replicadas foi de 4,5% e o mais alto foi de 16,6% (MSE = 68,7 mg / dL; r =
             0,979). O dispositivo apresentou resultados satisfatórios mais baixos custos. Para torná-lo útil na rotina laboratorial,
             seriam necessárias novas experiências com outros parâmetros e outras classes de tiras reativas para análise de urina.

             Palavras-chave: Automação. Arduino. Urianálise.

                                                                                                                             Received in: December 10, 2019
                                                                                                                            Accepted on: November 06, 2020

                                           Saud Pesq, 2021 jan./mar.; 14(2):341-350 - e-ISSN 2176-9206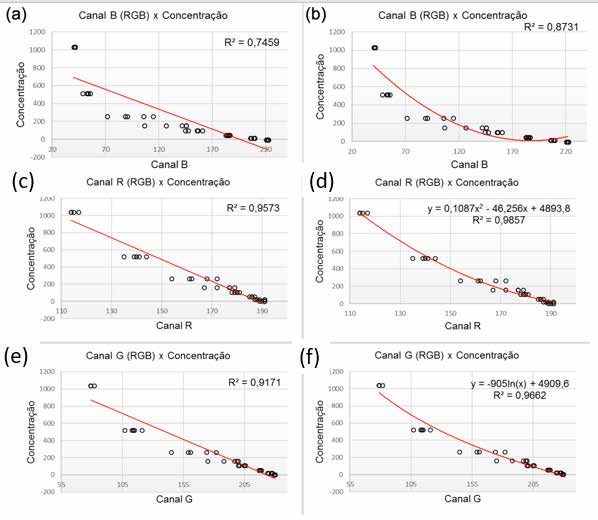
342    Biochemical semi-automated acoustics by Dipstick image processing based on arduino

INTRODUCTION                                                    bile phones and personal computers with cameras,
                                                                have addressed the problem in an alternative way and
      Urine is an interesting biological fluid in clinical      reported promising results15–17.
practice. The acquisition of a urine sample is a sim-                 Arduino is a hardware/software platform that
ple and non-invasive procedure. Through modern                  fits this profile. In fact, it is inexpensive; it has be-
laboratory techniques, it reveals essential informa-            come rapidly available and successfully employed in a
tion in the screening and monitoring of metabolic               wide variety of automation projects. Arduino is a type
disorders, liver alterations, kidney and urinary tract          of miniaturized computer in which the entire system
diseases, and other systemic conditions1–10. Owing              focuses solely on the process one wants to moni-
to these characteristics, urinalysis, covering physical,        tor (embedded system), based on Atmel microcon-
biochemical, cellular and sedimentary aspects, is well          trollers. Its architecture is modularized (shields) and
established as a routine test4–8,10,11.                         open source, with network shields, Bluetooth, glob-
      The biochemical features of urinalysis comprise           al positioning satellite, infrared, cameras, actuators,
the identification and quantification of a relatively           relays, pressure, temperature, humidity, acceleration
large set of different substances. For its implementa-          sensors and others, with great versatility to the plat-
tion in a practical and swift way, the essential charac-        form14,18.
teristics of screening tests require the use of urinalysis             Arduino-based devices may be implemented in
reagent strips (URSs)3,7,12. A test using URSs provides         independent and exclusive housings designed to take
in approximately two minutes an assessment of the               into account the requirements of each application.
sample´s glucose, ketone bodies, proteins, hemoglo-             This fact minimizes interferences, such as variations
bin, nitrites, bilirubin, urobilinogen, the presence of         in type and intensity of lighting, positioning, and dis-
leukocytes, pH and density4,6.                                  tance of the URS from the light source and color sen-
      A URS consists of a plastic rod to which small            sor, and the time and settings to capture the image.
spaced pads, impregnated with colorimetric reagents,            This characteristic provides an Arduino-based project
are attached. Each pad determines one of the test pa-           at an advantage over other approaches18,19.
rameters, reacting specifically with its target analyte               Current analysis develops and evaluates the
by a brief contact with the sample. The presence or             performance of an Arduino-based product for the
concentration of the analytes is expressed by a change          interpretation of URSs parameters. The system was
in color and variation in intensity. However, the               employed for the reading of glucose by a commercial
transformation of the colors into values or classes is          URS model.
mandatory for results. This is achieved by comparing
them with a series of references for the best combina-
tion5,6,10. Since the perception of colors by biological        METHODOLOGY
organisms is a phenomenon that is inherently subjec-
tive, inaccurate and potentially flawed, an automated                 The following steps were employed in the ex-
interpretation is preferable to a human one1,7,10,13.           periment. A device that registers the color of reactive
      Despite the great number of devices capable of in-        strips was built in a controlled environment. The de-
terpreting URSs, analytical routine implementations             vice, composed of 40 strips, was used to observe color
based on non-automated methods still persist5,8,10. This        change in a stratified sampling, and exposed to eight
fact, coupled to the growing popularization of com-             samples with spaced concentrations (standard sam-
puter technologies14, has probably contributed to a             ples). The correlation between the colors observed
relatively recent interest in the dissemination and             and the concentration in the samples was determined
diversification of methods for automated reading of             and a mathematical regression model was built. The
URS. Studies using everyday hardware, such as mo-               model was used to predict the concentration in a new

                                Saud Pesq, 2021 jan./mar.; 14(2):341-350 - e-ISSN 2176-9206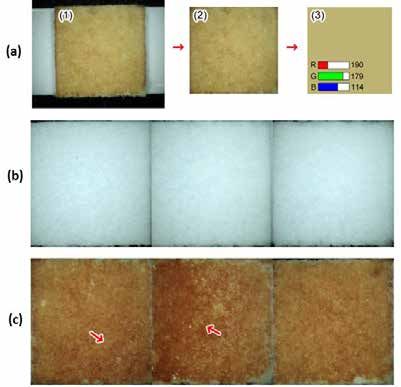
Teles, Teles, Silva, Pinheiro, Chen-Chen, Passos, Carneiro   343

stratified sampling, composed of 80 reactive strips,             the metallic ones were acquired from hardware stores.
exposed to 16 samples with random concentrations                 Electrical, electronic and mechanical components
(test samples).                                                  were acquired from shops specialized in embedded
                                                                 systems.
SAMPLE PREPARATION                                                     The housing´s upper region housed the central
                                                                 hardware, including the Arduino Mega 2560 (Figure
     All samples were produced artificially by diluting          1B), whilst its lower region sheltered the peripheral
glucose in a physiological saline solution. No biologi-          devices, including reading head and actuators (Fig-
cal material was used. After preparation, the solutions          ures 1C and 1D). A retractable tray received and se-
were immediately read by an automated analyzer,                  cured up to five reactive strips in pre-determined po-
model Labmax Plenno (Labtest Diagnóstica S.A.) to                sitions (Figures 1A and 1B).
determine and/or certificate analyte concentration.                    The reading head is programmed to move later-
     The concentrations of the standard samples                  ally (x-axis) to select the strip (Figure 1F) and longi-
were based on the rates of the reference tables of two           tudinally (y-axis) to centralize the target pad (Figure
brands of reactive strips. After analysis in Labmax, the         1C). Each shaft is operated independently by driver
concentrations were 0, 20, 51, 105, 158, 262, 518 and            module 4988 (Figure 1E) and stepper motor. A cam-
1036 mg/dL. The concentrations of test samples were              era module OV7670-AL422b 0.3 megapixel captured
determined at random, between the minimum and                    the images (Figure 1F) and four LEDs of high bright-
maximum rate detectable by the reactive strip used               ness, 30 mA white light, connected in parallel to a 3.3
in the experiment, taking into account low, medium               V voltage source, were used for lighting (Figure 1D).
and high concentrations. The concentrations of test                    During image capture, the camera remained mo-
                                                                 tionless at the center and above the target pad. Dis-
samples were 0, 38, 92, 159, 219, 300, 338, 418, 536,
                                                                 tance between the pad surface and the camera lens
588, 666, 678, 730, 808, 898 and 1022 mg/dL.
                                                                 and the illumination was 5 and 15 mm, respectively.
PREPARATION OF REACTIVE STRIPS

      The URICOLOR check reactive strip model
( Wama Diagnóstica) was used in the experiment due
to its accessibility and price. Each strip was handled
individually, following the manufacturer’s guidelines.
Color formation in the pads was stimulated by contact
with the samples for approximately 3 seconds. After
contact, the strips were kept horizontally, supported
on an absorbent paper, for another 20 seconds. They
were then immediately inserted onto a scanner tray.
Each image was captured automatically by the device
33 seconds after contact with the sample because of
its internal timer.

ASSEMBLY AND MOUNTING OF HARDWARE

     The housing of the system was designed with
SolidWorks software (Figure 1A). Whilst plastic parts
were made by additive manufacturing (3D printing),

                               Saud Pesq, 2021 jan./mar.; 14(2):341-350 - e-ISSN 2176-9206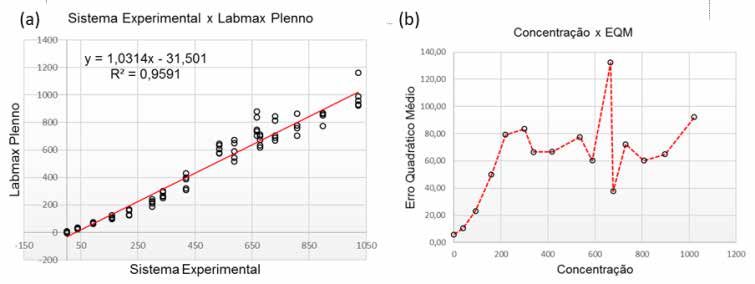
344 Biochemical semi-automated acoustics by Dipstick image processing based on arduino
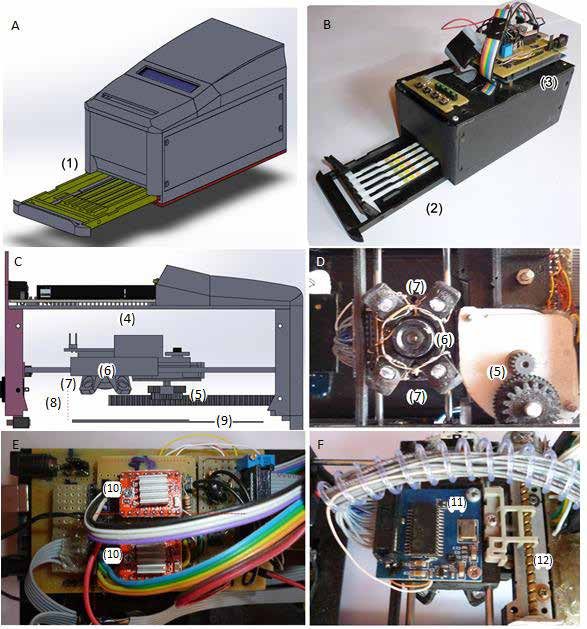
Figure 1. (A) Digital model; (B) Equipment built; (C) Digital model of the equipment in the right view plane with open side covers; (D)
Actual image, lower level with tray and lower lid removed; (E) Top view of central hardware; (F) Top view of the reading head. (1) Exten-
ded tray; (2) Strips positioned in the tray; (3) Central Hardware exposed; (4) Reading head; (5) Gears, rack, and motor for movement on
y-axis; (6) Camera lens; (7) LEDs; (8) Bay between the strip and the camera lens; (9) Reactive strip; (10) Driver A4988; (11) Module OV-
7670-AL422b; (12) Actuator of the x-axis.
DETERMINATION OF COLOR FORMED ON THE PAD CONSTRUCTION OF THE MODEL FOR QUANTITA-
TIVE PREDICTION
The glucose parameter pad, as the region of in-
terest, was employed in each captured image, while Data collected in the R, G, and B color chan-
the other areas were discarded. Thereafter, a single nels were tabulated together with the rates of their
color in RGB format (default OV7670-AL422b sensor) corresponding concentrations and processed with
Excel 2013, IBM SPSS 24, and MATLAB R2017a. The
was obtained from this region by calculating the arith-
relationship between each channel and the concen-
metic average of the colors in each pixel. The RGB
tration was determined by a bivariate analysis, using
format is composed of three independent color chan-
Pearson’s correlation coefficient. The channels with
nels: red, green and blue, represented by the letters the best coefficients were used for the construction
R, G, and B, respectively. Each color in this format of multiple linear regression and nonlinear regression
is produced/represented by a specific combination models. The suitability of each model was assessed by
of intensities in these channels, ranging between 0 means of the coefficient of determination (R2). The
and 100% (0 to 255) (Figure 2a). best adjusted equations were used for the construc-
tion of the final mathematical model, employed to re-
Saud Pesq, 2021 jan./mar.; 14(2):341-350 - e-ISSN 2176-9206Teles, Teles, Silva, Pinheiro, Chen-Chen, Passos, Carneiro 345
cover the rate (quantitative) of the concentration for converted into qualitative data, was determined by
each sample test, by entering the data of RGB colors. Spearman’s correlation coefficient and by the percent-
age of equivalent classifications, strictly equal to and/
PRODUCTION OF QUALITATIVE RESULTS (CLASSIFI- or with a tolerance of one level of difference.
CATION) The experimental system was internally evaluat-
ed by coefficient of variation (CV ) for each sample an-
Quantitative results (continuous quantitative alyzed, in five replicates, and by general mean square
variable) measured by both systems (experimental error (MSE). The Excel program was used for plotting
and Labmax Plenno) were converted into qualitative and analyzing the data.
(ordinal qualitative variable) by classifying them at six
levels: 0 ([0, 20[), 20 ([20, 100[), 100 ([100, 250[),
250 ([250, 500[) , 500 ([500, 1000[) and 1000 (rate RESULTS
>= 1000) mg/dL. These classes were defined accord-
ing to classification established by the manufacturer VISUAL INSPECTION OF THE REACTIVE STRIPS AND
of the reactive strip, while class 20 was added for pos- ASPECT OF THE IMAGES
sible comparisons with other reactive strip models.
During the positioning of the strips on the
EVALUATION OF PERFORMANCE equipment (properly prepared), several strips re-
vealed sharp differences in the shades of color for the
The concordance between the quantitative re- same sample. Such behavior, more evident in strips
sults produced by the experimental system and Lab- exposed to higher concentrations, was confirmed by
max Plenno was determined by Pearson’s correlation the captured images (Figures 2b and 2c).
coefficient. The concordance between the results,
Figure 2. (a) Representation of the processing for the extraction of a single color: (1) Raw image, (2) Delimited and clipped region of
interest, (3) Average color in RGB format and end processing result; (b) Three clippings originated from the sample with 0 mg/dL, showing
homogeneous coloration internally and between peers; (c) Three clippings originated from the sample with 730 mg/dL, presenting peri-
pheral regions or hemispheres in darker hues (red arrows).
Saud Pesq, 2021 jan./mar.; 14(2):341-350 - e-ISSN 2176-9206346 Biochemical semi-automated acoustics by Dipstick image processing based on arduino
CORRELATIONS, REGRESSIONS AND MODEL distribution patterns for all channels, with better index-
CONSTRUCTION es for R and G. Hence, the final model was constructed
by considering a combination of curves at the expense
Although the bivariate analysis between R, G, of multiple linear regressions, which are second-degree
and B channels and the concentration of the standard polynomial regressions for R channel and logarithmic
samples (N = 40) pointed to very clear relations, the for G channel (Figures 3a-d). The data of channel B
analysis of the dispersion graphs revealed nonlinear were not taken into account (Figures 3e and 3f ).
Figure 3. Scatter plots between channel B of the RGB core space and the concentration:(a) Linear adjustment of the R channel, (b) Polyno-
mial adjustment of the R channel, (c) Linear adjustment of the G channel, (d) Logarithmic adjustment of the G channel; (e) Linear adjust-
ment, (f) Polynomial adjustment.
SYSTEM TEST
The quantitative prediction of concentrations in
the test samples (n=80) yielded a minimum CV of
4.5%, a maximum CV of 16.6% (Table 1) and an MSE
of 68.7 mg/dL. Figure 4a shows concentration-depen-
dent MSE variation. Pearson’s correlation coefficient
(r) between these results and those produced by the
Labmax Plenno analyzer was 0.979 (pTeles, Teles, Silva, Pinheiro, Chen-Chen, Passos, Carneiro 347
Figure 4. (a) Graph showing the variation of the mean square error with concentration; (b) Dispersion graph of the quantitative results of
the experimental system and those obtained by the Labmax Plenno analyzer.
Table 1. Coefficients of variation, in percentage, by concentration ranges
Concentration ranges (mg/dL)
Low Average High
(0 to 332) (333 to 666) (667 to 1050)
Lowest 6.0 5.4 4.5
CV (%) Average 11.2 9.6 7.7
Highest 16.6 13.8 10.7
Concordance of qualitative results between mediately adjacent (Table 2). Therefore, concordance
the systems was 86%, or rather, 69 classifications reached 100% when the criterion of tolerance of one
were concordant and 11 were divergent. No classifi- level of difference was applied. Spearman’s correla-
cation displayed a distance beyond one level. In other tion coefficient (rho) between the two systems was
words, when not identical, the classifications were im- 0.971 (p348 Biochemical semi-automated acoustics by Dipstick image processing based on arduino
DISCUSSION into account the validity of the samples used in the
experiment, real urine samples may display intense
Results in current analysis demonstrated that an color variations owing to the presence of abnormal
Arduino-based system is sufficiently sensitive to detect substances4. Therefore, applications in laboratory
and distinguish color variations in the reactive strips. routine depend on maintaining satisfactory results
The predictions generated by the implemented mod- even in adverse conditions. It is reasonable to assume
el correlate satisfactorily with the results produced that the commercial devices, mentioned above, also
by the reference method (r=0.979 and rho=0.971) underwent rigorous evaluations.
and with statistical significance (pTeles, Teles, Silva, Pinheiro, Chen-Chen, Passos, Carneiro 349
CONCLUSION 4. Lee W, Kim Y, Chang S, Lee AJ, Jeon CH. The
influence of vitamin C on the urine dipstick tests
The system was built and operated in accordance in the clinical specimens: a multicenter study. J
Clin Lab Anal. 2017;31(5):1-6.
with the expected performance and produced results
compatible with commercial systems. Hardware sen- 5. Dolscheid-Pommerich RC, Kiarmann-Schuiz U,
sitivity is sufficient for this type of application. The ac- Conrad R, Stoffel-Wagner B, Zur B. Evaluation of
quisition of hardware, software and support libraries the appropriate time period between sampling
and analyzing for automated urinalysis. Biochem
was simple, practical and low cost. Full achievement Medica. 2016;26(1):82-9.
of the goals set forth herein reaffirms the value of this
remarkable platform. 6. Eriksen SV, Sykepleier A Geriatrisk, Østfold S.
However, results recommend further studies, Can we trust urine dipsticks? Forskning. 2016;2-
15.
either by extending the method to other parameters
of the strip, or by evaluating the system in real urine 7. Ko K, Kwon MJ, Ryu S, Woo HY, Park H. Per-
samples, or by evaluating the applicability to other formance Evaluation of Three URISCAN De-
classes of reactive strips. vices for Routine Urinalysis. J Clin Lab Anal.
2016;30(5):424-30.
8. Khejonnit V, Pratumvinit B, Reesukumal K,
FUNDING SOURCES Meepanya S, Pattanavin C, Wongkrajang P. Opti-
mal criteria for microscopic review of urinalysis
Current research did not receive any specific following use of automated urine analyzer. Clin
Chim Acta. 2015;439:1-4.
grant from funding agencies in the public, commer-
cial, or non-profit sectors. 9. Walta AM, Keltanen T, Lindroos K, Sajantila A.
The usefulness of point-of-care (POC) tests in
screening elevated glucose and ketone body lev-
els postmortem. Forensic Sci Int. 2016;266:299-
CONFLICTS OF INTEREST 303.
The authors declare no conflict of interest. 10. Van Delft S, Goedhart A, Spigt M, Van Pinxteren
B, De Wit N, Hopstaken R. Prospective, obser-
vational study comparing automated and visual
point-of-care urinalysis in general practice. BMJ
REFERENCES Open. 2016;6(8):1-8.
1. Ercan M, Oǧuz EF, Kaya O, Yilmaz FM. Evaluation 11. Delanghe JR, Speeckaert MM. Preanalytics in uri-
of H-800/FUS-100 automatic urine analyzer per- nalysis. Clin Biochem. 2016;49(18):1346-50.
formance. Turkish J Biochem. 2018;43(1):89-92.
12. Lim S, Yu HJ, Lee S, Park H, Kwon MJ, Woo HY.
2. Khan LB, Read HM, Ritchie SR, Proft T. Artificial Evaluation of the URISCAN 2 ACR Strip to esti-
Urine for Teaching Urinalysis Concepts and Di- mate the urine albumin/creatinine ratios. J Clin
agnosis of Urinary Tract Infection in the Medi- Lab Anal. 2018;32(3):6-11.
cal Microbiology Laboratory †. J Microbiol Biol
Educ. 2017;18(2):1-6. 13. Asano Y, Fairchild MD, Blondé L. Individu-
al colorimetric observer model. PLoS One.
3. Ince FD, Ellidağ HY, Koseoğlu M, Şimşek N, 2016;11(2):1-19.
Yalçin H, Zengin MO. The comparison of auto-
mated urine analyzers with manual microscop- 14. Mittal S. A survey of techniques for improving en-
ic examination for urinalysis automated urine ergy efficiency in embedded computing systems.
Int J Comput Aided Eng Technol. 2014;6(4):440-
analyzers and manual urinalysis. Pract Lab Med.
59.
2016;5:14-20.
Saud Pesq, 2021 jan./mar.; 14(2):341-350 - e-ISSN 2176-9206350 Biochemical semi-automated acoustics by Dipstick image processing based on arduino
15. Konnaiyan KR, Cheemalapati S, Gubanov M,
Pyayt A. MHealth Dipstick Analyzer for Monitor-
ing of Pregnancy Complications. IEEE Sens J.
2017;17(22):7311-6.
16. Jalal Uddin M, Jin GJ, Shim JS. Paper-Plastic Hy-
brid Microfluidic Device for Smartphone-Based
Colorimetric Analysis of Urine. Anal Chem.
2017;89:13160-6.
17. Valenzuela I, Amado T, Orillo JW. Urine test strip
analysis using image processing for mobile appli-
cation. J Teknol. 2016;78(5-7):93-9.
18. Martínez-Santos JC, Acevedo-Patino O, Con-
treras-Ortiz SH. Influence of Arduino on the
Development of Advanced Microcontrollers
Courses. Rev Iberoam Tecnol del Aprendiz.
2017;12(4):208-17.
19. Luo MR, Cui G, Georgoula M. Colour difference
evaluation for white light sources. Light Res
Technol. 2015;47(3):360-9.
20. Mukaka MM. Statistics Corner: A guide to appro-
priate use of Correlation coefficient in medical
research. Malawi Med J. 2012;24(3):69-71.
21. Bekhof J, Kollen BJ, Van De Leur S, Kok JH, Van
Straaten IHLM. Reliability of reagent strips for
semi-quantitative measurement of glucosuria in
a neonatal intensive care setting. Pediatr Neona-
tol. 2014;55(6):444-8.
22. Chien TI, Lu JY, Kao JT, Lee TF, Ho SY, Chang CY,
et al. Comparison of three automated urinalysis
systems-Bayer Clinitek Atlas, Roche Urisys 2400
and Arkray Aution Max for testing urine chemis-
try and detection of bacteriuria. Clin Chim Acta.
2007;377(1-2):98-102.
Saud Pesq, 2021 jan./mar.; 14(2):341-350 - e-ISSN 2176-9206You can also read