BNT162b2 vaccine booster dose protection: A nationwide study from Israel
←
→
Page content transcription
If your browser does not render page correctly, please read the page content below
BNT162b2 vaccine booster dose protection: A
nationwide study from Israel
Yinon M. Bar-OnϮ1, Yair GoldbergϮ2*, Micha MandelϮ3, Omri Bodenheimer4, Laurence
Freedman5, Nir Kalkstein6, Barak Mizrahi6, Sharon Alroy-Preis4, Nachman Ash4, Ron
Milo&1, Amit Huppert&5,7

27/8/2021

1
    Weizmann Institute of Science, Israel
2
    Technion - Israel Institute of Technology, Israel
3
    The Hebrew University of Jerusalem, Israel
4
    Israel Ministry of Health, Israel
5
    The Gertner Institute for Epidemiology & Health Policy Research, Sheba Medical Center, Israel
6
    KI Research Institute, Kfar Malal, Israel

7
    Tel Aviv University, Israel

Ϯ
    Contributed equally.
&
    Contributed equally.

*corresponding author

email: yairgo@technion.ac.il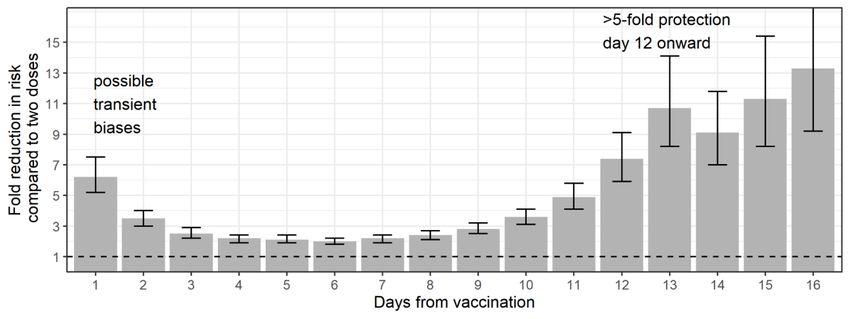
Abstract

Background: On July 30, 2021, a third (booster) dose of the Pfizer BNT162b2 vaccine was
approved in Israel for individuals 60 years or older who had been fully vaccinated (i.e., received
two doses) at least five months previously. Here, we estimate the reduction in relative risk for
confirmed infection and severe COVID-19 provided by the booster dose.

Methods: 1,144,690 individuals aged 60y and older who were eligible for a booster dose were
followed between July 30 and August 22, 2021. We defined dynamic cohorts where individuals
initially belong to the ‘non-booster’ cohort, leave it when receiving the booster dose and join
the ‘booster’ cohort 12 days later. Rates of infection and severe COVID-19 outcomes per
person-days at risk were compared between the cohorts using Poisson regression, adjusting
for possible confounding factors.

Results: Twelve days or more after the booster dose we found an 11.4-fold (95% CI: [10.0,
12.9]) decrease in the relative risk of confirmed infection, and a >10-fold decrease in the
relative risk of severe illness. Under a conservative sensitivity analysis, we find ≈5-fold
protection against confirmed infection.

Conclusions: In conjunction with safety reports, this study demonstrates the effectiveness of a
third vaccine dose in both reducing transmission and severe disease and indicates the great
potential of curtailing the Delta variant resurgence by administering booster shots.

                                                2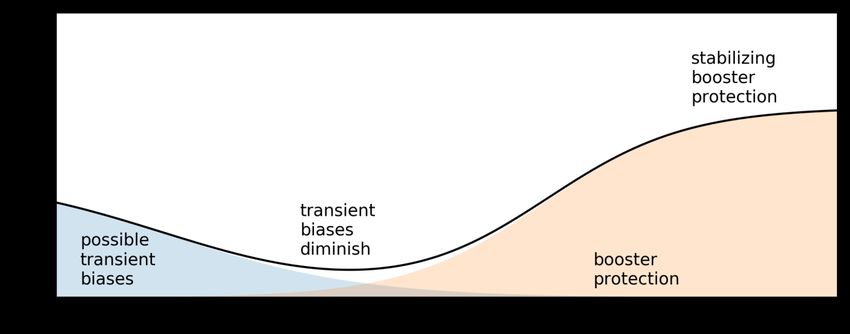
Introduction
The rapid development of effective vaccines against SARS-CoV-2 and their deployment to the
general population has been proven to be a highly successful strategy for reducing
transmission and disease burden. In Israel, a swift vaccination campaign led to more than half
of the population being fully vaccinated by the end of March 2021 1. Consequently, COVID-19
incidence dropped from ≈900 cases per million per day in mid-January 2021 to less than 2
cases per million per day by June 2021 1. Nevertheless, the emergence of new variants of
concern (VOC), and specifically the Delta variant, has led to a recent infection resurgence in
Israel both in infection and severe disease 2. There are several possible causes for the high
levels of transmission of the Delta variant, including increased infectiousness of the Delta
variant 3, waning vaccine-elicited immunity 2,4, and heightened immune evasion by the variant 5,
the latter two of which directly contribute to a decrease in vaccine efficacy. Analysis of the
Israeli data on the Delta outbreak indicated strong waning immunity. In an effort to address the
challenge presented by the Delta variant and reduce the load on the healthcare system, Israeli
authorities approved the administration of a booster dose, first to high-risk populations, on July
12, 2021, and then to the entire 60+ population, on July 30, 2021.

Initial studies have suggested that a BNT162b2 booster dose, i.e., an additional dose given to
individuals who have previously received two BNT162b2 vaccine doses, increases antibody
neutralization levels ~10-fold, on average, compared to levels achieved after the second dose
6
 . It is thought that an increased neutralization titer could lead to increased protection against
infection and severe illness 7. However, in terms of real-world efficacy, the size of such an
effect remains unclear. Here, we use initial data from the Israeli Ministry of Health (MOH)
database on the incidence of confirmed infection and severe illness among two cohorts of
individuals above 60 years of age: those who received only two vaccine doses, and those who
received an additional booster dose. We use the data to quantify the protective effect that the
booster dose provides against confirmed infection and severe illness.

The protection gained by the booster shot is not expected to reach its maximal capacity
immediately on vaccination, but to build up over the week following vaccination 8,9. At the same
time, during the first days after vaccination, significant behavioral changes in the booster-
vaccinated population are expected (Figure S1 in the Supplementary Appendix). One such
expected change is added avoidance of exposure to excess risk until the booster dose
becomes effective. Another expected change is a reduced rate of testing for COVID-19 around
the time of receiving the booster, as demonstrated in Figure S2 (Supplementary Appendix).
Moreover, we analyzed confirmed COVID-19 infections based on the date of the positive PCR
test, and testing occurs only several days following exposure. For all these reasons, it is
preferable to assess the effect of the booster only after a sufficient period has passed since its
administration.

                                                3
Methods Our analysis is based on medical data from the MOH database extracted on August 24, 2021. There were 1,186,780 Israeli residents aged 60 and older who had been fully vaccinated at least five months (became fully vaccinated before March 1, 2021), and were still alive on July 30, 2021. We removed from these data individuals who: had missing gender; were abroad in August 2021; had been infected with COVID-19 before July 30, 2021; received a booster dose before July 30, 2021; or became fully vaccinated before January 16. A total of 1,144,690 individuals met the inclusion criteria for the analysis (see Figure 1). The data included vaccination dates (first, second and third doses), RT-qPCR tests (dates and results), COVID-19 hospitalization date (if relevant), demographic variables such as age, gender, and demographic group (General Jewish, Arab, ultra-Orthodox Jewish) 10, and clinical status (mild, severe). Severe disease was defined as: resting respiratory rate >30 breaths per minute, or oxygen saturation on room air
occurrence of an outcome, the end of the study period, or when receiving a booster dose.
Since cohort membership was dynamic, many individuals contributed person-days at risk to
both cohorts.

We fitted a Poisson regression (using the glm function in the R Statistical Software)14 to
estimate the incidence rate of a specific outcome, controlling for several important covariates:
age (60-69, 70-79, 80+), gender, demographic group (General Jewish, Arab, ultra-Orthodox
Jewish) 10, and date of second vaccine dose (in half-month intervals). Since the overall
incidence rate of both confirmed infection and severe COVID-19 increased exponentially
during the study period, days at the beginning of the study period had lower exposure risk than
days at the end. To account for growing exposure risk, we included calendar date as an
additional covariate. Accounting for these covariates, we used the study cohort (‘booster’ or
‘no-booster’) as a factor in the regression and estimated its impact on the incidence rate. The
effect of the booster dose is estimated as one divided by the exponent of the regression
coefficient associated with the treatment cohort, which is akin to a relative risk. For reporting
uncertainty around our estimate, we used the exponent of the 95% confidence limits for the
regression coefficient.

As a sensitivity analysis, we compared infection rates before and after the booster dose
became effective. Specifically, we repeated the Poisson regression analysis described above
but compared infection rates on days 4-6 to 12+ after the booster dose. Our hypothesis was
that the booster dose was not yet effective during the former period 8. This analysis compares
different periods following booster vaccination based only on those who received the booster
dose, and may reduce selection bias. On the other hand, people might perform less PCR
testing and behave more cautiously with regard to virus exposure just after getting the booster
vaccination (Figure S2), so we conjecture that the protection effect is underestimated in this
analysis, providing a lower bound to the real effect.

To further examine the protection as a function of time from the booster dose, we fitted a
Poisson regression comparing the ‘booster’ and ‘no-booster’ cohorts as above, while including
each day, from day 1 up to day 24 after the booster vaccination, as a separate factor in the
model. The period before receiving the booster dose (‘no-booster’ cohort) was used as the
reference category. The analysis is similar to the Poisson modeling described above, with one
divided by the exponents of the regression coefficients representing the protection on different
days post the booster vaccination. The follow-up time for this analysis started on July 30,
2021, and ended on August 22, 2021.

As further sensitivity analyses, we applied two methods based on case-control matching. The
first method was similar to that used by Dagan et. al15. Each person who received the booster
was matched, using the same covariates as used in the Poisson regression model, to a person

                                               5
who had not yet received it on that date. We compared the probabilities of COVID-19 infection
12 days or more after the matching time of those receiving the booster dose and those who
did not. In the second method, we matched person-days rather than individuals, ensuring that
person-days in the two cohorts are comparable in terms of covariates and exposure risk. On
each day we identified the group of individuals for whom 12 days or more had passed since
receiving the booster dose and who had not been infected in the interim (‘booster’ cohort). We
randomly matched a day of a ‘no-booster’ individual from those who had received only two
vaccine doses by that same date, had not been previously infected, and had the same
characteristics (age, gender, second vaccination period, and demographic group). We then
calculated the risk ratio of infection and severe COVID-19 between the two groups. A detailed
description of both approaches is given in Supplementary Methods 1 in the Supplementary
Appendix.
Results
The baseline characteristics of both cohorts are shown in Table 1. As our primary analysis
adjusts for person-days at risk, and since individuals contribute days to both cohorts, we
compare characteristics according to person-days at risk. There are about 4.0 million person-
days in the ‘no-booster’ cohort with 3,473 confirmed infections and 330 cases of severe
COVID-19, and about 3.4 million person-days in the ‘booster’ cohort with 313 confirmed
infections and 32 cases of severe COVID-19. The ‘booster’ cohort tends to have more men
(50% vs 43%), more general Jewish people (93% vs 82%), more older people (60% vs 47%
aged 70+ years), and people who were vaccinated earlier (79% vs 40% vaccinated in January).
These significant differences are adjusted for when estimating protection.
The full Poisson regression analysis for confirmed infection is given in Table S1 of the
Supplementary Appendix, and the results for the booster dose protection are summarized in
Table 2. The booster dose provides significant protection – an estimate of 11.4-fold (95% CI:
[10, 12.9]) decrease in the relative risk of a confirmed infection. In the Supplementary
Appendix, we provide the results of alternative analyses using matching techniques. The first
analysis, following Dagan et. al.15, resulted in a higher estimate of the decrease in relative risk
of 13.4 (95% CI: [8.2-21.4]) and the second, relying on matching by days, gave a slightly
smaller estimate for the decrease in the relative risk of 9.6 (95% CI: [8.1, 11.4]).
The sensitivity analysis that compared the risk of infections during 12+ days after booster to 4-
6 days after booster, gave a decrease in relative risk of 4.7 (95% CI: [4, 5.4]), about half of that
in the main analysis.
The protection conferred by the booster dose against severe disease also appeared high. For
people with a more-than-12-days lag between the booster vaccination and severe illness, we
6found that the booster dose decreases the relative risk of severe disease by 15.5-fold (95% CI:
[10.5, 22.8]). We validated our results using the matching-by-day analysis that gave 9.5-fold
protection against severe illness (95% CI [5-19.6]).
Figure 2 presents the results of the Poisson regression analysis with the number of days after
booster vaccination as additional covariates, demonstrating the protection as a function of time
from the booster vaccination. After about 12 days, protection starts stabilizing at about 10-12
fold reduction in risk in line with the results presented above. As shown in Figure 2, there is an
apparent protection for the booster-vaccinated group in the first days following vaccination.
This apparent protection (i.e., days 1-4) is likely the result of the aforementioned behavioral
changes that follow vaccination. As the time since vaccination progresses, the magnitude of
this apparent protection decreases, indicating that the effect of behavioral change decreases.
Levels of protection appear to start increasing again from day 7 post vaccination. As shown in
Figure S4 these results are robust across different study periods.
Discussion
Our analysis shows that the booster dose of the BNT162b2 vaccine is highly effective in
reducing the risk of both confirmed infection and severe illness. For example, if the combined
effect of waning immunity and the Delta variant decrease the efficacy of a vaccine given >6
months ago against infection to ≈50%, as recent reports have suggested 16,17, and if the
booster dose reduces the relative risk by 10-fold, it means that the probability of a booster-
vaccinated individual to being susceptible to infection would decrease to ≈5% (=50%/10)
relative to unvaccinated individuals. This brings vaccine efficacy for booster-vaccinated
individuals to ≈95%, similar to the original “fresh” vaccine efficacy reported against the Alpha
strain 11,15.
On average, severe illness develops ≈5 days after the first positive-sample date (Figure S5 in
the Supplementary Appendix). Thus, the follow-up period in our data is short and confidence
intervals for protection against severe disease are wide. Moreover, some individuals from the
booster cohort for severe illness were likely infected prior to or immediately after receiving the
booster, and this could lead to an underestimate in the inferred protection against severe
illness.
While our analysis attempts to address possible biases in the source data, such as the effects
of confounders and behavioral changes following vaccination, there are some sources of bias
that we may not correct adequately. These include differences between those receiving and
not receiving the booster in care-seeking behaviors and cautiousness, and in comorbidities.
Some of these possible biases are transient and fade with time since the booster vaccination,
as schematically shown in Figure S1 in the Supplementary Appendix, implying that the real
7effectiveness of vaccination can be estimated when comparing infection rates before receiving
the booster dose and after enough time has elapsed (e.g. after 12 days, Figure S1 in the
Supplementary Appendix). While independent research is required in order to fully understand
this behavioral model, several indications suggest that our 12 days cutoff is reasonable. First,
as shown in Figure S2 in the Supplementary Appendix, people tend to perform fewer PCR
tests a few days before and after the vaccination day, which is a clear source for detection
bias. Over time, the number of tests that vaccinated individuals perform increases, which
reduces this bias. Consistent with such behavioral change is the pattern in Figure 2, which
shows a large reduction in infection risk on the first day after vaccination that monotonically
decreases during the first few days, before starting to increase as the booster dose becomes
effective.
Yet, confounding biases may still explain part of the observed effectiveness, and these may not
disappear over time. We can put a crude lower bound on the booster efficacy by looking at
time points at which the booster efficacy is not expected to be significant and behavioral
differences are smaller, e.g. days 4-6 after the booster dose, and attributing the whole
observed effectiveness to confounding bias. Our sensitivity analysis compared the cohort of
booster-vaccinated individuals 12+ days after receiving the booster dose to the same group at
days 4-6, when the booster effect is expected to be only minimally translated into a reduction
in confirmed infections (Figure 2). This analysis yielded an estimate of 4.7-fold (95% CI [4.0,
5.4]) protection against confirmed infection. Even under this conservative interpretation, the
demonstrated protection highlights the important role that a booster dose could play in
mitigating the effects of waning immunity and immune evasion, and in mitigating the spread of
VOC such as the Delta variant.
There are significant behavioral differences between the main demographic groups in Israel.
Table 1 shows that the ‘booster’ cohort is highly biased toward the general Jewish population;
93% vs 82% in the ‘no-booster’ cohort. This may be a source of a selection bias that is not fully
accounted for in the main analysis. We, therefore, repeated the analysis for the subset of people
from the general Jewish sector. The results of the Poisson analysis were very similar to those
shown in Table 2, with protection against confirmed infection of 10.9 (95% CI [9.6, 12.4]). This
validates the ≈10-fold protection against infection findings of the main analysis.
Understanding the protection gained by a booster dose is critical for policy making. On July 30,
2021, Israel was the first country in the world to make available a third dose of Pfizer BNT162b2
vaccine against COVID-19 to all people aged 60 or over who had been vaccinated at least five
months previously. The results of such a policy are of importance for countries that seek
strategies to mitigate the pandemic. Our findings give clear indications of the effectiveness of a
booster dose even against the currently dominant Delta variant.
8References
1. Hannah Ritchie, D. B., Edouard Mathieu, Lucas Rodés-Guirao, Cameron Appel, Charlie
Giattino, Esteban Ortiz-Ospina, Joe Hasell, Bobbie Macdonald & Roser, M. Coronavirus
Pandemic (COVID-19). Our World Data (2020).
2. Goldberg, Y. et al. Waning immunity of the BNT162b2 vaccine: A nationwide study from
Israel.
3. Investigation of SARS-CoV-2 variants of concern: technical briefings. GOV.UK
https://www.gov.uk/government/publications/investigation-of-novel-sars-cov-2-variant-
variant-of-concern-20201201.
4. Mizrahi, B. et al. Correlation of SARS-CoV-2 Breakthrough Infections to Time-from-vaccine;
Preliminary Study. 2021.07.29.21261317
https://www.medrxiv.org/content/10.1101/2021.07.29.21261317v1 (2021)
doi:10.1101/2021.07.29.21261317.
5. Wall, E. C. et al. Neutralising antibody activity against SARS-CoV-2 VOCs B.1.617.2 and
B.1.351 by BNT162b2 vaccination. The Lancet 397, 2331–2333 (2021).
6. Pfizer Inc. - Pfizer Quarterly Corporate Performance – Second Quarter 2021.
https://investors.pfizer.com/events-and-presentations/event-details/2021/Pfizer-Quarterly-
Corporate-Performance--Second-Quarter-2021/default.aspx.
7. Khoury, D. S. et al. Neutralizing antibody levels are highly predictive of immune protection
from symptomatic SARS-CoV-2 infection. Nat. Med. 27, 1205–1211 (2021).
8. Lustig, Y. et al. BNT162b2 COVID-19 vaccine and correlates of humoral immune responses
and dynamics: a prospective, single-centre, longitudinal cohort study in health-care workers.
Lancet Respir. Med. 0, (2021).
9. Walsh, E. E. et al. Safety and Immunogenicity of Two RNA-Based Covid-19 Vaccine
9Candidates. N. Engl. J. Med. 383, 2439–2450 (2020).
10. Muhsen, K. et al. A nationwide analysis of population group differences in the COVID-19
epidemic in Israel, February 2020-February 2021. Lancet Reg. Health Eur. 7, 100130
(2021).
11. Haas, E. J. et al. Impact and effectiveness of mRNA BNT162b2 vaccine against SARS-
CoV-2 infections and COVID-19 cases, hospitalisations, and deaths following a nationwide
vaccination campaign in Israel: an observational study using national surveillance data. The
Lancet 397, 1819–1829 (2021).
12. McAloon, C. et al. Incubation period of COVID-19: a rapid systematic review and meta-
analysis of observational research. BMJ Open 10, e039652 (2020).
13. Xin, H. et al. The Incubation Period Distribution of Coronavirus Disease 2019: A Systematic
Review and Meta-analysis. Clin. Infect. Dis. (2021) doi:10.1093/cid/ciab501.
14. R Core Team. R: A Language and Environment for Statistical Computing. (R Foundation for
Statistical Computing, 2020).
15. Dagan, N. et al. BNT162b2 mRNA Covid-19 Vaccine in a Nationwide Mass Vaccination
Setting. N. Engl. J. Med. 384, 1412–1423 (2021).
16. Puranik, A. et al. Comparison of two highly-effective mRNA vaccines for COVID-19 during
periods of Alpha and Delta variant prevalence. 2021.08.06.21261707
https://www.medrxiv.org/content/10.1101/2021.08.06.21261707v2 (2021)
doi:10.1101/2021.08.06.21261707.
17. Tang, P. et al. BNT162b2 and mRNA-1273 COVID-19 vaccine effectiveness against the
Delta (B.1.617.2) variant in Qatar. 2021.08.11.21261885
https://www.medrxiv.org/content/10.1101/2021.08.11.21261885v1 (2021)
doi:10.1101/2021.08.11.21261885.
10Ethics statement
The study was approved by the Institutional Review Board of the Sheba Medical Center. Helsinki
approval number: SMC-8228-21.
Competing interests statement
All authors declare no competing interests.
Funding
None.
Data sharing
11Table 1: Demographic and clinical characteristics of the study population for the two study cohorts.
Since the cohorts are dynamic and individuals can contribute to both cohorts, the table presents the
number of person-days at risk instead of the number of individuals.
2nd dose only (“no- 12+ days from 3rd dose
booster” cohort) (“booster” cohort)
Person-days at risk 4,018,929 3,351,598
Confirmed Infections 3,473 313
Severe COVID-19 330 32
Gender = male (%) 1,712,000 (43%) 1,681,085 (50%)
Sector (% of person-days at risk)
General Jewish 3,318,512 (82%) 3,127,545 (93%)
Arab 514,357 (13%) 114,671 (3%)
Orthodox Jews 186,060 (5%) 109,382 (3%)
Age category (% of person-days at risk)
60-69 2,138,861 (53%) 1,353,160 (40%)
70-79 1,173,437 (29%) 1,341,000 (40%)
80+ 706,631 (18%) 657,438 (20%)
2nd vaccination period (% of person-days at risk)
Jan, 16-31 1,613,977 (40%) 2,664,230 (79%)
Feb, 1-15 1,849,978 (46%) 634,870 (19%)
12Feb, 16-28 554,974 (14%) 52,498 (2%)
13Table 2. Summary of the results of the Poisson regression analysis for different cohorts: people who
received only two vaccine doses and people for whom 12 days or more have passed since their booster
dose. For each group, we provide the total number of person-days at risk for each cohort, the number of
confirmed infections and severe COVID-19 in each cohort, and the estimated protection of the booster
against confirmed infection and severe illness, given as a fold change in relative risk.
Estimated booster protection (95% CI)
Cohort Person-days Confirmed Severe
at risk infections COVID-19 Against confirmed Against severe
infection illness
2 doses only 4,018,929 3,473 330 1 1
(“no-booster”
cohort)
12+ days 3,351,598 313 32 11.4 [10, 12.9] 15.5 [10.5, 22.8]
from 3rd dose
(“booster”
cohort)
14Figure 1. Study population. The population includes people who were fully vaccinated prior to March 1,
2021, were not abroad during August 2021, and had no documented SARS-CoV-2 PCR-positive result
before July 30, 2021.
15Figure 2. Booster protection against confirmed infection as a function of the number of days following
the booster dose. Because of wide confidence intervals, only days 1-16 are shown. Protection is given as
a fold reduction in risk relative to people who received only two vaccine doses. Data is based on about 1
million individuals aged 60 or older, who received the 3rd dose boost. The dashed line represents no
added protection by the booster dose.
16Supplementary Appendix
BNT162b2 vaccine booster dose protection: A
nationwide study from Israel
Yinon M. Bar-OnϮ1, Yair GoldbergϮ2*, Micha MandelϮ3, Omri Bodenheimer4, Laurence
Freedman5, Nir Kalkstein6, Barak Mizrahi6, Sharon Alroy-Preis4, Nachman Ash4, Ron
Milo&1, Amit Huppert&5,7
1
Weizmann Institute of Science, Israel
2
Technion - Israel Institute of Technology, Israel
3
The Hebrew University of Jerusalem, Israel
4
Israel Ministry of Health, Israel
5
The Gertner Institute for Epidemiology & Health Policy Research, Sheba Medical Center, Israel
6
KI Research Institute, Kfar Malal, Israel
7
Tel Aviv University, Israel
Ϯ
Contributed equally.
&
Contributed equally.
*corresponding author
email: yairgo@technion.ac.il
17Supplementary Methods 1 - matching approaches
In order to validate our findings, we conducted two independent secondary analyses which rely
on matching fully vaccinated individuals who received a booster dose with similar individuals
who received only two vaccine doses.
The first matching approach was similar to that conducted by Dagan et.al.15. Briefly, each
individual in the ‘booster’ cohort was matched to an individual who was in the ‘no-booster’
cohort on the booster-vaccination day based on the following characteristics: age group - (60-
69,70-79 and 80+), gender, second vaccine dose week and demographic group (General
Jewish, Arab, ultra-Orthodox). Follow-up for both individuals ended at the time of infection.
Both individuals in a pair were censored at the end of the study or at the time the ‘no-booster’
individual got a booster dose. We calculated the probability of being free of infection in the two
cohorts as a function of time using the Kaplan-Meier estimator, and compared the survival
probabilities of the two cohorts at the end of the study. For each cohort, we calculated the
probability of an event occurring between day 12 following the boost and the end of the study,
among individuals still at risk on day 12. We used the ratio between the probabilities of the two
cohorts as an estimate for the risk ratio for our population over the study time. We generated
95% confidence intervals around this estimate using the percentile bootstrap method with 100
repetitions.
A second approach matched days rather than individuals, ensuring that days in the two
cohorts are comparable. Matching was performed as follows: on each day in the study period,
we identified the group of individuals for whom 12 days or more passed since their booster
dose (or 10 days for the severe illness analysis), and who were not previously infected
(‘booster’ cohort). We randomly matched a ‘no-booster’ individual from those who received
only two vaccine doses (by that same day), was not previously infected, and had the same
characteristics (age group in five year window, gender, second vaccine dose week and
demographic group: General Jewish, Arab, ultra-Orthodox). In order to be able to match all
individuals in the ‘booster’ cohort, we conducted matching with replacement, so the same ‘no-
booster’ individual could be assigned to multiple ‘booster’ individuals.
After matching was performed, we calculated the number of events (confirmed infection or
severe COVID-19) occuring on the same calendar day in each of the two groups. An individual
is considered severely ill at the date of first positive sample if the individual deteriorated to the
corresponding condition within the study period. The ratio between the incidence of the
outcomes in the ‘booster’ and ‘no-booster’ cohorts was used to estimate the marginal
protection provided by the booster dose. We used non-parametric bootstrapping, with 200
bootstrap samples, followed by random matching, and reported the median ratio as the
protection estimate and the 95% confidence intervals around it. Overall, out of 603,953
18individuals for whom 12 days or more passed since their booster dose, 603,953 matched pairs
were found.
For the first type of matching, our analysis yielded an estimate of 13.4-fold (95% CI [8.2-21.4])
for protection against confirmed infection. Due to the very small number of severe cases
following the booster a reliable estimate of the protection versus severe illness using this
approach was not possible.
For the second type of matching, our analysis yielded an estimate of 9.6-fold protection
against confirmed infection (95% CI [8.1-11.4]) and 9.5-fold protection against severe illness
(95% CI [5-19.6]). The overall agreement between the main and secondary analyses gives
further reassurance that our results are robust to the employed statistical methodology.
19Supplementary Figures
Figure S1. A conceptual schematic demonstrating the possible underlying dynamics of the results in
Figure 2.
20Figure S2. The daily rate of tests per person as a function of the time relative to the administration of the
booster dose. A decrease in the rate of testing is observable just after the administration of the booster,
likely reflecting transient behavioural changes in care-seeking behaviour or risk-avoidance.
21Figure S3. A schematic illustration of the allocation for the dynamic cohorts. We show two example
timelines for two different individuals, and detail the cohort they contribute to at each point in time as
well as the total days-at-risk for each person in each cohort.
22Figure S5. Sensitivity analysis across periods of booster vaccination for the booster protection against
confirmed infection as a function of the number of days following the booster dose. Protection is given as
a fold change in risk relative to people who received only two vaccine doses.
23Figure S4. The distribution of time between first positive test and severe illness for confirmed cases
between November 1st, 2020 and March 1st, 2021.
24Table S1: Poisson regression results for confirmed SARS-CoV-2 infection. term estimate std.error statistic p.value (Intercept) -6.96 0.06 -124.31
Table S2: Poisson regression results for severe COVID-19 disease.

 term                                   estimate        std.error   statistic   p.value

 (Intercept)                              -10.94            0.23     -47.78
You can also read