Bob Darwin - Manager Emerging Opportunities - Ergon Energy, Queensland, Australia The challenge and promise of our intelligent utility future ...
←
→
Page content transcription
If your browser does not render page correctly, please read the page content below
Bob Darwin – Manager Emerging Opportunities
Ergon Energy, Queensland, Australia

The challenge and promise of our intelligent utility future …

                                                                1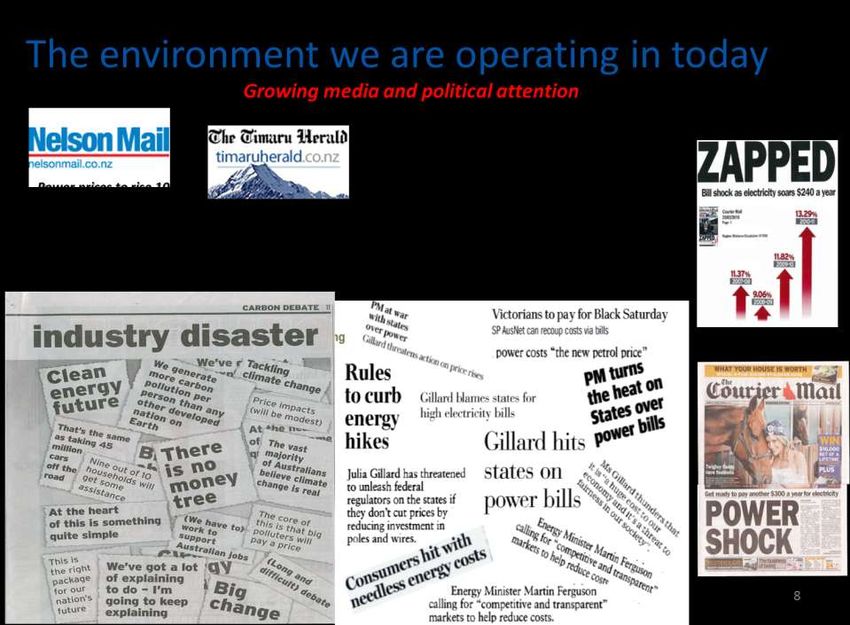
“Doubt is not a pleasant
  condition, but certainty
        is absurd.”
Voltaire ( 18th Century )

                    By the time its obvious,
                    its simply too late
                    (Bob Darwin, Auckland 2013 )
                                                   2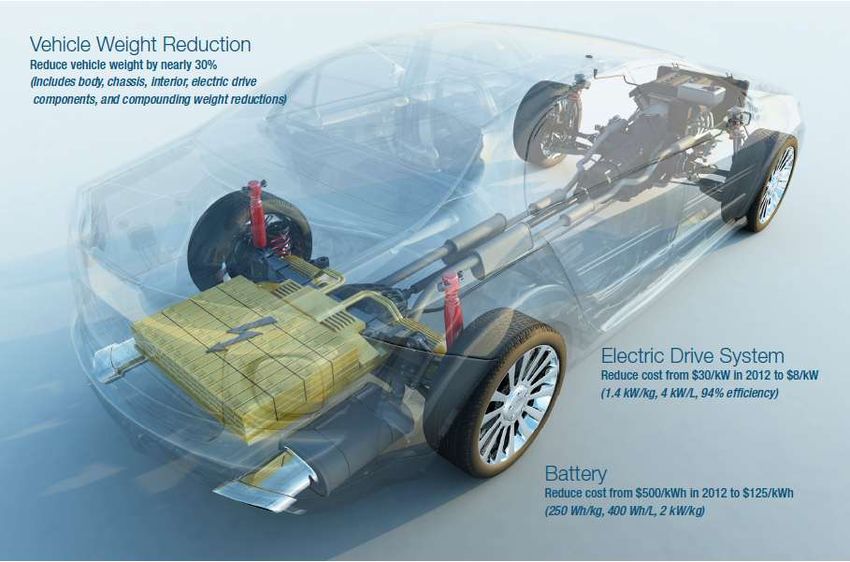
Topics to be covered today
Emerging opportunities and drivers for change
Smart Grid - allowing customers to play a
more active role in how they consume,
produce or store energy
PV and EV integration: meeting the challenge
Key lessons from Ergon pilots/trials
Reflections on the pathways NZ could take
3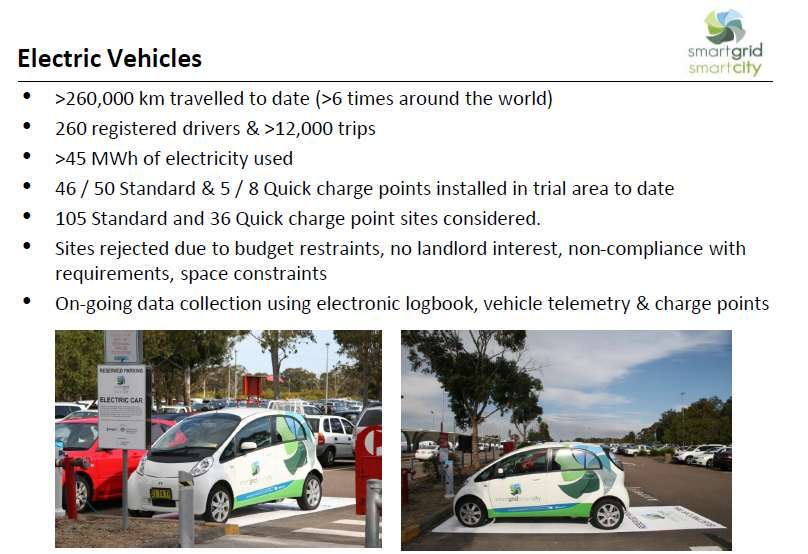
A snapshot of Ergon Energy

                             •   Regional Queensland electricity distributor
                                 and non-competitive retailer
                             •   Service area covers 97% of state
                             •   More than 690,000 customers
                             •   Around 4,700 employees
                             •   Cover 1.7million square kilometres
                             •   1 million power poles
                             •   150,000 km of power lines
                             •   91,500 distribution transformers
                             •   378 zone substations
                             •   34 power stations (grid connected and
                                 stand alone)
                             •   Range from harshest environments to
                                 most sensitive great barrier reef
                             •   $10.6b asset base
                             •   $7.5B investment in the 2010-15
                                 Regulatory Period
                             •   2.4 customers per km
                                                                         4
Unique Challenges drive creative solutions

► Ergon manages the world’s
  largest distribution network
  covering a geographical area
  far greater than the US state of
  Texas
► This may be the largest man
  made machine on the planet

                                             5
Recurring Challenges !!!

                           6
Emerging Opportunities Framework

         Scanning                 Contextualising        Transitioning

 Scanning: the                Contextualising: the      Transitioning: the
 identification of emerging   assessment of emerging    development of
 themes and                   themes into a context     options for the
 opportunities.               that is relevant to the   business to respond to
                              business

                                                                                 8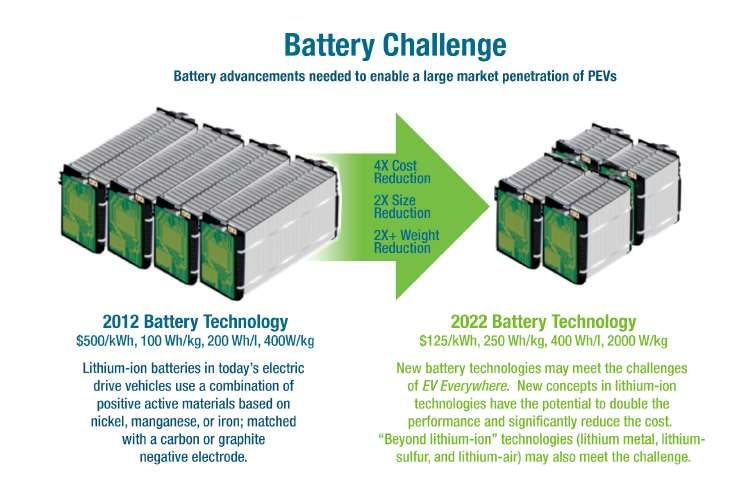
Key Challenges for Ergon Energy ( and you )

► Increasing costs in delivering power due to ageing &
  stressed assets
► Market/Policy intervention
► Climate change issues eg. Carbon pricing, asset
  restoration after natural events (storms, fires, floods)
► Changing customer and stakeholder expectations
► Mitigate peakier loads to improve supply costs capital
  spend and asset capital efficiency
► Integration of intermittent renewables
► Increasing customer expectations for affordability,
  service and choice (esp. information on and management
  of energy use/cost)

                                                             9
Emerging factors to consider

► The electricity industry is subject to more external pressures
  and scrutiny than ever before
► The customer is critical and collaboration and value sharing
  are essential
► Moving from the environment where utilities decide what is
  best for customers, through some engagement with
  customers to try and have them agree to the services
  provided
► Increasingly the customer will dictate outcomes
► They will have the technology and knowledge to be active
  participants in a customer enabled market
► Pro customer regulatory change is coming
► Changes are creating new disruptive business models

                                                                   10
What’s Driving Prices Up?
• Australia was built on cheap energy - after the sheep
got tired of carrying us on their back.
• Traditionally cheap electricity mainly due to abundant
and low cost hydro and thermal resources
• Electricity cost is now a risk to the economy and
governments and regulators are intervening.
• But who and what is driving the cost up and for what
purpose? ….and increasingly disasters are
adding to costs
11A Significant Challenge is increasing Peak Demand
Domestic air conditioning is the driver
• Rampant network peak demand (kW) growth, drives …
• kW >> capacity investment >> costs (ROI, Dep'n, Opex) >> price
Peak demand
growing at
double the rate
of energy growth
More than half
costs are fixed
Stop it or you’ll go broke … adopt a new business approach
Under utilized asset
Get smart about flattening
the curve
12Increase in installed PV systems in Regional Qld
80000
70000
60000
50000
40000
30000
20000
10000
0
Jul-09
Jul-10
Jul-11
Jul-12
Jan-10
Jan-11
Jan-12
Jan-13
Apr-09
Oct-09
Apr-10
Oct-10
Apr-11
Oct-11
Apr-12
Oct-12
► As at end January, 69,000 prosumers – about 1 in 7
detached homes, 208 MWDrivers of PV system penetration
► Qld Household Energy Survey Jan 2013 - 79% - to get control of
increasing electricity costs. Underlying carbon awareness.
► Government incentives
► Renewable Energy Target/Solar Credits Multiplier
► Feed-in tariffs (Solar Bonus Scheme)
► Reductions in unsubsidised PV system prices
► German and other subsidies creating a market
► Chinese and other bulk manufacturing
► High Australian dollar
► Increased competition in sales and installation
► ‘Perfect storm’ for solar PV, and distributors are playing catch-up
Oversupply of batteries due to lower than ‘hoped’ for EV take upSmart(er) Grids
According to research company Bloomberg New Energy Finance, utilities worldwide
spent $13.9bn on smart grid technologies in 2012, up 7% on 2011.
15Smart grid … build assets smarter
Get
Smarter
… to an
… move from a
interconnection
transport business … business.
Smarter assets; smarter asset & load management
Distributed energy resources ..
demand management, energy storage,
energy management & renewables integration.
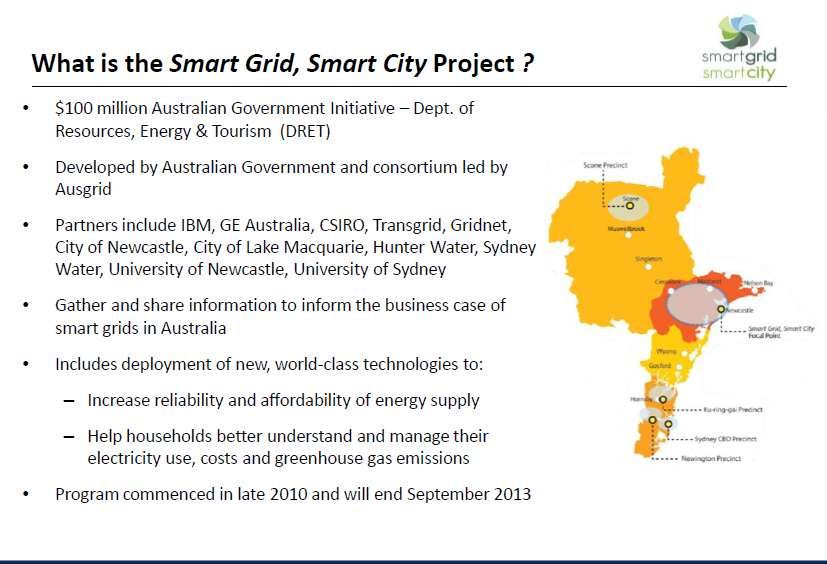
16www.smartcitysmartgrid.com.au
** Just launched Information Clearing House 5th March 2013
www. ich.smartgridsmartcity.com.au
1718
19
20
21
22
Cost targets

               23
See new German policy focus to finance storage
24US Policy
• The California Public Utilities Commission added
what could be some more market muscle for
energy storage when it ordered Southern
California Edison to procure 50 MW of energy
storage and an additional 600 MW from
"preferred sources," including storage by 2021 at
the latest.
• Consider DM in order of merit above new
network builds *****
25Ergon EV Trial - Townsville
►The trial concluded that, by 2023, EV impact on network
costs could range from a negative Net Present Value (NPV)
of $800M to a positive NPV of $21M. However, these
figures are only indicative at this stage, with further
modelling underway.
►Power quality issues, such as a drop in voltage, were
identified as being the most likely first impact of EVs on the
network, followed by capacity issues with EVs connected to
Tariff 11 ( normal )
►Modelling forecasts indicate there could be as many as Seems
130,000 EVs within Ergon Energy’s network by 2023 and Extreme !
further modelling is being performed to determine the
likelihood and potential implications of the modelling.
26Townsville Solar Cities – Magnetic Island
► For the past four years Magnetic Island has been undergoing a sustainable
energy transformation – changing the way we think about and use energy
now and into the future
► Ergon Energy has been helping residents and business owners to reduce
'peak demand' (6pm – 9pm daily) and electricity usage, reduce greenhouse
gas emissions, save money and defer network investment.
27Magnetic Island Solar City Success
► Through a program that researched the local issues, engaged the
community on these issues, and worked with individual customers
across Magnetic Island, the Solar City Project:
► Deferred undersea cable by 8 years (target 6 years)
► Reduced peak demand by 40% compared to business as usual
(target 27%)
► Reduced electricity consumption by 46% compared to business
as usual (target 25%)
► Reduced greenhouse gas emissions by 54,000t (target 50,000t)
► Reduce customer bills by $1.7m compared to business as usual
(target $1m)
► Installed 1MW of solar generation
28Is the Magnetic Island ‘Solution’ Replicable?
► Probably yes for NZ …
► Must …
► Get to know the community
► Examine challenges and options
► Put together an integrated strategy for the engagement,
the education and the solution
► Put in the time
► Ergon would be happy to assist and share learnings
29A Sustainable, Smart Asset and Environment
Management Solution
30• Precise asset location and • Ground Clearance & Attachment
classification. Point Heights
• Poles, bays/spans. • Conductor Clashing / Swing &
• HV (red) and LV (green) Sag
circuits. • Exclusion Zone Assessment
ROAMES Voltage Classification Library automatically assigns voltage to the automatically extracted
powerlines from the LiDAR point cloud without need of any input from Electricity Distributors GIS database
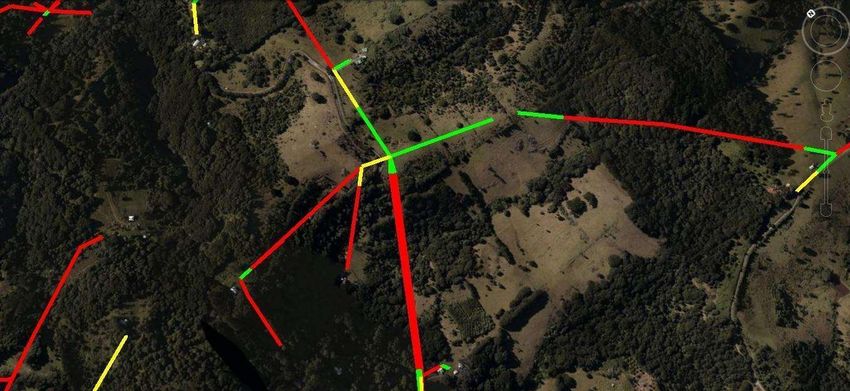
31High Level Risk Analysis - Spans
• Identify vegetation hotspots
• Red: within 1m of conductors.
• Yellow: within 2m,
• Green: no vegetation within 2m.
• Filter across voltages and circuit
configuration.
32Reflections on NZ Future
33The Future is yet to Happen, but
Disruptive technologies
Technology solutions always develop
and business models
What’s important is people and can and do change quickly
how they react and behave to stimuli
So we need to work closely with customers Collaboration is key
Check out www.thefuturesfactory.com
Move quickly from concepts, showcases, trials
Market segmentation strategy
and pilots to sustainable product solutions
is essential
Innovation – not just technology, Must make the customer central
but financing, business models
Policy should be proactive
Simplify the market – its Not political
overly complex Not market distorting
Eg TPM
Electric transportation seems Solar also seems to be
to be an opportunity for NZ an evolving opportunity
34The future is bright, lets embrace it
Together we can make a difference
Lets not waste this opportunityCollaboration and sharing are critical Establish common goals and values Take new actions and dare to ………..
Interesting Innovation and
       Imagination

                             37
38
Thank you
Questions ???
Check it out and please contribute www.thefuturesfactory.com
Bob Darwin
Manager Emerging Opportunities, Ergon Energy, QLD
e: bob.darwin@ergon.com.auYou can also read