Consequences of the increased production of wood based bioenergy on the carbon balance projections for Finland - Maarit Kallio & Olli Salminen ...
←
→
Page content transcription
If your browser does not render page correctly, please read the page content below
Consequences of the increased production
 of wood based bioenergy on the carbon
     balance ‐ projections for Finland
         Maarit Kallio & Olli Salminen
   Finnish Forest Research Institute (METLA)
        LEF workshop on Forest Sector Analysis
                Nancy 30.5.‐1.6.2012
Bioenergy favoured in policies –
carbon sequestration in forests not
Outline for the study on Finnish case
Background
• GHG balance of Finland and Finnish forests
• Policy goals for bioenergy in Finland

Research method
• 2 scenarios for wood based energy studied using 2
  models

Some a priori observations

Results & conclusions
Background
GHG emissions of Finland
•Kioto target for Finland is to go back in emissions to 1990 level, to 71 Mt CO2-eq.

•Energy production (much peat, coal, etc.) causes ~ 80% of non-LULUCF emissions.

• Forests are important sink, absorbing ~35 mill. t.CO2 /a.

                                            GHG Emissions for Finland including LULUCF
         100.00

                   80.00

                   60.00
  Mill. tonnes CO2‐eq

                   40.00

                   20.00

                        0.00
                               1990        2000       2001         2002      2003        2004        2005      2006          2007         2008         2009
             ‐20.00

             ‐40.00                   1 Energy    2 Industrial Processes   3 Solvent and Other Product Use   4 Agriculture     5 LULUCF          6 Waste      7 Other

             ‐60.00
                                                                                                                                Source: UNFCCC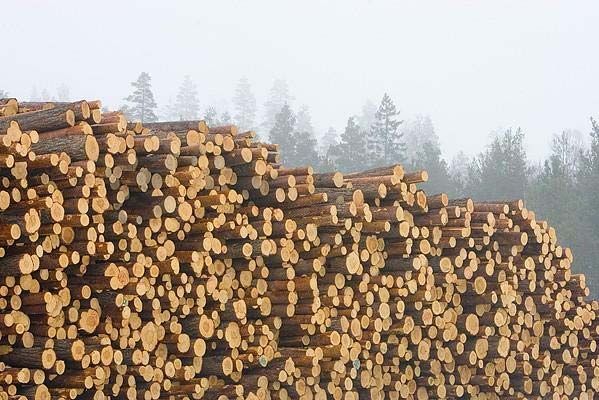
Finnish forests
                and Durban 2013‐2020

• Kioto: Little weigth on forest management sink (Art. 3.4).
  Yet it compensated Finnish LUC emissions (Art 3.3) of 5‐6 Mt/CO2/a.
• Durban: Reference levels defined for forest management sinks 2013‐2020,
  in accordance with decided policies.
• If country’s sink exceeds reference, credit ceiling 3.5% x 1990 emissions
• Forest sink not allowed and not enough to compensate Finnish LUC emissions.
                Forest management    REFERENCE level Maximum CREDIT
                SINK in 2010         SINK with HWP FOR BEATING THE
                                                     REFERENCE.
                Mt CO2‐eq            Mt CO2‐eq
                                                      M t CO2‐eq

    Finland             31.9              20.5                     2.5
EU‐RES 2020 in Finland Obligations for renewables energy sources by 2020: • 38% of the energy consumed RES‐based. • 20% of the traffic fuels based on RES. ‐‐‐‐‐‐‐‐‐‐‐‐‐‐‐‐‐‐‐‐‐‐‐‐‐‐‐‐‐‐‐‐‐‐‐‐‐‐‐‐‐‐‐‐‐‐‐‐‐‐‐‐‐‐‐‐‐‐‐‐‐‐‐ Wood biomass important for reaching the goals: • Double the forest chips use in heat and power to 25 TWh • 3 large biorefineries should make 7 TWh biodiesel mainly from forest chips
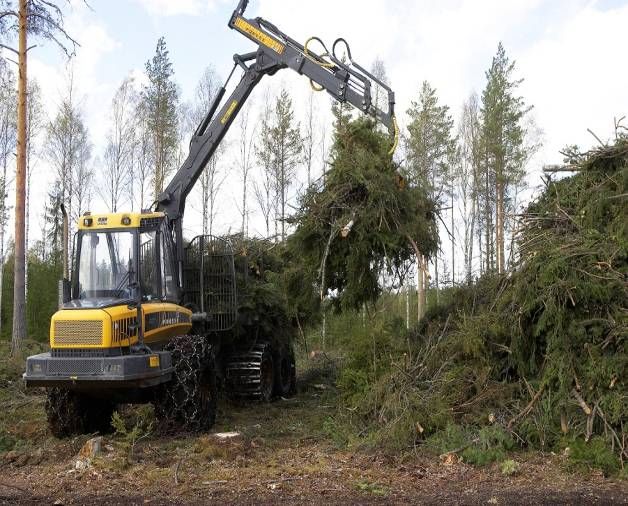
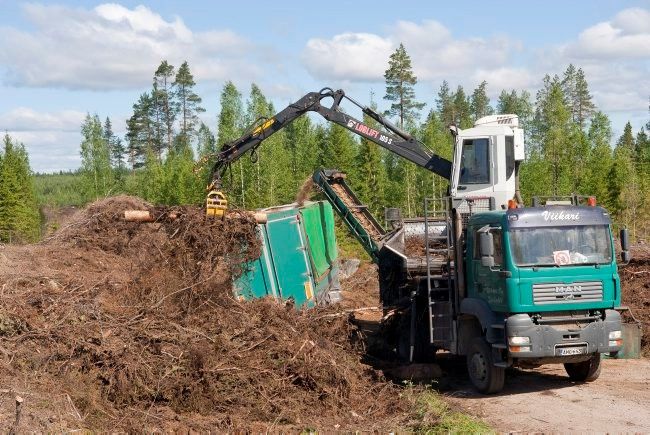
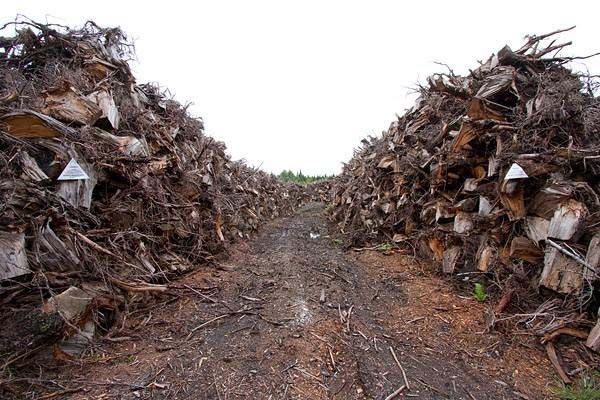
3 Sources of forest chips
                               Stumps: ‐ tied to final fellings of
                               timber, mainly spruce

Small trees
‐from thinnings
‐most expensive

                                Branches and tops
                                ‐ cheapest to collect
                                ‐ tied to final fellings of timber
35 TWh of forest chips required by the goal will not be available with current roundwood harvest levels The gap can be filled with pulpwood.
Study setting and method
Two bioenergy scenarios
            with the climate change as in A1B

•       Low Bio: stagnating use of bioenergy
    –     price of CO2 emission permits down to 0 €/t‐CO2 by 2020
    –     subsidies and taxes favouring bioenergy removed

•       High Bio: 2020 bioenergy goals met
    –     price of CO2 emission permits increases to 25 €/t‐CO2 by 2020
    –     taxes on coal and peat increase as planned by the government
    –     subsidy for chipping small trees for energy
    –     subsidy for wood‐based electricity, if CO2 price below 23 €/t‐CO2
Projected change in average annual temparature
in the IPCC scenarios in Finland; A1B assumed
co Compared to period 1971-2000
A1B
Source: K. Jylhä, Finnish Meteorological Institute2 simulations models used
• Spatial partial equilibrium model for the Finnish forest sector,
SF‐GTM, appended with heat, power and biodiesel production
– finds market prices and quantities of wood products and
biomass, forest industry production, use of solid fuels for heat
and power
ÆWood biomass prices & quantities to MELA2009 model
• Regionalized forest simulations model, MELA2009
– simulates the changes in forest structure optimizing forest
management under given prices
– calculates the stock of carbon in the forest and forest landSF‐GTM
Regionalised partial equilibrium models for sectors
using wood biomass in Finland
• Based on economic theory; assumes profit/welfare
maximizing producers and consumers
• Assumes perfect competition – agents price takers
• Equilibrium prices, quantities and trade flows found
simultaneously for all commodities and all regions using
mathematical programming (maximize (surpluses –
transport cost) s.t. conditions)
• Integrates growing forest resources, biomass supply, wood
biomass using sectors and demand
• Version used has 14 Finnish regions + RoW;
• Production (technologies) modeled at unit/machine level
• Multi‐periodic; one period calculated at a time; the data on
operation environment updated between periodsSF‐GTM model
Consumers of
forest industry products and wood based energy carriers
Demand for and supply of wood/forest biomass
and producs made of them in other regions
(represented by demand functions)
Production factors from other sectors (input prices)
Forest industry and energy sector using wood biomass
Paper & board Sawmills & Plywood Particleboard &
production production fibreboard producion
Pulp production
Heat, power and Pellet production
biofuels production
Forest resources Increment and drain of the growing stock
Biomass (roundwood and forest chips) supply
(supply of roundwood affected by price and growing stock, connection of forest
chips supply to roundwood harvests)MELA
• is a forest management planning tool generated for Finnish conditions
for solving such problems as:
¾ what are the production potentials of forests and
¾ how to manage forests to meet the overall goals of the society/forest
owner now and in the future
• consists of two main parts:
1) Simulation
• automated stand simulator based on individual tree models for
producing alternative development and treatment options for stands
(Siitonen et al 1996, Redsven et al 2011)
2) Optimization
• comparison of stand management alternatives based on linear
programming (JLP ‐ Lappi 1972)Simulation of management schedules
MELA INITIAL DATA “Z t=0”
State of stand i Natural processes g(Zi,t)j Management unit/Sample plot data (1-32):
at time t = (Zi,t)j + ingrowth Inventory year
in alternative j - mortality ”random” Area
X, Y coordinates
+ growth Height above sea level
- self thinning Temperature sum
Owner category
Land-use category
Soil and peatland category
Site type category
Drainage category
t = t+1 Year from last treatment (by treatments)
no, j=j Forestry board district
Forest management category
t=s
Sample tree data (1-20):
Number of stems/ha
yes, j=j+1 Tree species
d1.3
cuttings Height
clearing Age (both d1.3 and biological)
soil preparation Reduction to model-based saw log volume
artificial cultivation Origin
tending
fertilization,pruning,drainage Height of the lowest living branch, m
Human activities: Management category of the tree
ht,i = f(Zi,t)MELA “NFI‐analyses” references
• NFI8 (1986‐1994), NFI9 (1996‐2003), NFI10 (2004‐2008), NFI11 (2009‐)
– calculations made by forestry centre regions
– 50 year simulation time (5 x 10 year periods)
Forest 2000 Programme in 1985 and 1990
National Forest Programme 2010 (1999) and 2015 (2007)
Regional Forest Programmes (1998, 2000‐2001, 2004‐2005, 2008)
Report by the Committee for Financing Forest Protection and Employment
(1996)
Evaluation of Finnish Biodiversity Program in 2004
National climate and energy strategy 2008General structure of SF‐GTM and MELA analyses
SF-GTM Forest (stand/sample plot)
- market analyses data
(supply and demand)
Computational updating
Stand simulator (MELASIM):
Management instructions -natural processes
- treatments
Unit prices and costs
for wood by region Management schedules for stands
Management strategy: forest
level objective and constraints Optimisation (MELAOPT), JLP
Treatments, growning stock etc. by
calculations units and regionsA problem with synchronization
‐ to be tackled in the future‐
• SF‐GTM
• 1 year steps
• MELA2009
• 10 year steps;
• uses the averages 2007‐2016, 2017‐2026,.. from SF‐GTM
‐> the carbon loss due to bioenergy harvests from rapidly
growing forests maybe exaggerated in the first periodSome prior observations the expected impacts of increasing the use of wood based energy: High BIO vs. Low BIO
Expected impact on emission from fossil fuels

• 1 MWhf of peat/coal emits circa 0.381 t CO2eq Æ
  Additional 12 TWh of wood replacing peat & coal in heat &
  power
   – reduces fossil GHG emissions by about 4 Mt/year
   – cuts the Finnish Non‐LULUCF emissions by over 5%

• 1 MWhf of fossil diesel emits circa 0.245 t CO2eq Æ
  7 TWh of biodiesel
   – reduces fossil GHG emissions by roughly 1.8 Mt/year
   – decreases the Finnish GHG emissions from traffic over 10%
Expected impact on forest carbon stock

• unlikely to decrease forest carbon stock from current level
   – Due to high growth and low use of forests, future forest carbon stock may
     still be even higher than now.

• likely to reduce the future forest carbon stock compared to the
  case without additional demand for energy wood
Results
Annual change in
 CO2 absorbed from/released to the atmosphere
        High BIO compared to Low BIO

                 25

                 20
                                            NOT sequestered
                 15

                 10
Mt CO2‐eq/year

                  5                                                                          Net addition CO2 into atmosphere

                  0
                       2011201220132014 2015201620172018201920202021202220232024 202520262027202820292030203120322033 20342035

                  ‐5

                 ‐10
                                        NOT released to the atmosphere
                 ‐15

                                    Not released by fossil fuels   Not absorbed by forests     Net effect in Atmosphere
Cumulative difference in sinks and sources of
CO2 in the High BIO compared to Low BIO
400
300
NOT sequestered to the forests
due to increased harvests
200
Mt CO2‐eq
100
0
‐100
NOT released to the atmosphere due to increased use of
‐200 renewable wood energy instead of fossil fuels
‐300
Fossil Substitution Loss in Forest Storage Net effect in AtmosphereForest Carbon Sink in High BIO
vs. Durban Reference Level 2013‐2020
70
60
Sink increasing despite increased biofuel production.
50
40
Mt CO2
30
20
10
0
Forest Carbon sink Reference level
Reference level not jeopardized due to bioenergyIn LOW BIO with no policies favoring bionergy compared to HIGH BIO in 2020:
- Roundwood harvests 12% lower
- Forest owners’ timber sales income 10% lower
- 40% less wood used in replacing fossils
- Pulp, paper and paperboard production 2% higher
- Sawnwood production affected in much longer run, with 1% reduction in 2030
- Pulpwood prices 2030 already very low discouraging thinnins as forest
management and hence harming long-run sawntimber production
70
60
50
40
mill m3
30
20
10
0
2007
2008
2009
2010
2011
2012
2013
2014
2015
2016
2017
2018
2019
2020
2021
2022
2023
2024
2025
2026
2027
2028
2029
2030
2031
2032
2033
2034
2035
Roundwood harvests, HIGH BIO Roundwood harvests, LOW BIO
Use of material wood and forest chips for energy, HIGH BIO Use of material wood and forest chips for energy, LOW BIOSummary and conclusions
The first combined model runs suggest that
 reaching the Finnish targets for wood energy
• Has negative impact on the atmospheric CO2

• … but is vital for Finland’s compliance with EU RES 2020

• does not jeopardize the Finnish Durban reference level

• Dropping the requirement for 3 large biodiesel plants
  could help to decrease the short‐run carbon debt
   – They require increased harvests of (growing) pulpwood
   – Fossil fuel replacement factor is smaller for biodiesel than in heat & power
However, it is not all about GHGs
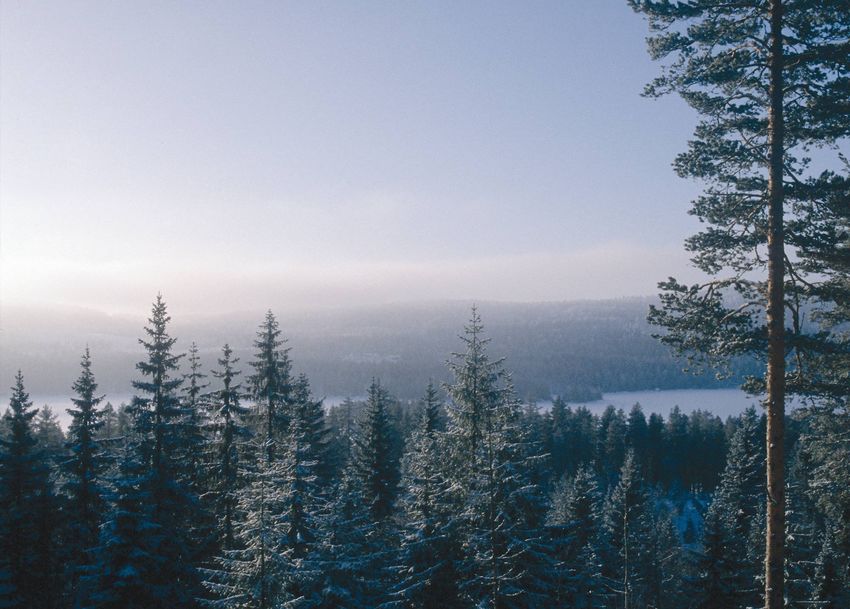
Increased use of wood based energy means
• higher (pulp)wood prices
– Higher income for forest owners
– motivate forest management
– Improve profitability of
sawnwood production
• more jobs, although domestic peat
down
• Improved trade balance and
self‐sufficiency, when foreign non‐
Foto: E. Oksanen, Metla
renewables replaced
• Being prepared for raising prices
of fossils.The issue seen in a positive light • It’s the current HIGH growth of Finnish forests making ”sink use” appealing • Past investments on forest management are bearing fruit. • Room for producing both carbon services and renewable energy / other ”post ‐ pulp&paper” products • No support from tax payers’ needed to increase forest C stock • Finally: Sequestration policy vulnerable to risks: wildfires, windfalls, deseases, pests…
Our thanks to:

• Dr. Risto Sievänen for calculating the carbon
  stocks in forest soils with Yasso2007‐model

• SETUILMU, TEKES and ECHOES for partially
  funding our research.
Thank you
Further information
•   MELA2009 model, e.g.,:
     –   Redsven, V., Hirvelä, H., Härkönen, K., Salminen, O., Siitonen, M. 2009. MELA2009 Reference Manual. The Finnish
         Forest Research Institute. 656 p. ISBN 978‐951‐40‐2203‐6 (PDF).
•   Yasso2007 model, e.g.,:
     –   Tuomi, M., Thum, T., Järvinen, H., et al. 2009. Ecological Modeling 220: 3362‐3371.
•   SF‐GTM model, e.g.,
     –   Kallio, A.M.I., 2010. Accounting for uncertainty in a forest sector model using Monte Carlo simulation. Forest Policy
         and Economics 12(1): 9–16.
•   Forest energy module ForENER (modification included to SF‐GTM):
     –   Kallio, A.M.I., Anttila, P., McCormick, M., Asikainen, A., 2011, Are the Finnish targets for the energy use of forest chips
         realistic—Assessment with a spatial market model, Journal of Forest Economics 17, 110–126
•   Finnish energy targets, e.g.,:
     –   Ministry of Employment and the Economy, 2010. Kohti vähäpäästöistä Suomea. Presentation of Minister Mauri
         Pekkarinen, http://www.tem.fi/files/26643/UE lo velvoitepaketti Kesaranta 200410.pdf.
•   Biorefinery plans:
     –   UPM‐Kymmene Oyj. 2010. Toisen sukupolven biojalostamo. Ympäristövaikutusten arviointiohjelma.
     –   WSP Environmental Oy, 2009. Metsäliiton ja Vapon biodieselhanke, YVA Ohjelma.
You can also read