Boston Dialect Features in the Black/African American Community - ScholarlyCommons
←
→
Page content transcription
If your browser does not render page correctly, please read the page content below
University of Pennsylvania Working
                                                  Papers in Linguistics
Volume 24
Issue 2 Selected Papers from New Ways of Analyzing                                         Article 4
Variation (NWAV 46)

10-15-2018

Boston Dialect Features in the Black/African
American Community
Charlene Browne
Dartmouth Linguistics

James Stanford
Dartmouth Linguistics

This paper is posted at ScholarlyCommons. https://repository.upenn.edu/pwpl/vol24/iss2/4
For more information, please contact repository@pobox.upenn.edu.
Boston Dialect Features in the Black/African American Community
Abstract
Although dialectologists have studied Eastern New England (ENE) for generations, the dialect features of the
Black/African American community are still understudied (Nagy and Irwin 2010:250). In this study, we
conducted field interviews with 28 African American/Caribbean American (AA/CA) residents of Greater
Boston. We compared our results with prior ENE fieldwork in nearby South Boston, a predominantly White
community traditionally known for its strong "Boston accent." Results suggest that some ENE regional
features are shared by both communities (MARY/MARRY/MERRY distinction, NORTH/FORCE
distinction, nasal split short-a). However, other features show significant differences: the AA/CA speakers had
non-fronted START/PALM, unmerged lot/thought (for older speakers), and rapidly receding r-lessness. This
suggests that traditional notions about what constitutes a "Boston accent" need to be reconsidered in a more
inclusive and nuanced way, following the dynamic social and ethnic patterns of the Boston area.
This working paper is available in University of Pennsylvania Working Papers in Linguistics: https://repository.upenn.edu/pwpl/
vol24/iss2/4Boston Dialect Features in the Black/African American Community
Charlene Browne and James Stanford*
1 Introduction
The English dialect features of Eastern New England (ENE) have been studied for generations, but
there has been a significant lack of reseach on Black/African American communities (Nagy and
Irwin 2010:250). Do Black/African American speakers participate in the traditional ENE features?
The present study helps answer this question by interviewing 28 African American/Caribbean
American Boston residents and analyzing the recordings in terms of traditional ENE pronunciation
features. Acoustic sociophonetic and statistical analysis suggests that vowel distinctions and nasal
split short-a were the same as those discovered in South Boston while others, like vowel mergers,
fronted-PALM vowel, and r-lessness were not present. Analysis both from linguistic and anthropo-
logical lens reveals that the reasons for these differences are founded in ethnic diversity and the
associated assumptions of cultural practices.
Kurath (1939) and his team of researchers explored New England thoroughly at the time of the
Linguistic Atlas of New England (LANE 1938–43), establishing an eastern boundary for ENE along
the line of the Green Mountains of Vermont. Traditional ENE regional features identified by Kurath
and subsequent researchers include /r/-lessness, fronted-START and PALM1 vowels, “broad-a” BATH
vowels, NORTH/FORCE (HORSE/HOARSE) distinction, the MARY/MARRY/MERRY distinction, the
LOT/THOUGHT merger, and other phonological, lexical, and grammatical features. Examples of such
studies include Kurath and McDavid 1961, Laferriere 1979, Carver 1987, Nagy 2001, Boberg 2001,
Nagy and Roberts 2004, Labov, Ash, and Boberg 2006, Johnson, 2007, 2010, Roberts 2006, 2007,
2016, Villard 2009, Dinkin 2005, 2009, 2011, Nagy and Irwin 2010, Ravindranath 2011, and Wood
2011. Recent work in northern New England suggests that many of these traditional ENE features
are receding in apparent time (Stanford, Leddy-Cecere, and Baclawski 2012, Stanford, Severance,
and Baclawski 2014), and in Greater Boston, research shows similar receding trends in apparent
time.
Nevertheless, certain Boston neighborhoods, especially those of the traditional working-class,
maintain their status as a “hub” of ENE features. Sipple et al. (2015) conducted a study in South
Boston, a historically working-class Irish neighborhood known for its distinctive dialect features.
They found that although the traditional features like fronted-START and fronted-PALM are receding
amongst younger populations in most of New England, their presence remains in speakers in South
Boston. Other features as well, such as /r/-lessness, intrusive-r, the NORTH/FORCE and
MARY/MARRY/MERRY distinctions, remain strong among speakers raised in this neighborhood. How
long this will last is an open question given the high rate of gentrification and increasing new resi-
dents from other parts of the region and nation. Ethnographic interviews in these traditional Boston
working-class neighborhoods (Sipple et al. 2015) suggest that social and cultural identity remains
centralized, and they continue to maintain the longstanding “hub” ideology of Boston (Amory
1947:22, Gavin 2017). The continuing presence of traditional ENE features in this region is also
confirmed in a large-scale acoustic sociophonetic study of 626 New England speakers using online
recordings elicited via Amazon Mechanical Turk (Kim et al. forthcoming).
What is the status of these features in African American (AA) and Caribbean American (CA)
communities of Greater Boston? Prior work includes Nagy & Irwin’s (2010) rhoticity study of 15
AA speakers. We take the next step by conducting acoustic sociophonetic research on ENE vowel
features of 28 AA/CA speakers. We compare our results to 69 White speakers in nearby South
Boston. US census maps show a large, relatively concentrated population of self-reported Black
residents (e.g., Dorchester, Hyde Park, Roxbury) in close proximity to White neighborhoods like
*Thank you to the Boston-area community members that we interviewed. Thank you also to Jianjun Hua,
Daniel E. Johnson, Neukom Institute for Computational Science, Dartmouth Dean of the Faculty Innovation
Award, Dartmouth undergraduate student researchers and assistants, and Dartmouth Research Computing.
1
Wells’ (1982) lexical sets are used in this article where appropriate.
U. Penn Working Papers in Linguistics, Volume 24.2, 201820 CHARLENE BROWNE AND JAMES STANFORD
South Boston with similar socioeconomic standing. Our research question is: Do Boston-area Afri-
can American and Caribbean American communities participate in the traditional ENE features?
2 Methods
Our subjects consisted of twenty-eight speakers (12 male, 16 female). Eighteen of these individuals
self-reported as African American while 10 self-reported as Caribbean American. They were raised
in Boston, primarily in the neighborhoods of Dorchester, Roslindale, Hyde Park, and Mattapan. The
speakers were interviewed in 2016, and the majority of the interviews were conducted by the first
author, who is a community member and long-time participant-observer in the community.
The recorded interview activities were based on field materials from other Dartmouth-based
projects in New England, including the nearby South Boston work in Sipple et al. 2015. The inter-
views included a list of words, a few sentences to read, a reading passage (based on Nagy 2010),
and then a series of questions to elicit more natural speech. These written materials were designed
to elicit the ENE variables discussed above. After each speaker completed the reading tasks, they
also responded to free-response questions: What are some things that you notice about the way
people speak in Boston? Do you think you have one of those ways of speaking? Why or why not?
These questions were formulated with the intention of garnering insiders’ perspectives on their own
dialect features and attitudes. Toward the end of the interview, speakers were asked basic demo-
graphic questions about their occupation, ethnicity, level of education, and age. The speakers had
an age range of 18–61. We hope that future studies can engage with older speakers in this commu-
nity beyond age 61.
The vowel formants were aligned and extracted with DARLA (Reddy and Stanford 2015)
which is an online web interface that uses FAVE-Extract (Rosenfelder et al. 2014) Prosodylab-
Aligner2 (Gorman et al. 2011), and the Vowels R package (Kendall & Thomas 2010). This online
vowel analysis tool takes manual transcriptions of chunks of speech and then aligns and extracts the
vowels. We then normalized the vowels using the Lobanov method (Kendall & Thomas 2010).
There were 9,562 tokens of stressed vowels in this dataset of 28 speakers. We coded rhoticity audi-
torily. For multivariate analyses, we used Rbrul linear mixed effects modeling (Johnson 2009) on
age, sex, ethnicity, education, occupation, phonetic environment, with speaker and word as random
effects. For this initial study, we included all speech styles together. The AA/CA dataset was then
compared to recent data from White speakers in South Boston recorded and analyzed with the same
materials and methods (Sipple et al. 2015).
3 Results
Among African American/Caribbean American speakers (AA/CA speakers), there is evidence for
the following ENE features: the MARY/MARRY/MERRY distinction, nasal split short-a, and
NORTH/FORCE distinction. These features are stable in apparent time. Notably, other traditional ENE
features, were much less evident: For the AA/CA speakers, we do not find fronted PALM, the
LOT/THOUGHT merger is only present in younger speakers, and r-lessness is receding sharply in
apparent time. In the following, we outline the results for rhoticity, PALM/START, LOT/THOUGHT,
MARY/MARRY/MERRY, nasal split short-a, and NORTH/FORCE.
3.1 Rhoticity
As shown in Figure 1, most of the younger AA/CA speakers were almost fully r-ful. Multivariate
result: Age is significant, with 1.18% more r-fulness per each year younger (p = 0.0034, R = 0.273).
2
Note that r-lessness is also a commonly attested feature in descriptions of African American English
(AAE) (Rickford 1999).
2
DARLA has been recently upgraded to use the Montreal Aligner. See darla.dartmouth.edu.BOSTON DIALECT FEATURES IN THE BLACK/AFRICAN AMERICAN COMMUNITY 21
3.2 PALM/START
Figure 2 shows a comparison of mean PALM F2 for AA/CA speakers (shown in yellow) and White
speakers (in blue) from the South Boston study (Sipple et al. 2015). Notice that the White speakers
are trending toward less PALM-fronting in apparent time, whereas the AA/CA speakers have less
fronting across all ages, although our dataset lacks AA/CA speakers older than 61 years of age, as
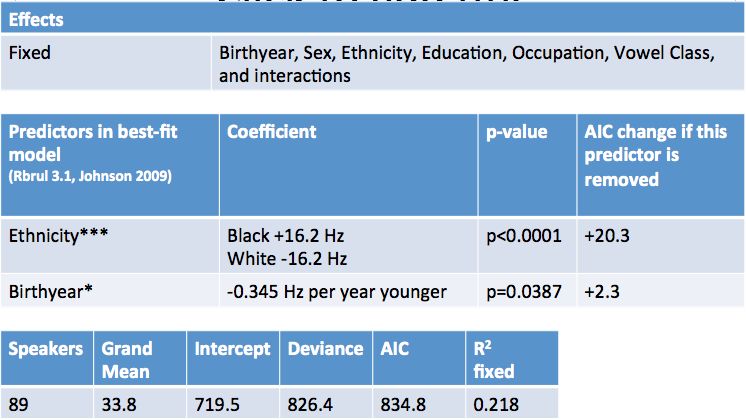
mentioned above. In Table 1, we ran mixed-effects modeling for both PALM and START in order to
compare these two vowel subclasses and also examine age and ethnicity. Table 1 confirms our
graphical analysis by showing how AA/CA speakers are modeled as 36.1 Hz less fronted than White
speakers. We also find that age is significant as younger speakers are less fronted in PALM/START.
The results in Table 1 also suggest that PALM is less fronted than START, which is an example of the
“over-the-radar effect”: As many younger ENE speakers are avoiding older traditional regional
forms, START-class words are predicted to have slightly more fronting than PALM words, because
START words contain two socially marked variables, i.e., the vowel variable and postvocalic-r. For
such words, some young speakers in this region are careful to avoid stereotypically “dropping their
r’s” yet the fronted vowel remains unchanged, being overshadowed by the postvocalic-r variable
(see Stanford, Severance, and Baclawski 2014:120–25). Figure 3 shows an apparent-time plot of
START and PALM for all speakers in the AA/CA dataset and the South Boston dataset.
We also tested statistical subgroups of Caribbean American versus African American for
PALM/START and the other variables in this study. The results did not show a significant difference
here, but obviously this is an area for future research. We recognize that there are important cultural
and sociolinguistic distinctions among these ethnic identities.
80
60
40
20
0
1960 1970 1980 1990
Figure 1: Percentage of r-lessness as a function of birthyear.
Figure 2: PALM F2 as a function of birthyear. CA/AA speakers (yellow) and White speakers from
South Boston (blue).22 CHARLENE BROWNE AND JAMES STANFORD
Figure 3: Mean F2 for START and PALM in apparent time for the AA/CA speakers in the present
study combined with the White South Boston speakers in Sipple et al. 2015.
Mixed effects
Fixed Birthyear, Sex, Ethnicity, EducaVon, OccupaVon, Speech Style,
Vowel Class, and interacVons
Random Speaker (N=97, std dev=36.1), Word (N=73, std dev=31.3)
Predictors in best-fit Coefficient p-value AIC change if this
model predictor is
(Rbrul 3.1, Johnson 2017, 2009) removed
Ethnicity*** Black -36.1 Hz pBOSTON DIALECT FEATURES IN THE BLACK/AFRICAN AMERICAN COMMUNITY 23
3.3 LOT/THOUGHT
These two vowels are merged in most prior work on Boston (e.g., Labov, Ash, and Bober 2006,
Johnson 2010). Figure 4 plots our results for LOT/THOUGHT as speakers’ Euclidean F1/F2 distance
between the two vowels. The plot shows how most AA/CA speakers (shown in yellow) have greater
LOT/THOUGHT distance than the White South Boston speakers (shown in blue), although both groups
appear to be merged among the youngest speakers. The Rbrul mixed-modeling results in Table 2
support these findings about ethnicity and age, but note again that the AA/CA speaker group lacks
speakers older than 61 years of age. In addition, in this initial study we are examining only F1/F2
space, not vowel duration or other factors.
Figure 4: LOT/THOUGHT Euclidean distances by speaker. AA/CA speakers in yellow, White speak-
ers in blue.
Table 2: Rbrul mixed-modeling results for LOT/THOUGHT Euclidean F1/F2 distance.24 CHARLENE BROWNE AND JAMES STANFORD
3.4 MARY/MARRY/MERRY
For this variable, we find that both the AA/CA speakers and the White speakers from South Boston
speakers show evidence of distinctions among two or three of these vowels. Figure 5 shows mean
tridirectional Euclidean distances across MARY, MARRY, and MERRY for each of the AA/CA speak-
ers.
Figure 5: MARY/MARRY/MERRY Euclidean distances (tridirectional) for each AA/CA speaker.
3.5 Nasal split short-a
Nasal split short-a has been reported as an ENE feature in Labov et al. (2006), i.e., BAN is higher
than BAT. This feature is also present among the White South Boston speakers in Sipple et al. (2015),
and we find it among the AA/CA speakers as well. Figure 6 shows the stable contrast between BAT
and BAN for the AA/CA dataset, as speaker F1 means arranged by birth year.
Speaker Means: ASH.NOT.NASAL F1 and ASH.NASAL F1
300
400
500
600
F1
700
800
900
1000
1950 1960 1970 1980 1990 2000
Year of Birth
Figure 6: Mean F1 for BAN versus BAT in the AA/CA dataset, gray=BAT, dark=BAN.BOSTON DIALECT FEATURES IN THE BLACK/AFRICAN AMERICAN COMMUNITY 25
3.6 NORTH/FORCE
Labov et al. (2006) observe a contrast in NORTH/FORCE (HORSE/HOARSE) in the ENE region. This
contrast is evident both in the South Boston data (Sipple et al. 2015) and in the AA/CA community
of the present study (Figure 7).
200
NORTH (HORSE)
300
400
FORCE (HOARSE)
F1 (Hz)
500
600
700
2500 2000 1500 1000
F2 (Hz)
Figure 7: Mean F1/F2 of NORTH (blue) and FORCE (green) for each speaker in the AA/CA dataset.
4 Conclusion
The results analyzed here suggest that phonological features in the Boston-area Black/African
American community differ significantly from other communities in Eastern New England. Some
ENE regional features (MARY/MARRY/MERRY distinction, NORTH/FORCE distinction, nasal split
short-a) are clearly present both among the AA/CA speakers in the present study and the White
speakers from nearby South Boston. Other variables, however, show notable differences: Non-rhotic
speech, which is also commonly reported in some African American varieties elsewhere (Rickford
1999), is strong in the South Boston dataset, but is receding rapidly in our AA/CA dataset. Likewise,
we do not find significant START/PALM-fronting among the AA/CA speakers, unlike the White South
Boston speakers. Our ethnographic interviews in this study and others across New England show
that non-rhotic speech is highly stereotyped, along with START/PALM-fronting. Such features are
present, for example, in the well-known regional stereotyped phrase Pahk your cah in Hahvahd
Yahd and many other common expressions of ENE linguistic identity (see Stanford, Severance, and
Baclawski 2014:133 for more examples).
We believe that it is not a coincidence that the most socially stereotyped Boston dialect
features are the ones being rejected most strongly by the AA/CA speakers in our study. After all,
there is ethnic divergence between White speakers in South Boston and the Black/African American
communities in nearby neighborhoods. Ethnic groups differ from each other in many ways, not least
in language. Like other communities across the country, the African American and Caribbean Amer-
ican community members in Greater Boston have constructed their own repertoires, and this may
underlie the omission of traditional ENE features. Some speakers mentioned an awareness of these
dialect differences and acknowledged that few people of color in the Boston area speak with features
common to South Boston residents. Similarly, with the Caribbean American speakers, their cultural
heritage involves languages like patois, creoles, and pidgins that they heard from parents and others26 CHARLENE BROWNE AND JAMES STANFORD
while growing up in the local community. These experiences no doubt influence dialect features
which they have developed in ways that would differ from the South Boston dataset.
The dichotomy between White speakers in South Boston and the Black/African American com-
munity in our study can also be attributed to the nature of South Boston as a neighborhood. The
neighborhoods in the present study—Dorchester, Hyde Park, Roslindale and Mattapan—are less
insular than South Boston, which is a historically tight-knit hub of Irish working-class people and
others. Traditionally, communities in South Boston and other traditionally White working-class
neighborhoods in the area tend to congregate mainly in their own neighborhoods, often having
highly localized social networks. Therefore, even though South Boston is not geographically far
from the AA/CA communities studied here, there is less interaction between the two groups (Black
and White speakers), and also less mingling of dialect features. Because these two groups are from
the same city, they do share some common ENE features, but the features that are most salient and
most representative of White working-class Boston do not penetrate the other neighborhoods. Our
quantitative results, combined with participant-observation, suggest these AA/CA communities may
not be as sociolinguistically insular as nearby enclaves like South Boston, whose strong regional
features are often viewed as representing the “Boston accent” even though they only represent one
aspect of Boston.
In eastern Massachusetts, there is a commonly evoked notion of “quintessential Boston” and a
“strong Boston accent” which in reality only represent certain types of communities. The use of
these phrases generalizes these sociolinguistic traits to all groups of people in Boston. This can be
a dangerous practice because it erases other speech patterns that belong to the multiple ethnic groups
who share Boston and co-construct its cultures (Fought 2006). The Black/African American com-
munity has been marginalized throughout history. These attitudes that dictate which dialects qualify
as a “Boston accent” may be another form of oppression and insistence that the “White way” is the
“correct” way. This is important for issues of social justice as public discourse continues to confront
vestigial features of colonialism in modern day society. We hope that future sociolinguistic research
will examine more neighborhoods of Boston, interviewing members of other ethnic groups, and
gaining a deeper understanding of this complex and multifaceted city.
References
Amory, Cleveland. 1947. The Proper Bostonians. New York: E. P. Dutton.
Boberg, Charles. 2001. The phonological status of western New England. American Speech 76:3–29.
Carver, Craig M. 1987. American regional dialects. Ann Arbor: University of Michigan.
Chartier, Nicole, Hannah Perry, Maya Ravindranath & James Stanford. 2013. New evidence of dialect shift
in northern New England. Presented at New Ways of Analyzing Variation 42, Pittsburgh.
Dinkin, Aaron. 2005. Mary, darling, make me merry; say you’ll marry me: Tense-lax neutralization in
the Linguistic Atlas of New England. U. Penn Working Papers in Linguistics 11:73-90.
Dinkin, Aaron. 2009. Dialect boundaries and Phonological Change in Upstate New York. Ph.D. dissertation,
University of Pennsylvania.
Dinkin, Aaron. 2011. Weakening resistance: Progress toward the low back merger in New York State.
Language Variation and Change 23(3):315-45.
Fought, Carmen. 2006. Language and Ethnicity. Cambridge: Cambridge University Press.
Gavin, Adam. 2017. The wicked good guide to Boston English. Web address:
http://www.universalhub.com/glossary/index.html
Gorman, Kyle, Jonathan Howell, and Michael Wagner. 2011. Prosodylab-Aligner: A Tool for Forced
Alignment of Laboratory Speech. Canadian Acoustics 39(3):192-3.
Johnson, Daniel Ezra. 2007. Stability and Change Along a Dialect Boundary: The Low Vowels of
Southeastern New England. PhD Dissertation, University of Pennsylvania.
Johnson, Daniel Ezra. 2009. Getting Off the GoldVarb Standard: Rbrul for Mixed-Effects Variable Rule
Analysis. Language and Linguistics Compass 3:359–83.
Johnson, Daniel Ezra. 2010. Stability and Change Along a Dialect Boundary: The Low Vowels of
Southeastern New England. PADS 95. Durham: Duke University Press.
Kendall, Tyler, and Erik R. Thomas. 2010. Vowels: vowel manipulation, normalization, and plotting in R. R
package. cran.r-project.org/web/packages/vowels/index.html.
Kim, Chaeyoon, Sravana Reddy, James Stanford, Ezra Wyschogrod & Jack Grieve (forthcoming). Bring on
the crowd! Using online audio crowdsourcing for large-scale New England dialectology andBOSTON DIALECT FEATURES IN THE BLACK/AFRICAN AMERICAN COMMUNITY 27
acoustic sociophonetics. American Speech.
Kurath, Hans. 1939. Handbook of the Linguistic Geography of New England. Providence, RI: Brown.
Kurath, Hans, and Raven McDavid, Jr. 1961. The Pronunciation of English in the Atlantic States. Ann
Arbor: University of Michigan Press.
Labov, William, Sharon Ash, and Charles Boberg. 2006. Atlas of North American English. Berlin: Mouton.
Laferriere, Martha. 1979. Ethnicity in phonological variation and change. Language 55(3):603-17.
LANE. Linguistic Atlas of New England. 1939–43. Edited by Hans Kurath, with the collaboration
of Miles Hanley, Bernard Bloch, Guy Lowman, Jr., and Marcus Hansen. 3 vols. Providence, R.I.:
Brown University.
Nagy, Naomi. 2001. “Live Free or Die” as a linguistic principle. American Speech 76(1):30–41.
Nagy, Naomi. 2010. How to Survive a New England Winter. See Appendix A of Nagy & Irwin 2010:275-6.
Also available at http://individual.utoronto.ca/ngn/research/r_instruments.htm.
Nagy, Naomi, and Patricia Irwin. 2010. Boston (r): Neighbo(r)s nea(r) and fa(r). Language Variation and
Change 22:241-78.
Nagy, Naomi, and Julie Roberts. 2004. New England: Phonology. In Handbook of Varieties of English: The
Americas and the Caribbean, ed. E. Schneider et al., 270-81. Berlin/New York: Mouton.
Ravindranath, Maya. 2011. A wicked good reason to study intensifiers in New Hampshire. Presented at
NWAV 40, Georgetown, October 27-30.
Reddy, Sravana, and James Stanford. 2015. Toward completely automated vowel extraction: Introducing
DARLA. Linguistics Vanguard. darla.dartmouth.edu.
Rickford, John. 1999. African American Vernacular English. Malden, MA: Blackwell.
Roberts, Julie. 2006. As old becomes new: Glottalization in Vermont. American Speech 81(3):227-49.
Roberts, Julie. 2007. Vermont lowering? Raising some questions about /ai/ and /au/ south of the Canadian
border. Language Variation and Change 19:181-197.
Roberts, Julie. 2016. Internal boundaries and individual differences: /aʊ/ raising in Vermont. American
Speech 91:34-61.
Rosenfelder, Ingrid, Josef Fruehwald, Keelan Evanini, Scott Seyfarth, Kyle Gorman, Hilary Prichard,
Jiahong Yuan. 2014. FAVE (Forced Alignment and Vowel Extraction) Program Suite v1.2.2.
Sipple, Kelsey, James Stanford, Ian Stewart, and Dartmouth LING 80 class. 2015. Boston
Strong: South Boston dialect features across 70 years of apparent time. Paper presented at LSA An-
nual Meeting, January 9, Portland, Oregon.
Stanford, James, Thomas Leddy-Cecere, and Kenneth Baclawski. 2012. Farewell to the founders: Major
dialect changes along the east-west New England border. American Speech 87(2):126-69.
Stanford, James, Nathan Severance, and Kenneth Baclawski. 2014. Multiple Vectors of Unidirectional
Change in Eastern New England. Language Variation and Change 26:103-40.
Villard, Sarah. 2009. Postvocalic /r/ in the Upper Valley of Vermont and New Hampshire. M.A. thesis,
University of New Hampshire.
Wells, John. 1982. Accents of English: An Introduction. Cambridge: Cambridge University Press.
Wood, Jim. 2011. Short-a in northern New England. Journal of English Linguistics 39(2):135-65.
Dartmouth Linguistics
6220 Reed Hall
Hanover, NH 03755
Charlene.A.Browne.19@Dartmouth.edu
James.N.Stanford@Dartmouth.eduYou can also read