Brazil Competitiveness and Inclusive Growth Lab Report - Insight Report - World ...
←
→
Page content transcription
If your browser does not render page correctly, please read the page content below

Insight Report

Brazil Competitiveness and
Inclusive Growth Lab Report

March 2018

World Economic Forum®

© 2018 – All rights reserved.
No part of this publication may be reproduced or
Transmitted in any form or by any means, including
Photocopying and recording, or by any information Storage
and retrieval system.

REF 140318 - case 43923
Contents                                  Preface

3    Preface                                                   The factors determining a country’s level of economic
                                                               growth are numerous and complex. The World Economic
4    Introduction                                              Forum has pioneered assessments of the level and pattern
                                                               of growth in an ongoing effort to better identify, measure
5    The Competitiveness Challenge in
                                                               and monitor these factors under the System Initiative on
     Brazil
                                                               Shaping the Future of Economic Progress. The Forum’s
14   Methodology and Framework                                 annual flagship Global Competitiveness Report highlights
                                                               how countries have progressed or fallen behind on each of
17   The Competitiveness and                                   the factors, and compares their performance at the regional
     Inclusive Growth Lab Findings                             and global levels.
     17   Work stream 1: GVC              Marisol Argueta      Building on this long tradition of competitiveness
          integration and innovation      de Barillas          research and benchmarking, the Forum designed the
                                          Head of Regional     Competitiveness and Inclusive Growth Lab initiative to
     25   Work stream 2: A new            Strategies - Latin
          generation of public policies                        help bridge gaps in competitiveness through focused
                                          America, Member      public-private work that is facilitated by the Forum and
     27   Work stream 3: Institutional,   of the Executive     leads to agendas with achievable reform. Based on the
          legal and regulatory            Committee            report’s results, and under a mandate from the business
          framework                                            and government partners meeting at the Forum’s Annual
                                                               Meeting 2014 in Davos-Klosters, the Forum identified
32   Concluding Remarks                                        the factors on which Latin America lags the most: skills,
33   Annex – Members of the Brazil                             technological readiness and innovation. Following this initial
     Competitiveness and Inclusive                             diagnosis, detailed analysis and policy recommendations
     Growth Lab                                                were presented at the World Economic Forum Annual
                                                               Meeting 2015 and validated at the World Economic Forum
36   Endnotes                                                  on Latin America 2015 in Riviera Maya, Mexico.

                                                               Since the recent recession, the Government of Brazil has
                                                               made a concerted effort to implement a series of reforms
                                          Margareta            to modernize its policies and institutions with the objective
                                          Drzeniek-Hanouz      of increasing productivity and jump-starting the economy.
                                          Head of Future       It is in this context that the Ministry of Industry, Foreign
                                          of Economic          Trade and Services of Brazil and the World Economic Forum
                                          Progress, Member     have partnered to implement the Competitiveness and
                                          of the Executive     Inclusive Growth Lab as part of a broader strategy to boost
                                          Committee            competitiveness and improve the business environment.

                                                               The model builds on previous experience in Colombia
                                                               and Mexico, contributes to the identification and
                                                               selection of priority areas and promotes the formation of
                                                               multistakeholder working groups and steering committees
                                                               for structured dialogue and solutions designed to close
                                                               competitiveness gaps. The success of this initiative rests
                                                               on mobilizing resources and commitments across a broad
                                                               spectrum of stakeholders from the public and private
                                                               sectors at all levels. This report provides a detailed overview
                                                               of the Brazil Competitiveness and Inclusive Growth Lab.
                                                               The plan has been incorporated into the competitiveness
                                                               agendas under steering board member leadership. The
                                                               Forum looks forward to implementing the jointly developed
                                                               work plan and to collaborating with Brazil, and other Latin
                                                               American countries, within the Competitiveness Lab model
                                                               in the future.

                                                                                      Brazil Competitiveness and Inclusive Growth Lab Report   3
Introduction

Context and objective                                                 Structure of the report

After two years of deep recession, Brazil’s economy                   Section 2 of this report presents an in-depth analysis of the
is currently on a path to recovery as a result of higher              current state of competitiveness challenges in Brazil. Section
commodity prices and rising consumption and investment                3 details the methodology and the prioritization process
(IMF, 2018). However, the severity of the recent                      used to determine the scope of the lab.
recession and the modest growth of the past decades
have highlighted the need to enhance productivity and                 Section 4 highlights the findings and policy
competitiveness.                                                      recommendations elaborated by the Working Group
                                                                      within the topics prioritized by the Steering Committee –
As it is generally easier to fix the roof while the sun is shining,   innovation and trade for global value chain (GVC) integration,
the current rebound provides a window of opportunity to               promoting a new generation of policies and addressing
propose forward-looking solutions to strengthen Brazil’s              Brazil’s institutional, legal and regulatory framework. For
competitiveness in the world economy. Such improvements               each proposal, a detailed implementation plan is presented
would not only help to pave a sustainable and inclusive path          to guide policy-makers forward. Lastly, section 5 provides
to prosperity, but also to build resilience to future economic        concluding remarks.
shocks. This will depend mainly on the proper functioning of
its institutions, the quality of its infrastructure, the allocation   Expected outcome
of production factors, a coherent regulatory environment, a
thriving workforce and a healthy innovation environment.              Implementing the proposals presented in the Lab has the
                                                                      potential to further narrow Brazil’s competitiveness gaps
The World Economic Forum’s region-wide Competitiveness                with higher-income countries. Promoting innovation and
and Inclusive Growth Lab initiative in Latin America was              increasing trade flows to support technology spillovers
launched in 2014. With the help of the experts and leaders            and create skilled job opportunities, enhancing policy
from the Forum’s multistakeholder communities in Latin                effectiveness and accountability, and simplifying regulations
America, the initiative aimed to identify the underlying              for businesses are all viable strategies to achieve
factors behind the gaps in competitiveness in the region              sustainable increases in productivity growth rates. These
in comparison to higher-income countries and to develop               recommendations are part of a continuous effort to make
a set of recommendations to bridge these gaps. Moving                 tangible progress in addressing critical issues affecting
beyond diagnosis, the Forum spearheaded country-level lab             productivity in Brazil.
initiatives in Colombia and Mexico to develop and implement
agendas to improve the innovation environment through
public-private collaboration, based on regional-level findings.

While the findings and recommendations from the Latin
America lab remain relevant, Brazil’s priorities extended
beyond the scope of those established regions. To address
the country’s needs, Brazil’s Ministry of Industry, Foreign
Trade and Services (MDIC) and the World Economic Forum
collaborated on the Lab initiative to shape the country’s
competitiveness agenda.

The objective of the Competitiveness and Inclusive Growth
Lab – Brazil and this report is to support the design, launch
and implementation of an achievable agenda to increase
competitiveness by addressing some of the vital challenges
identified by the stakeholders participating in this initiative.

4    Brazil Competitiveness and Inclusive Growth Lab Report
The Competitiveness Challenge in Brazil

Competitiveness is a complex and multifaceted concept, yet                 Similarly, data on productivity in Brazil highlights its
it is widely acknowledged as a vital determinant of prosperity             difficulties in supporting robust and sustained economic
and overall well-being in a country. The World Economic                    growth in recent years. The average annual growth rate
Forum defines competitiveness as the set of institutions,                  of total factor productivity (TFP), which measures the
policies and factors that determine the level of productivity              efficiency with which capital and labour are used, has been
of a country. The level of productivity, in turn, reflects an              negative over the past two decades (Figure 2). The negative
economy’s capacity to efficiently use resources to produce                 TFP growth rate has been persistent despite periods of
goods and services. Productivity levels, thereby, set the level            economic expansion that usually offset negative rates in
of prosperity that can be earned by an economy.                            the long run. According to the World Bank, this can be
                                                                           potentially attributed to the economy’s inability to effectively
Competitiveness is not only essential for productivity but                 shift its resources from low- to high-productive sectors
also for building resilience to shocks. Tracking the results               through structural change, resulting in a misallocation of
from the Global Competitiveness Index and GDP growth                       resources across sectors.
rates since the 2008 economic crisis, economies that are
the most competitive have also been the ones that have had                 During the same period, Brazil’s economy has been steadily
the highest growth rates, showing their capacity to recover                decreasing in complexity, which further increases the
faster.                                                                    country’s missed opportunities in developing its industrial
                                                                           and technology-intensive sectors. This partly explains
Brazil’s overall performance on the Global Competitiveness                 Brazil’s stagnation as a middle-income economy for nearly
Index (GCI) indicates that there is room for improvement in                six decades. While it is a common feature across most
most dimensions of the index (Figure 1). Ranking 80th out of               Latin American countries, this contrasts sharply with OECD
137 economies on the index, Brazil is the least competitive                economies, which have on average remained at the middle-
among the BRICS, and is outperformed by several of its                     income range for approximately 25 years.
neighbours – such as Chile, Colombia and Peru. Brazil’s
measures of competitiveness over the past decade have                      These trends point to long-term structural challenges that
been anything but steady. Between 2007 and 2012, Brazil’s                  are likely to persist beyond the current cycle of economic
GCI score increased by 10%, yet dropped by 6% in the                       growth. Without taking measures to address structural
following five years.                                                      impediments and enhance inclusive growth, Brazil’s living

Figure 1: Brazil’s performance in the Global Competitiveness Report against the regional and OECD averages

Source: World Economic Forum (2017), the Global Competitiveness Report 2017–2018.

                                                                     Institutions
                                                                       7
                                                  Innovation                              Infrastructure
                                                                       6
                                                                       5
                                                                                                    Macroeconomic
                       Business sophistication                         4                             environment
                                                                       3
                                                                       2
                                                                                                           Health and primary
                                 Market size                           1
                                                                                                               education

                                                                                                    Higher education and
                       Technological readiness
                                                                                                           training

                                         Financial market
                                                                                          Goods market efficiency
                                           development
                                                               Labour market efficiency

                                               Brazil          Latin America and Caribbean             OECD

                                                                                                       Brazil Competitiveness and Inclusive Growth Lab Report   5
Figure 2: Total factor productivity (TFP) growth, 1997–2016
Source: Conference board, 2017.
4
3
2
1
0
-1
-2
-3
-4
-5
-6
TFP annual change
TFP avg 1997-2016
standards will be unlikely to effectively converge with those Shedding light on Brazil’s challenging business
in high-income countries. This raises the question of what environment
kind of measures and policies the government can adapt to Partly at the root of Brazil’s low productivity is the “Custo
improve economic efficiency and increase output levels in Brasil”, or “Brazil Cost”, which refers to a range of factors
the long run. that impose substantial costs on operating a business.
Among these factors is a highly complex tax system,
A series of ambitious and comprehensive reforms and poor infrastructure, an unpredictable regulatory and legal
policies have already been implemented or considered system and an inefficient bureaucracy. The successful
by the current administration with the aim of modernizing implementation of the fiscal reforms proposed by the
the economy, enhancing productivity, stimulating growth government, the closure of the infrastructure gap, as well
and putting the country on a fiscally responsible path. For as improvements in the business environment through
instance, the government recently established a cap on structural reforms and a solid simplification agenda, such
government spending with the objective of curbing deficits as the one introduced by the Debureaucratization Decree
and stimulating private investment. A major labour reform (March, 2017), will be essential for a sustainable return to
recently came into effect to reduce labour charges and growth.
risks born by companies in order to improve productivity
and stimulate job creation. Reforms in the credit market The regulatory and legal framework in Brazil is overly
were implemented to stimulate productive investments. The cumbersome for businesses. The World Economic
government has proposed reforms on social security with Forum’s Executive Opinion Survey provides a qualitative
the dual objective of balancing the budget and redistributing assessment of the burden of regulations for 137 countries.
wealth in a fairer way. The survey measures how burdensome it is for companies
to comply with public administration’s requirements (e.g.
While the overall picture of competitiveness in Brazil should permits, regulations, reporting). Scores range from 1
prompt policy-makers to act, several areas identified within (extremely burdensome) to 7 (not burdensome at all). On this
the framework of this report require particular attention indicator, Brazil and Venezuela have the lowest score (1.7)
in order to close the competitiveness gap with higher- and rank at the very bottom of the 137-country sample.
income countries. Given the pervasive levels of poverty and While, in many areas, regulations can be excessive and
inequality, competitiveness policies in Brazil should consider disrupt market forces, it important to stress that strong and
inclusion as a cross-cutting issue. In this respect, it will be enforceable regulations are also vital to ensure workplace
important to incorporate the inequality impact of the policy safety, consumer protection and environmental preservation.
recommendations and prioritize those who support both
productivity and equity.
6 Brazil Competitiveness and Inclusive Growth Lab ReportFigure 3: Ease of starting a business in Brazil
Source: World Bank, Doing Business project (http://www.doingbusiness.org/).
Number of days to start a business Number of procedures to register a business
Brazil Brazil
Latin America & Caribbean Latin America & Caribbean
Peru Peru
OECD members Chile
Uruguay OECD members
Chile Uruguay
0 10 20 30 40 50 60 70 80 90 0 2 4 6 8 10 12
Both heavy regulations and inefficient bureaucracy While regulations are problematic, the current tax
hinder the process of starting a business. It takes an system poses a significant barrier for businesses to
estimated 11 procedures and close to 80 days to start a invest. Results from the World Economic Forum’s Executive
business in Brazil. The government has made significant Opinion Survey suggest that firms in Brazil believe that taxes
progress in facilitating the process of starting a business by reduce their incentive to invest. Scores range from 1 (to a
reducing the number of days from 152 since 2008. Despite great extent) to 7 (not at all). On this measure, Brazil has
these improvements, Brazil remains well behind other Latin the lowest score alongside Greece with 1.8, ranking 136th
American countries (Figure 3). and 137th respectively. Incidentally, significant gains could
be made to improve the business environment by tackling
There are several ongoing initiatives at various levels of overregulation and reducing the complexity and burden
government attempting to address this issue. Some of these of the tax system, which would raise investments and
recent efforts are led by the Ministry of Industry, Foreign productivity.
Trade and Services to simplify and integrate IT systems to
facilitate opening and closing businesses – the so-called Innovation remains below potential
REDESIM. In 2017, significant reforms by the city of São Innovation is a vital driver of both productivity and
Paulo led to the integration of federal, state and municipal competitiveness. Countries in which companies are
procedures, dramatically decreasing the number of days to exposed to international competition often need to innovate
start a low-risk business from 101 to seven days. and adapt quickly to the pace of the technological change
in order to remain competitive on the global market. In the
Alongside inefficient bureaucracy, tax rates constitute context of this paper, innovation is defined as the capacity to
one of the most problematic factors for doing business generate, absorb and use technology and non-technology-
in Brazil (Figure 4). At 68.4%, the corporate tax rate is based knowledge to create new products, services,
among the highest in the Global Competitiveness Index processes or organizational change that can add higher
country sample (ranked 134th out of 137 countries). This economic, social or environmental value.
indicator measures the amount of taxes and mandatory
contributions payable by a business expressedsub as On measures of innovation and business sophistication,
a share of commercial profits. Further emphasizing the Brazil is lagging significantly behind advanced
complexity of the tax system, it takes an average 1,958 economies but performs relatively well in comparison to
hours per year (in 2017) for businesses to prepare, file other Latin American countries. This is notably the case
and pay taxes in Brazil. Although the average time has on innovation measures from the GCI (Figure 5). Business
been brought down from 2,600 since 2015, the current sophistication measures show relative weaknesses in
average remains excessively high in comparison to the Latin terms of Brazil’s value chain breadth, nature of competitive
American and OECD averages of 330.9 hours and 164.6 advantage and production process sophistication.
hours, respectively.
Brazil Competitiveness and Inclusive Growth Lab Report 7Figure 4: Most problematic factors for doing business in Brazil
Source: World Economic Forum, Executive Opinion Survey 2017.
0 2 4 6 8 10 12 14 16 18 20
Score
1 Tax rates 18.6
2 Restrictive labour regulations 12.5
3 Corruption 12.3
4 Inefficient government bureaucracy 12.0
5 Inadequate supply of infrastructure 10.4
6 Policy instability 7.4
7 Tax regulations 5.4
8 Access to financing 5.2
9 Government instability/coups 4.2
10 Inadequately educated workforce 4.0
11 Inflation 2.1
12 Crime and theft 1.9
13 Insufficient capacity to innovate 1.8
14 Poor public health 1.1
15 Poor work ethic in national labor force 1.1
16 Foreign currency regulations 0.1
Figure 5: Brazil’s performance on innovation and sophistication factors, 2017 (score 1–7)
Source: World Economic Forum, 2017.
Local supplier
Capacity for
quantity
innovation 7
7 Local supplier
Value chain breadth 6
Intellectual 6 Quality of quality
property 5 scientific research 5
protection 4 institutions 4
State of cluster
3 Extent of marketing 3
development
2 2
1 1
Availability of
Company
scientists and
spending on R&D Control of Nature of
engineers
international competitive
Gov’t procurement University-industry
Willingness to Reliance on
of advanced tech collaboration in
delegate authority professional
products R&D
Production process
sophistication
Brazil Latin America and Carribean OECD Brazil Latin America and Carribean OECD
8 Brazil Competitiveness and Inclusive Growth Lab ReportFigures 6 & 7: Evolution of innovation and technological readiness in large advanced economies and large emerging
economies.
Source: World Economic Forum, Global Competitiveness Report 2017–2018.
Innovation ecosystem Technological readiness
6.5 6.5
Germany
Japan
6 6 France
United States
Canada
Germany Korea, Rep.
5.5 5.5
Japan
United Kingdom Italy
5 France
5
Korea, Rep. Brazil
Canada
Russian Federation
4.5 4.5
Turkey
China Mexico
India China
4 Indonesia 4
Italy Indonesia
Russian Federation
3.5 Mexico 3.5
Turkey
Brazil India
3 3
2.5 2.5
2007-2008 2009-2010 2011-2012 2013-2014 2015-2016 2017-2018 2007-2008 2009-2010 2011-2012 2013-2014 2015-2016 2017-2018
2008-2009 2010-2011 2012-2013 2014-2015 2016-2017 2018-2019 2008-2009 2010-2011 2012-2013 2014-2015 2016-2017 2018-2019
Brazil’s overall competitiveness depends on its capacity
As illustrated in Figure 6, the largest emerging economies – to compete in high-technology markets. High-technology
including Brazil – have managed to improve their innovation exports are products with high R&D intensity, such as
environment (Figure 6) and technological readiness (Figure in aerospace, computers, pharmaceuticals, scientific
7) over the past ten years, though a clear gap persists instruments and electrical machinery. While Brazil’s intensity
compared to leading economies. in high-tech exports in manufacturing compares relatively
well with its Latin American counterparts at 13.5%, it
remains well below the OECD average (17.6%) and has
shown little sign of convergence in the past decade.
Brazil Competitiveness and Inclusive Growth Lab Report 9Figure 8: Share of high-technology products, 2016 or latest observation
Source: United Nations, Comtrade database through the WITS platform.
35
30
25
20
15
10
5
0
Japan
Mexico
Norway
Sweden
Poland
Luxembourg
Spain
China
Canada
Belgium
India
Greece
Iceland
Denmark
Hungary
Italy
Chile
United Kingdom
Portugal
France
Brazil
Turkey
Estonia
South Africa
Ireland
Korea, Rep.
Argentina
United States
Switzerland
Israel
Indonesia
Germany
Australia
Czech Republic
New Zealand
OECD members
Slovak Republic
Austria (2015)
Finland (2015)
Netherlands (2014)
Slovenia (2015)
Russian Federation
Brazil’s innovation output, as measured by the number public expenditures, the private sector will need to step up
of applications filed under the Patent Cooperation to boost R&D expenditures in the short to medium term in
Treaty (PCT), is very low compared to leading countries. order to further close the gap with higher-income countries.
Despite being the leader in Latin America in this measure,
with 670 patent applications in 2014, Brazil accounts for Brazil continues to rely on low-skill, labour-intensive
only 2.2% of patents filed by BRICS countries. The gap with sectors with low innovation and productivity potential.
the leading nations is even more severe. While 74% of the With 21.6% of the workforce employed in knowledge-
207,147 Patent Cooperation Treaty applications were filed intensive sectors, Brazil’s share is the second-highest in
globally from the United States, Japan, China, Germany Latin America, behind Argentina (23.9%), though its share
and the Republic of Korea, Brazil’s share is approximately is about half of the average in OECD countries (39.8%).
0.003%. The percentage of the workforce employed in knowledge-
intensive sectors is a measure of the presence of workers
Although there is room for improvement on the global stage, who are the most likely to generate innovative ideas and
innovation in Brazil has rather been inward-looking. Patent bring them to market.
applications to the Brazilian patent office (INPI) increased by
10% in 2016 and 5% in 2017, totalling 8,404 applications. The shortage of skilled labour appears particularly
problematic for Brazilian firms. Some 61% of them declare
There have been significant efforts from the government having problems filling their vacancies – due to a lack
to bring down the processing time of patent applications. of workers with adequate skills – compared to 45% on
Recent efficiency gains by the INPI have allowed it to reduce average in Latin America and 34% in OECD countries.
its patent application backlog for the first time in 15 years, The automotive and machinery sectors display the most
through increasing the number of annual decisions per acute skill gaps, accentuating the challenge to diversify
examiner from 35 to 55 over a three-year period. Further into activities deemed more beneficial for development and
progress is expected to come with the government’s industrial upgrading.
ongoing efforts to simplify IP processes and regulations
and hire additional human resources, as well as further While Brazil is lagging behind, there have been recent efforts
automation and international cooperation. to close this gap. The Pronatec Indústria programme, a
national technical vocational education training programme
Brazil’s expenditures from both the public and private implemented by the government, has shown some success
sectors in research and development as a share of in aligning the needs of firm and skill supply.
GDP remain low compared to higher-income countries. While addressing challenges related directly to innovation
Despite a 17% growth in R&D expenditures (from 0.988% to would raise productivity levels, a poor business and
1.17%) between 2006 and 2014, Brazil is currently spending regulatory environment not only poses a significant barrier
approximately half of the OECD average (2.5%) as a share to developing skills and innovation, it impairs the quality and
of GDP. Brazil’s R&D spending is nonetheless significantly efficiency of the interactions between and within the public
higher than most other Latin American countries. With and private sectors.
the government currently under intense pressure to curb
10 Brazil Competitiveness and Inclusive Growth Lab Report0
1
2
3
4
0.5
1.5
2.5
3.5
4.5
0
10
20
30
40
50
60
70
Luxembourg Indonesia
Switzerland Chile
Norway Mexico
Sweden Argentina
Iceland India
Israel South Africa
United Kingdom Latin America & Caribbean
Netherlands Greece
Belgium Poland
Denmark Turkey
Finland Russian Federation
Australia New Zealand
Russian Federation Brazil
France Slovak Republic
Canada Spain
Germany Portugal
New Zealand Luxembourg
Estonia Italy
Slovenia Hungary
Austria Estonia
Ireland Ireland
United States Canada
Czech Republic
United Kingdom
OECD
Norway
Poland
Czech Republic
Italy
Netherlands
Hungary
China
Portugal
Australia
Source: United Nations Educational, Scientific, and Cultural Organization (UNESCO) Institute for Statistics.
Source: United Nations Educational, Scientific, and Cultural Organization (UNESCO) Institute for Statistics.
Spain
Slovenia
Slovak Republic
Figure 9: Research and development expenditure (% of GDP), 2015 or latest observation
Iceland
Greece
France
Chile
Figure 10: Share of knowledge-intensive jobs in the workforce (%), 2016 or latest observation
Belgium
South Africa
OECD members
Japan
Argentina United States
Brazil Germany
Korea, Rep. Finland
Turkey Denmark
Mexico Austria
LAC Sweden
Indonesia Japan
Brazil Competitiveness and Inclusive Growth Lab Report
China Korea, Rep.
Israel
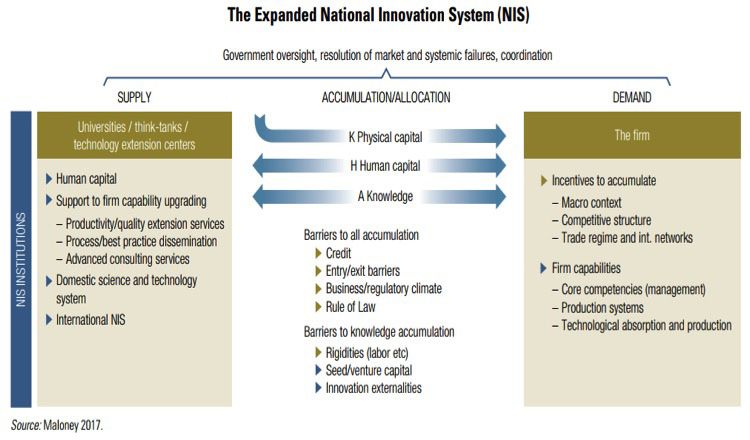
11An unfulfilled potential: International trade and While import tariffs are relatively high, non-tariff barriers
global value chain integration also pose a challenge to domestic competition and FDI.
Trade openness and integration to global value chains Results from the Executive Opinion Survey from the World
(GVCs) can be an important pathway to improve Economic Forum suggest that firms consider non-tariff
competitiveness and spur growth in Brazil. With exports barriers – such as health and product standards, technical
and imports representing less than a quarter of GDP, Brazil and labelling requirements – to strongly limit the ability of
is positioned with very limited insertion in GVCs. As the imported goods to compete in the domestic market. This
country remains one of the least integrated economies in the can pose a challenge for firms that wish to acquire cheaper,
world, there is sizeable unfulfilled potential from further GVC high-quality intermediary goods for their own production.
participation. There are three main channels through which With a score of 3.4 on this indicator, Brazil ranks 130th
trade liberalization can reshape the competitive landscape: out of the 137 economies in the sample (Figure 12). The
specialization in tasks, access to a larger variety and quality perception from the business community regarding this
of intermediate inputs, and knowledge spillovers from indicator has been steadily deteriorating from 2012 to 2017,
multinational enterprises. Though further integrating Brazil dropping from the 103rd to 130th position.
into the global economy can lead to greater opportunities,
there are also distributional risks involved that need to be Following a similar pattern is the indicator of the perception
acknowledged. Domestic policies that can support an of Brazilian firms in terms of the extent to which rules and
educated and socially mobile workforce which can integrate regulations are restricting direct foreign investment (Figure
high-producing sectors will be necessary to ensure that 12). This score has also been on a negative trend over the
trade liberalization does not exacerbate inequalities. past decade.
Brazil exhibits relatively high barriers to international Another factor hindering foreign competition and GVC
trade, which reduces the benefits from integration into integration in Brazil is the burden of customs procedures
the global economy. Nominal tariff rates on imported related to the entry and exit of merchandise. In this regard,
goods are high in Brazil compared to other economies in Brazilian firms view these procedures as highly inefficient,
the region (Figure 11). The simple average of import tariff with the country ranking 124th in the GCI country sample.
rates across all products was 13.6% in 2016, which is more
than twice as high as Chile (5.99%) and Mexico (6.1%), and In light of this evidence, it is apparent that Brazil will have
almost six times higher than the OECD average (2.39%). to tackle the border and behind-the-border policies that
Though the average tariff rate has remained relatively hamper trade in order to allow resources to be allocated to
stable since the onset of the 2008 financial crisis, it has the most competitive firms.
nonetheless increased by 0.48%. While nominal tariffs are
comparatively high, applied tariff rates tend to be lower Enhancing public policies for greater impact
due to a number of mechanisms in place that allow the Raising productivity has been a priority for the Brazilian
exemption or reduction of import tariffs. For instance, 23% government for some time. However, past efforts to achieve
of Braziian exports in 2017 ($50 billion) were made under higher levels of productivity – through what were viewed as
the drawback regime, which enables the import of inputs pro-growth policies – have yet to generate any satisfying
without imposing import duties. Furthermore, less than or sustainable results. This can be partly explained by poor
40% of Brazilian imports of capital goods from 2015 to policy design. As evidenced in the Global Competitiveness
2017 paid full import duties, while close to 20% of imports Index (Figure 13), Brazil’s public-sector performance is
of information and communication technology (ICT) good below the Latin American average, which in turn, lags far
did not pay tariffs in 2017. (Data provided by the Ministry of behind the OECD average.
Industry, International Trade and Services of Brazil, March
2018)
Figure 11: Tariff rate, applied, simple mean, all products (%)
Source: World Bank, World Development Indicators.
Brazil
Uruguay
Latin America & Caribbean
Chile
OECD members
Peru
0 2 4 6 8 10 12 14 16
12 Brazil Competitiveness and Inclusive Growth Lab ReportThese results are notably driven by the perception from mechanisms and this currently prevents the government
business communities that the government is spending from determining their impact. The benefits of implementing
public revenue inefficiently as well as a lack of transparency such mechanisms are far-reaching. They would allow the
in policy-making. The latter implies that Brazilian companies government to determine the impact of new measures,
find it extremely difficult, on average, to obtain information thereby allowing policy-makers to dispute redundant
about changes in government policies and regulations policies and facilitate the reallocation of investments from
affecting their activities. From a risk-management non-productive to productive sectors. Over time, this would
perspective, it is crucial for the private sector to have a enable policy-makers to take stock of successes and
predictable and transparent policy environment in order to failures in designing new and improved policies. Ultimately,
adapt their firm strategies. this would support the accountability of public expenditures
to citizens and serve to build trust in institutions.
Furthermore, the systematic integration of monitoring With a high level of dissatisfaction among the Brazilian
and evaluation mechanisms in new policies and population towards public institutions and services, it is
programmes is necessary to increase efficiency of crucial for rigorous monitoring and evaluation mechanisms
government spending. For instance, subsidy programmes to be institutionalized to support greater transparency and
to private companies have failed to integrate such accountability and enhance policy effectiveness.
Figure 12: The burden of non-tariff barriers
Source: Source: World Economic Forum, Global Competitiveness Report 2017–2018
7.0
Singapore
Singapore
Singapore
6.0
5.0
Best Performer
4.0 Median
Brazil
Worst Performer
3.0
2.0 Zimbabwe
Mauritania Nicaragua
1.0
Prevalence of trade barriers Business impact of rules on FDI Burden of customs procedures
Figure 13: Brazil’s performance on institutions and the public sector, 2017 (score 1–7)
Source: Source: World Economic Forum, Global Competitiveness Report 2017–2018
Quality of institutions Public sector performance
Wastefulness of
government
Property rights spending
7 7
6 6
5 Ethics and 5
Accountability
corruption
4 Transparency of 4 Burden of
3 government 3 government
2 policymaking 2 regulation
1 1
Corporate ethics Undue influence
Efficiency of legal Efficiency of legal
Public sector framework in framework in
Security
performance challenging regs. settling disputes
Brazil Latin America and Carribean OECD Brazil Latin America and Carribean OECD
Brazil Competitiveness and Inclusive Growth Lab Report 13Methodology and Framework
This section provides a detailed overview of the To facilitate the coordination of the activities around each
methodology and framework of the Competitiveness and of the priority topics, the Working Group is further divided
Inclusive Growth Lab (or Competitiveness Lab). More into Task Forces. A lead is nominated in each Task Force
specifically, it provides information on the governance to coordinate activities and manage the content of the
structure and the process that defined the framework of the recommendation.
lab, and documents the project activities and timeline.
Prioritization of the competitiveness agenda
Governance structure of the lab
In order to define the priority areas of the Competitiveness
The Competitiveness Lab requires the participation of Lab, members of the Steering Committee convened in the
two multistakeholder groups: a Steering Committee and early stages of the initiative. The members were asked to
a Working Group. Each group is chaired by one of its express their views and discuss what they believed were
members to lead and facilitate discussions and convene the the most pressing challenges to improving the business
members to meetings. The Steering Committee consists environment and boosting competitiveness in Brazil.
of top leaders from government agencies, executives from Discussions were guided by the following questions: 1.
the private sector and leaders from non-governmental What are the main challenges and opportunities when
organizations. The Working Group is composed of senior improving competitiveness in Brazil? 2. Which initiatives
representatives from the government, experts from non- could address these challenges and opportunities?
government organizations and the private sector. Nearly 20 initiatives/opportunities were raised by the
Steering Committee members. These can be summarized in
The role of the Steering Committee is to provide input Figure 15 under the following three priority areas:
and guidance to the Working Group, while ensuring that
the lab activities are aligned with the national strategy 1. Global value chain (GVC) integration and innovation,
and existing initiatives. The committee also plays a crucial to enhance public-private collaboration frameworks to
role in determining the priority areas to be tackled by the access GVCs through strategic innovation and trade
lab. The role of the Working Group is to propose a policy facilitation.
recommendation grounded in the framework defined by the
Steering Committee and develop a concrete implementation
plan for the proposed recommendation.
Figure 14: Governance structure
Steering Committee
Working Group
Task force 1: Task force 2: Task force 3:
Innovation and GVC New generation of Institutions and
integration public policies regulations
14 Brazil Competitiveness and Inclusive Growth Lab Report2. New generation of public policies, to improve the Policy development and implementation plan
effectiveness of government investments and policies
through the implementation of monitoring and evaluation Once the policy mapping exercise was concluded, an in-
(M&E) mechanisms. person meeting with the Working Group was organized
to talk with the task force leaders to determine the most
3. Institutions and regulation reform, to improve the promising paths to take. The following drafting guidelines
business environment by simplifying the regulations were shared with the Working Group to facilitate the
framework, ensuring regulatory certainty and lowering elaboration of the recommendations and the implementation
the costs of firm entry and exit. plan.
Diagnosis and impact
The broader impacts of addressing these priorities are
expected to be two-fold. First, they should directly enhance – What is it the proposed recommendation?
competitiveness by strengthening institutions, promoting – What is the objective of the recommendation? What
trade, innovation and improve policy effectiveness. The are the challenges that it aims to address?
second impact would be indirect, by improving Brazil’s – Do you foresee any risks or obstacles to its
reputation and branding through a move towards a country implementation?
willing to modernize. – What are the expected impacts?
Methodology Design and implementation
Mapping the policy landscape – To implement the proposed recommendation, what
are the activities that the implementation plan must
The Working Group members were first tasked with consider?
providing a list of existing state- and federal-level policies – What are the important milestones you consider
and initiatives with similar objectives to those of the priority for the development implementation of the
areas of the Lab. The main purpose of this exercise was to recommendation, for a) one year, and b) three
provide an overview of the current policy landscape in Brazil, years?
and to identify potential policy gaps for the Competitiveness – How can its effectiveness and impact be monitored
Lab to address. This policy database would prevent the and measured?
Working Group from proposing policies and initiatives that
overlapped with existing ones.
Figure 15: The Brazil Competitiveness Lab framework
Enhance competitiveness and
public-private partnerships
GVCs and Innovation New generation of public Institutional, legal and
policies regulatory frameworks
Economic openness,
innovation cycle, start-ups Impact assessment, Reforms,
auditing and accountability, debureaucratization,
public expenditures and institutions update
purchases, VFM focus
Strengthen international
reputation and branding
Brazil Competitiveness and Inclusive Growth Lab Report 15Identifying the relevant actor for implementation
– What is the organization (governmental or non-
governmental) that can lead the implementation of
the recommendation?
– What organizations (governmental or non-
governmental) can be of support for this
recommendation?
– How do you think these actors should be engaged?
By whom?
The Competitiveness Lab timeline
The Competitiveness Lab – Brazil initiative formally started
with the Steering Committee meeting on 7 November
2017, leading to the launch of the Competitiveness Lab and
Inclusive Growth Report at the World Economic Forum on
Latin America in March 2018. Beyond the launch, it was
crucial to secure the commitment from vital stakeholders
to support the implementation of the proposed agenda.
Three meetings with the Working Group took place during
the duration of the project. A first meeting was held on 6
December 2017, over a conference call to discuss and
validate the Lab framework. The second conference call
with the Working Group was held on 20 December 2017,
to discuss the findings of the policy-mapping exercise.
A third meeting took place in person in Brasilia on 17
January 2018, to discuss a path forward to elaborate on the
recommendations and implementation plans. A first draft
of the Competitiveness and Inclusive Growth Lab report
was presented and validated by the Steering Committee in
February 2018.
Figure 16: The project timeline
Collaborative
Project initiation Elaboration of the initiative
implementation
Nov 2017 Dec 2017 Jan 2017 Feb 2018 March 2018
SC
WG
November 2017 December 2017 January 2018 February 2018 March 2018
- Steering Committee Submission of the Submission of the first Revisions of the first draft - Implementation plan
and Working Group policy- mapping draft of the implementation by WG and plan launch
kick off document plan presentation to SC - Results
- SC & WG definition announcement during
and communication LA18
Key milestones Steering Committee virtual/physical meetings Working Group proposed virtual/physical meetings
16 Brazil Competitiveness and Inclusive Growth Lab ReportThe Competitiveness and Inclusive Growth Lab Findings
This section provides a detailed description of the findings The centrality of innovation is even more preeminent in
from the Working Group on the priority topics, or work the current context of technological change. The Fourth
streams, defined by the Steering Committee. Industrial Revolution is accelerating and will change
production systems worldwide. New technologies are
The first work stream aims to promote better access for enabling mass custom manufacturing, and expanding
Brazil in global value chains. There is consensus around sharing economies, advanced robotics, 3D printing,
the fact that the global production landscape is no longer the Internet of Things and artificial intelligence, among
organized in vertical chains and is now organized according others. Furthermore, as information and communication
to tasks, with countries playing a role according to their technology costs are decreasing, so are the entry barriers
competitive advantages. In this context, Brazil is losing in technology-intensive sectors. At the same time, global
wealth gains due to its poor integration in the global value chains are increasingly flexible and specialized. This
economy. generates tremendous opportunities – and pressures – for
emerging economies to develop their innovative capacities,
More specifically, this work stream highlights the need and raises questions over how Brazil will be positioned
for Brazil to participate “more and better” in the global in this fast- changing scenario for it to become a global
economy. The “more” refers to higher international platform of innovative products and services.
economic integration, comprising initiatives related to
market access, trade facilitation and trade infrastructure. Over the past two decades, Brazil has made significant
The “better” refers to the need for a transformation in progress in modernizing its policies and institutions to
innovation policy, in order to promote an enabling innovation support innovation. Sophisticated policy instruments
environment, support the capacity of Brazilian firms to available in most high-income countries – such as
access technology and therefore offer competitive products subsidized loans, grants, equity funds, fiscal incentives,
to new markets. public procurement and scholarships – are also available
in Brazil, yet all actors closely involved in the innovation
The second work stream, promoting a new generation of process remain in a low-maturity state. Furthermore, all
public policies, argues for more transparent, more focused these innovation efforts have not resulted in productivity
and better-coordinated public policies, in order to deliver gains, competitiveness enhancement or a stronger presence
greater competitive and societal impact. These policies in the global value chain. With firms, universities and policy-
should be systematically implemented with rigorous makers still struggling to unleash their innovative potential,
monitoring and evaluation mechanisms, which are crucial to there is a need to measure the impact of current policies to
ensure accountability and increase their efficiency. recalibrate and improve them further.
The third work stream, addressing Brazil’s institutional, legal A thriving innovation environment, as the Expanded National
and regulatory challenges, is less prescriptive and is rather a Innovation System (NIS) Figure 17 shows, requires a healthy
stocktaking exercise, highlighting the challenges and current business environment, efficient financial markets, effective
judiciary system and a more open economy and society.
efforts to improve the institutional and legal environment.
Without a systemic approach to innovation, the returns on
This can be used as a starting point for a discussion on the investments in R&D are likely to remain low, with limited
best path towards improving the institutional environment in social and economic impact. This thriving environment also
Brazil. requires appropriate policies and institutions that support
innovation.
Work stream 1: GVC integration However, innovation policies face two challenges that
and innovation partly explain the low innovation and competitiveness
performance in Brazil. The first important challenge is
the poor integration of policies, instruments and actors
Recommendations that support innovation across the National Innovation System, with excessive
At the heart of productivity and competitiveness is fragmentation and insufficient coordination. The second
innovation – the introduction of new ideas or upgraded challenge is the fact that innovation policies in Brazil are
products in the market, adoption of existing technologies largely supply driven: they are mostly focused on universities
or the improvement of business processes. Fostering firm and research centres, which are seen by the government
innovation must be the main objective of innovation policies as being at the centre of the innovation process. This
and a central tenet of competitiveness policies. requires a transformation whereby policies would be
oriented to business and societal demands, and where an
increase in productivity and competitiveness in the private
sector is the main priority of innovation policies. To do so
requires rebalancing R&D-oriented policies and taking
into consideration the current status of Brazilian firms and
building their innovation capabilities.
Brazil Competitiveness and Inclusive Growth Lab Report 17Figure 17: The Expanded National Innovation System (NIS)
Source: Maloney (2017).
The recommendations detailed in this section will not These factors arguably hinder progress in achieving
address all of the innovation and industrial problems of meaningful national goals and in developing the innovative
the country. As emphasized earlier, to be effective, these capacity of firms, especially small and medium enterprises
recommendations need to be implemented with measures (SMEs). Moreover, the complex and multilayered nature of
that address important systemic constraints, such as the innovation environment suggests that it requires more
business environments, trade regimes, entry and exit than higher levels of investment in R&D to reach the desired
barriers, credit markets and regulatory frameworks. It is level of physical capital and workforce depth. Institutional
vital to solve those systemic constraints, which are crucial and policy fragmentation highlights an urgent need to better
complementary factors, to have a functional innovation coordinate efforts among all stakeholders involved in the
environment. But it is also critical to solve some of the Expanded National Innovation System.
important challenges surrounding existing innovation
policies, which are the focus of this work stream. As a result, a new generation of policy, which places greater
The recommendations discussed below were selected as focus on the innovative capacity of Brazilian firms, must be
short-term priorities based on diagnostics and an evaluation developed. At the heart of this strategy is a demand-driven
of different national and foreign institutions, and are an approach to solve business and societal challenges. This
important step towards improving the quality of existing effort would require:
policies. As illustrated in Figure 18, these are made at two
levels: 1. at the strategic and institutional level; 2. at the 1. A high level of coordination between public institutions.
programme- and policy-specific level. 2. Better integration of different policies and institutions
relating to science and technology, education, health,
1. Strategic and institutional objectives energy, agriculture, defence, foreign trade, etc.
3. Sustained government leadership and political
Objective 1: Towards a paradigm shift in innovation commitment, with sufficient and stable budgets.
policy 4. A shift from the current approach to policy instruments
that are designed to address innovation needs according
Context and analysis to firms’ capabilities level.
Science, technology and innovation policies in Brazil have 5. Monitoring and evaluation of programmes and policies.
evolved considerably in recent years, but their impact on
productivity and competitiveness remain timid. A recent Effective coordination is crucial for this policy to succeed. Its
analysis of Brazil’s innovation policies and regulations cross-sectoral nature would require the Executive Office of
displays instances of overlapping responsibilities, inefficient the President to lead the strategy by creating a deliberative
allocation of resources, discontinuity in investments and committee composed of relevant government agencies.
excessive bureaucracy within the government apparatus. One of the central roles of this committee would be to
approve innovation programmes and instruments with the
18 Brazil Competitiveness and Inclusive Growth Lab Reportsupport of a technical unit linked to the president’s office. 2. Programme- and policy-specific objectives
The main challenges from a governance perspective are
multidimensional and should be tackled first at the highest Objective 2: Establish a results-oriented innovation
level. First, firm-centred innovation policy needs to become policy
a top priority in the government’s agenda. Second, a
centralized coordination system needs to be established Context and analysis
between government agencies. Third, the government Despite making significant investments in science,
needs to craft a long-term vision for its innovation strategy. technology and innovation (S,T&I) over the past decade,
These solutions will require a strong political disposition from Brazil has failed to raise the level of productivity and
the highest leadership in government given the possible competitiveness of its firms. While these results may have
repercussions for the autonomy and structure of certain had a tangible impact on research output – Brazil’s share of
government agencies and the potential reorganization or international citable publications doubled from 1.5% to 3%
in this period – there was no significant impact on patent
elimination of existing institutional bodies. Nevertheless,
applications, firm innovation, private R&D expenditures and
the overall long-term impacts are expected to be high-tech exports.
positive through improved policy efficiency, cost-effective
programmes and lean and agile institutions. Partly explaining this low performance on innovation metrics
is the supply-driven character of current policies: 65% of
Recommendations Federal S,T&I investments are concentrated on universities
–– Position firm-centred innovation policy as a top and research centres, usually disconnected from business
priority for the government. The goal is to have a long- and societal demands. It is estimated that only 30% of
term vision and strategy, an internationally competitive Brazilian public R&D investments targeted sectoral ministries
budget, effective monitoring and evaluation capacity, and agencies – compared to 90% in the United States,
and the necessary political support to improve innovation for instance – while 70% are concentrated in the Ministry
of Education and the Ministry of Science, Technology and
environment.
Innovation according to IPEA (Institute of Applied Economic
–– Promote an integrated innovation policy. Innovation
Research).
policy must be integrated and aligned with education,
science, technology, industrial and foreign trade policies,
Another critical factor to consider is the relatively high level
but also other sectors such as defence, health and
of fragmentation of R&D investments, both across research
energy.
disciplines and in terms of the number of research projects
–– Establish a “National Innovation Policy Coordination
funded. Research projects are typically small in scale,
committee” or an “Innovation Chamber”. This would
which tends to generate little impact. This is compounded
act as a high-level body linked to the Office of the
with a lack of prioritization in research areas that could
President. Its purpose would be to ensure coherence
otherwise see efforts concentrated to reach excellence.
in innovation policy deliberations and the integration of
Moreover, projects are spread all over the country, delaying
policy instruments to improve the targeting and impact of
gains on a regional scale. More than half (52%) of Brazilian
programmes.
research laboratories are worth less than R$500,000, while
only 20 laboratories (less than 1% of the total number of
laboratories) are worth more than R$20 million. Addressing
the fragmentation in R&D investment could potentially
generate positive scale effects on research quality and
support interactions with the private sector.
Figure 18: The objectives of the innovation sub-stream
1. Strategic and 2. Programme- and
institutional objectives policy-specific objectives
2. Establish a results-oriented
innovation policy
3. Build firm capacity to
1. Towards a paradigm shift accelerate technology
in innovation policy
adoption
4. Foster a dynamic start-up
ecosystem
Brazil Competitiveness and Inclusive Growth Lab Report 19In light of these challenges, it would be necessary for the extension instruments (and away from a focus mostly on
Brazilian government to rebalance current investments to have R&D), to be able to increase productivity.
a policy mix that involves ambitious and risky mission-oriented
research projects, but also more general policy instruments In addition, cost is the number one barrier to innovation,
dedicated to solving challenges experienced by business or according to Brazilian firms. Technology imports have been
social sectors. subjected to significant tariff and non-tariff barriers that isolate
the country, its institutions and firms, from the innovation
While risky in nature, mission-oriented programmes can frontier. There is a negative impact on the import cost of
reap significant long-term rewards as shown by past technology embodied in machinery, equipment, tools,
experiences: aircraft technology research with Embraer; deep- blueprints, specialized inputs; and on disembodied forms
– information, technical assistance – usually encapsulated
sea oil exploitation technologies by Petrobras; and applied
in teams or individuals (capable of translating codified
biotechnology on soy crops from Embrapa. These successful
knowledge as carriers of tacit knowledge). Thus, for instance,
experiences are the ones that have markedly shaped the
the import of technical assistance entails a total tax wedge,
Brazilian economy. which falls between 36.6% and 49.7%.
Recommendations In terms of the workforce, part of the challenge is to promote
1. Design and implement a mission-oriented programme vocational education on a large scale and align the curriculum
with a focus on high-risk activities on the knowledge frontier of courses with business demands (O’Connell et al., 2017).
to attain specific goals. These programmes would have In engineering, adapting curricula is also critical; quantitative
an encouraging role in supporting greater public-private knowledge alone does not mean productivity for companies
partnerships. The focus must be on sectors and firms able – project management, technological innovation, cooperation
to compete globally and become an export platform. and other soft skills are needed. Attracting selected
2. Rebalance R&D investments to result-oriented projects international talent should also be considered a priority.
in partnership with sectoral ministries and agencies: for
instance, health, agriculture, defence, energy. The purpose The service sector is vital to the success of industry 4.0 and
would be to identify promising research areas across important for productivity growth. Most innovation policy
sectors that can potentially generate significant economic instruments remain focused on manufacturing and ignore the
or societal impact. interconnections between goods and services. This approach
3. Design mechanisms to accelerate innovation diffusion of overlooks the fact that the aggregate value of manufactured
large-scale projects to the private sector. goods relies increasingly on embedded services.
Proposed next steps In addition, it is necessary to support Brazilian companies
a) To pilot lower-risk mission-oriented projects to learn with different levels of innovation maturity, designing policies
and programmes specific to each type of company and to
how to operate these mechanism through public-private
offer a full package of interventions in a cost-efficient and agile
partnerships. Successful experiences can potentially be
manner. This will enhance the innovation capacity of the whole
scaled up.
country, not just a few large companies.
b) To identify vital priorities in sectoral areas and rebalance
S,T&I investments to address those challenges in Recommendations
partnership with their respective agencies. –– Increase firm managerial and technological capabilities
through activities oriented to productivity growth: for
Objective 3: Build firm capacity to accelerate technology example, technology adoption/absorption, infrastructure
adoption and advisory services, technical services, innovation
vouchers, technology extension, finance prototyping,
Context and analysis testing and commercialization phase.
The current context of technological change demands –– Attract R&D foreign investments to generate spillover
significant efforts to diffuse and adopt new technologies. effects and advance in global value chain activities.
However, this requires building the necessary absorptive –– Align technical training and engineering courses with
capacity to use new technologies effectively. For example, market needs and technological changes.
for a company to become competitive through technology
and innovation, several steps that go beyond R&D efforts Proposed next steps
must be fulfilled. Buying a new machine (physical capital) a) Rebalance public R&D investment to increase
requires training (employees) and specialized labour, a technological and managerial capacity of small and
good organization of the labour force and good integration medium enterprises.
in the production process. Similarly, R&D projects require b) Identify R&D products and services to negotiate tax
professionals with specialized knowledge to manage the reductions.
project efficiently but also good logistics and marketing
specialists to take the product of R&D successfully to the
market. Without these good managerial and organizational
practices, the impact of R&D spending will be insignificant.
Building managerial and organizational capacity is vital for
innovation. In the current context in Brazil, this would imply
rebalancing priorities towards management and technology
20 Brazil Competitiveness and Inclusive Growth Lab ReportYou can also read