Building Canada's Next Gold Mining District - Doris Mine and Plant
←
→
Page content transcription
If your browser does not render page correctly, please read the page content below
Building Canada’s Next Gold Mining District

                 Doris Mine and Plant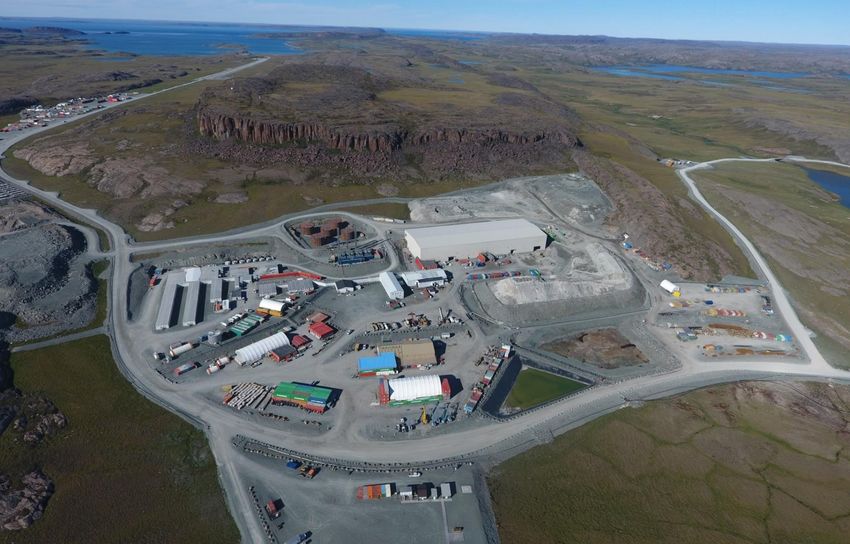
Caution Regarding Forward-Looking
    Information
This document contains “forward-looking information” within the meaning of applicable Canadian securities laws. Forward-looking information includes statements that use forward-looking terminology such as “may”, “could”,
“would”, “will”, “intend”, “plan”, “expect”, “budget”, “estimate”, “forecast”, “schedule”, “anticipate”, “believe”, “continue”, “potential” or the negative or grammatical variation thereof or other variations thereof or comparable
terminology. Such forward-looking information includes, without limitation, statements with respect to Mineral Reserve and Mineral Resource estimates; targeting additional Mineral Resources and expansion of deposits; the capital
and operating cost estimates and the economic analyses (including cashflow projections) from the Hope Bay Technical Report; the Company’s expectations, strategies and plans for the Hope Bay Project, including the
Company’s planned exploration and development activities; the results of future exploration and drilling and estimated completion dates for certain milestones; successfully adding or upgrading resources and successfully
developing new deposits; the costs and timing of future exploration and development, commencing production at Madrid in 2020 and at Boston in 2022; that the Company will "bootstrap" the development of Madrid and Boston;
the timing and amount of future production at Doris, Madrid and Boston and the capacity of the Gekko Plant to process production; the timing, receipt and maintenance of approvals, licences and permits from the federal
government, from the Kitikmeot Inuit Association (“KIA”) and Nunavut Tunngavik Inc. (“NTI”) and from any other applicable government or regulator; future financial or operating performance and condition of the Company and
its business, operations and properties; and any other statement that may predict, forecast, indicate or imply future plans, intentions, levels of activity, results, performance or achievements.
Forward-looking information is not a guarantee of future performance and is based upon a number of estimates and assumptions of management, in light of management’s experience and perception of trends, current conditions
and expected developments, as well as other factors that management believes to be relevant and reasonable in the circumstances, as of the date of this document including, without limitation, assumptions about: favourable
equity and debt capital markets; the ability to raise any necessary additional capital on reasonable terms to advance the development of the Hope Bay Project and pursue planned exploration; future prices of gold and other
metal prices; the timing and results of exploration and drilling programs; the accuracy of any Mineral Reserve and Mineral Resource estimates; the geology of the Hope Bay Project being as described in the Hope Bay Technical
Report; the metallurgical characteristics of the deposit being suitable for the Gekko Plant; the successful operation of the Gekko Plant; production costs; the accuracy of budgeted exploration and development costs and
expenditures, including to complete development of the infrastructure at the Hope Bay Project; the price of other commodities such as fuel; future currency exchange rates and interest rates; operating conditions being
favourable, including whereby the Company is able to operate in a safe, efficient and effective manner; political and regulatory stability; the receipt of governmental and third party approvals, licences and permits on favourable
terms; obtaining required renewals for existing approvals, licences and permits and obtaining all other required approvals, licences and permits on favourable terms; sustained labour stability; stability in financial and capital
goods markets; availability of equipment; positive relations with the KIA and NTI and other local groups and the Company’s ability to meet its obligations under its property agreements with such groups; the Company’s ability to
operate in the harsh northern Canadian climate; and satisfying the terms and conditions of the Debt Facility. While the Company considers these assumptions to be reasonable, the assumptions are inherently subject to significant
business, social, economic, political, regulatory, competitive and other risks and uncertainties, contingencies and other factors that could cause actual actions, events, conditions, results, performance or achievements to be
materially different from those projected in the forward-looking information. Many assumptions are based on factors and events that are not within the control of the Company and there is no assurance they will prove to be
correct.
Furthermore, such forward-looking information involves a variety of known and unknown risks, uncertainties and other factors which may cause the actual plans, intentions, activities, results, performance or achievements of the
Company to be materially different from any future plans, intentions, activities, results, performance or achievements expressed or implied by such forward-looking information. Such risks include, without limitation: general
business, social, economic, political, regulatory and competitive uncertainties; differences in size, grade, continuity, geometry or location of mineralization from that predicted by geological modelling and the subjective and
interpretative nature of the geological modelling process; the speculative nature of mineral exploration and development, including the risk of diminishing quantities or grades of mineralization and the inherent riskiness of Inferred
Mineral Resources; a material decline in the price of gold; a failure to achieve commercial viability, despite an acceptable gold price, or the presence of cost overruns which render the project uneconomic; geological,
hydrological and climactic events which may adversely affect infrastructure, operations and development plans, and the inability to effectively mitigate or predict with certainty the occurrence of such events; credit and liquidity
risks associated with the Company’s financing activities, including constraints on the Company’s ability to raise and expend funds as a result of operational and reporting covenants associated with the Debt Facility and the risk
that the Company will be unable to service its indebtedness; delays in construction or development of the Hope Bay Project resulting from delays in the performance of the obligations of the Company’s contractors and
consultants, the receipt of governmental approvals and permits in a timely manner or to complete and successfully operate mining and processing components; the Company’s failure to accurately model and budget future
capital and operating costs associated with the development and operation of the Hope Bay Project; difficulties with transportation and logistics relating to the delivery of essential equipment and supplies to the Hope Bay Project,
including by way of airlift and sealift, and the logistical challenges presented by the Hope Bay Project’s location in a remote Arctic environment; the failure to develop or supply adequate infrastructure to sustain the operation and
development of the Hope Bay Project, including the provision of reliable sources of electrical power, water, and transportation; adverse fluctuations in the market prices and availability of commodities and equipment affecting
the Company’s business and operations; the unavailability of specialized expertise in respect of operating in a remote, environmentally extreme and ecologically sensitive area in the Kitikmeot region of Nunavut; the Company’s
management being unable to successfully apply their skills and experience and attract and retain highly skilled personnel; the cyclical nature of the mining industry and increasing prices and competition for resources and
personnel during mining cycle peaks; the Company’s failure to maintain good working relationships with Inuit organizations; the Company’s failure to comply with laws and regulations or other regulatory requirements; the
Company’s failure to comply with existing approvals, licences and permits, and Inuit agreements; the Company’s inability to renew existing approvals, licences, permits and Inuit agreements or to obtain required new approvals,
licences, permits and Inuit agreements on timelines required to support development plans; the Company’s failure to comply with environmental regulations, the tendency of such regulations to become more strict over time, and
the costs associated with maintaining and monitoring compliance with such regulations; the adverse influence of third party stakeholders, including social and environmental non-governmental organizations; the adverse impact
of competitive conditions in mineral exploration and the mining business; the Company’s failure to maintain satisfactory labour relations and the risk of labour disruptions or changes in legislation relating to labour; the Company’s
lack of operating history and no history of earnings; the limits of insurance coverage and uninsurable risks; the adverse effect of currency fluctuations on the Company’s financial performance; difficulties associated with enforcing
judgements against directors residing outside of Canada; conflicts of interest; the significant control exercised by RCF and Newmont over the Company; the dilutive effect of future acquisitions or financing activities and the failure
of future acquisitions to deliver the benefits anticipated; the failure of the Company’s information technology systems or the security measures protecting such systems; the costs associated with legal proceedings should the
Company become the subject of litigation or regulatory proceedings; costs associated with complying with public company regulatory reporting requirements.

                                                                                                                                                                                                                                            32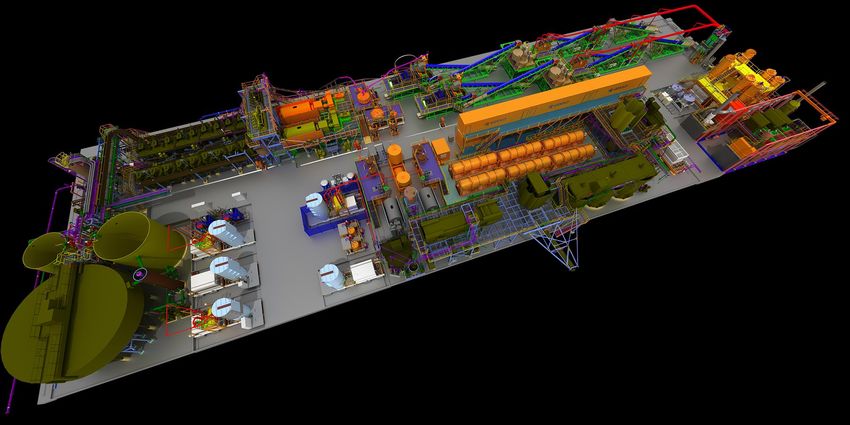
Remote But Not Isolated – Accessible Via
Tidewater

                                                                      160 km north of Arctic
                                                                      Circle

                                                                      Robert’s Bay on Bathurst
                                                                      Inlet in the Arctic Ocean

                                                                      Accessible via tidewater
                                                    Mary              from east and west
                                                    River

                             Hope Bay
                                                                      Sealift routes open mid-
                                                                      August to mid-October
                  Lupin     Back River
                                     Amaruq                 Iqaluit
              Diavik        Izok                                      Airstrip used for crew and
                    Ekati   Lake       Meadowbank                     cargo all year
    Yellowknife
                               Meliadine

                                                                                               33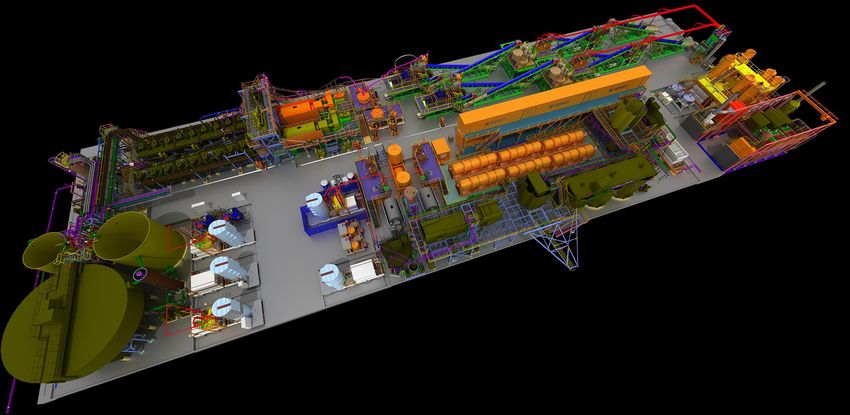
Hope Bay and Archean Greenstone Belts
                    Measured and Indicated Resources of 17.8 Mt at
                        8.6 g/t gold containing 4.9 M ounces
         Doris

           Madrid

80 km

             Boston

        20 km                                                        34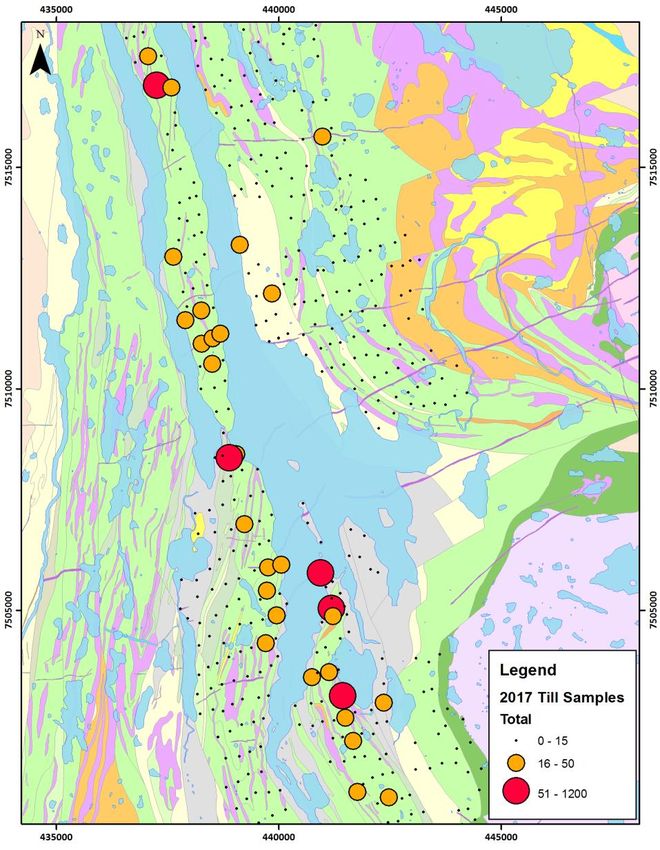
Abundance of Targets Near-Mine and
          Regionally
                                                     N                Doris                                                N

                                                                            Madrid

                              Doris
                                774,000 ozs Au Indicated
                                400,000 ozs Au Inferred
                                                                                      Hope Bay
                                                                                      Deformation
                                                                                      Zone
                             2nd Order
                             Structures

                                                                                                    Boston
                                             2.5km
 Hope Bay                                                  Boston                                     1,096,000 ozs Au Indicated
                                                                                                      330,000 ozs Au Inferred
 Deformation
 Zone

       Madrid
                                                                                     2.5km
2,759,000 ozs Au Indicated                                      >10g/t Au                                                  5
843,000 ozs Au Inferred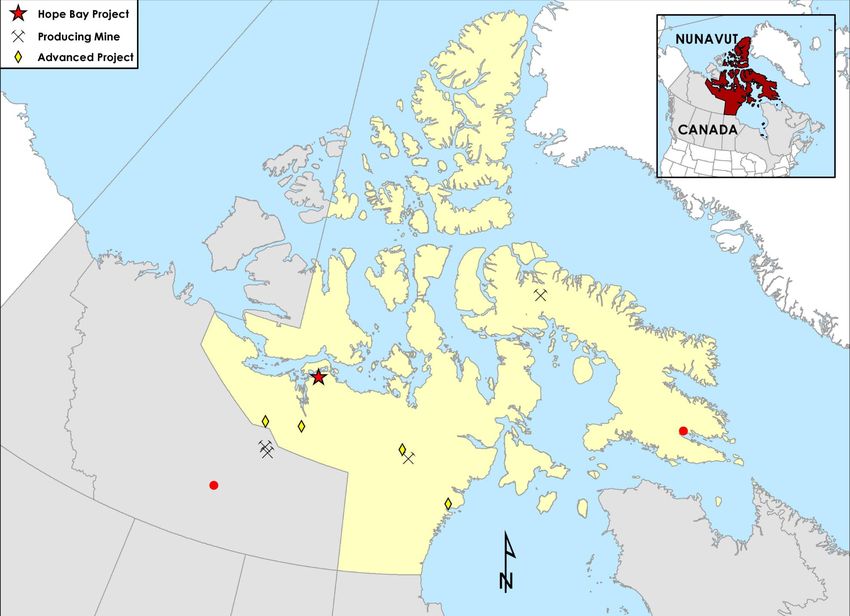
Potential to Grow Established Deposits at
Depth
     N                                        S N                    S   N                        S
                      Doris                    N    Madrid           S            Boston
                                                    Boston

     -500m                                                                7.6 g/t/17.3m
                               9.6 g/t 8.7m                              12.5 g/t/ 9.8m
     -1000m   13.9 g/t/ 1.0m
               7.5 g/t/ 2.0m                        12.4 g/t /4.2m
               7.0 g/t/ 1.1m
     -1500m
                                                                                      4.9 g/t/ 20.3m

     -2000m                                                              54.7 g/t/ 9.0m

     -2500m

                                    1 km                   1 km                            1 km

                                                                                                       36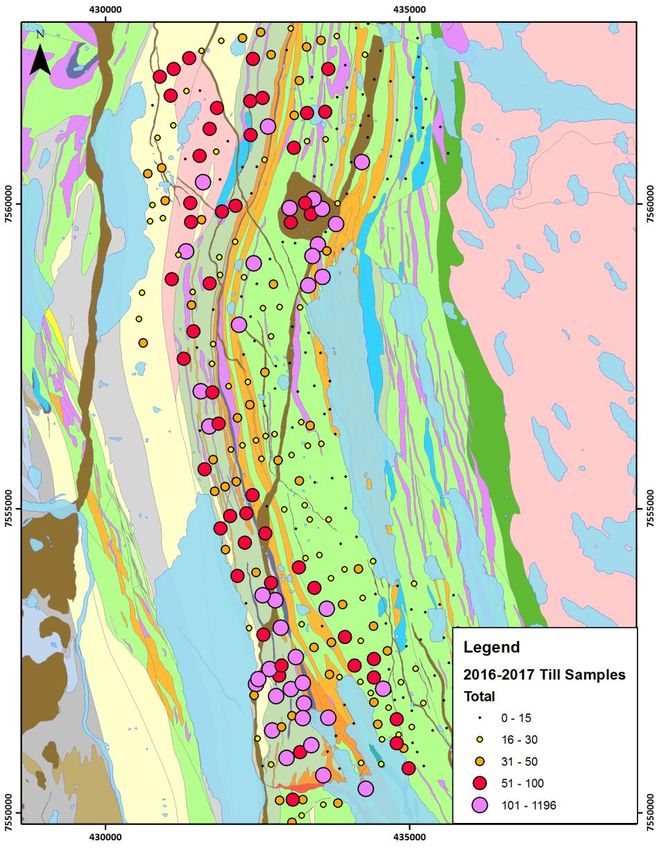
Canadian Archean Greenstone Belts
Vertical Extent

                                    7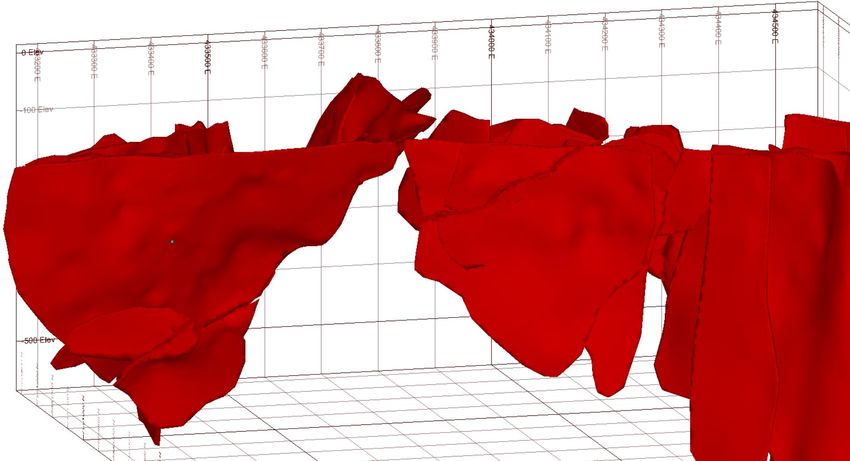
More than $1.5 Billion in Infrastructure
Doris Mine & Plant, Madrid and Boston Camps
    Roberts Bay

                      Doris Mountain                                 1988 to 1999

                       Fuel Tanks
                                        Processing Plant             1999 to 2007
     Accommodations    Power Plant                         Portal

                                                 Ore pad

                               Garage                                2007 to 2013
                  Warehouse

                                                                    2013 to present
                              Helipad                                            48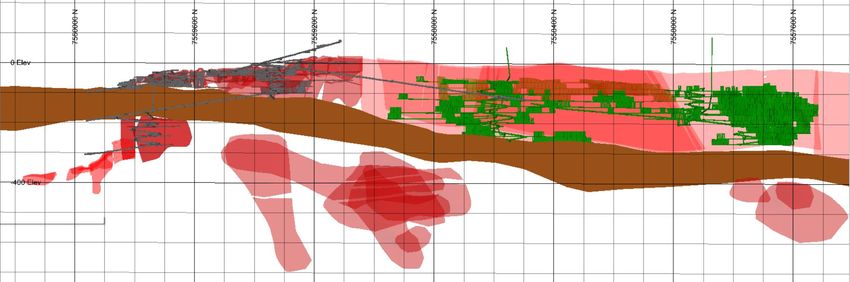
Senior Operating Team Established

                                 Gil Lawson
                         Chief Operating Officer
                               September 2017

 Mike Samuels       Dan Redmond          Dan Gagnon      Jerome Girard
Senior Director,   Director, Strategic     General        Asst. General
  Metallurgy         Mine Planning        Manager           Manager
   April 2018           April 2018        October 2017     March 2018

                                                                          39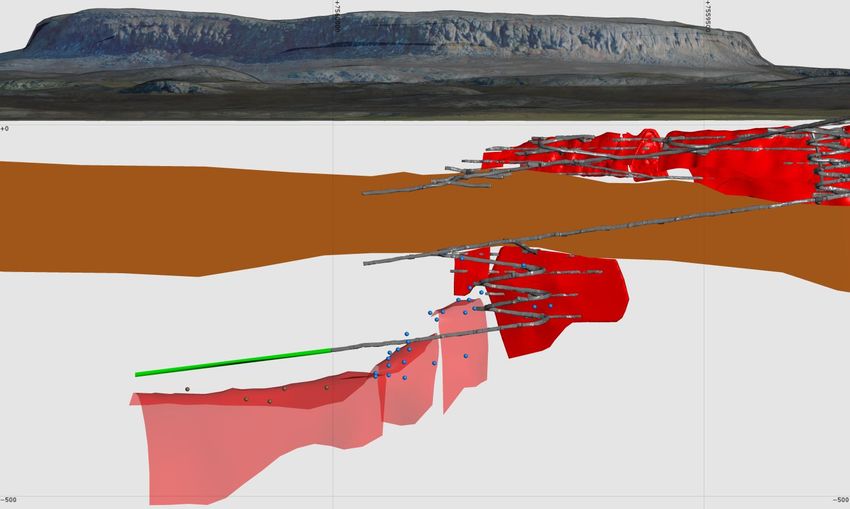
Processing Plant Improvements

Pending: Convert        Falcon SB400 (2)                                                   A
Cleaner Flotation
                                                                                                                        K
Cells to Roughers                  B
                         C                                                                            J
                    D
                                                                               I

                                                             G
                                                   E
                                                               H
                                                   F

                                       A. Multiple belt magnets                       G. Filter cake conveyor decommissioned
                                       B. Install pump for jig recirculation          H. Dewatering cone
                                       C. Cyclone feed distributor                    I. Commission second CILR train early
                                       D. Run scavenger flotation cells as roughers   J. Re-pipe regrind product to concentrate thickener
                                       E. Chemical oxidant                            K. Commission second resin column early
                                                                                                                                 10
                                       F. Upgrade of concentrate pumps
Further Gravity Concentration Enhancements
Replace Remove Cleaner
Falcon Jigs (2)
SB400 (2)
Falcon C2000 with
(2) – Scalping SB1350* (2)
Continuous
Grind/flotation feed tank
added to eliminate surge
New equipment
Relocating spinners (4) to crushing circuit
acquisition costDoris Processing Plant Improvements
Q4 2017 Q1 2018 April 2018 May 2018
Throughput (tpd) 760 930 1,120 932
Processed Grade (g/t) 13.7 10.9 7.7 12.7
Recovery (%) 69 71 76 83
Gold produced (oz) 21,200 20,650 6,367 9,850
Gold poured (oz) 19,151 18,832 6,746 10,108
Gold sold (oz) 17,350 19,540 Not yet published Not yet published
Initiatives Implemented - 2nd resin column - Cyclone - Falcon - Full month
installed distributor head concentrator operation of
- Dewatering cone brings stability to installed and Falcon
installed plant late ready end of April - Ordering
- Larger magnets January 2018 - Grew high-grade additional gravity
installed to - Oxidizing reagent stockpile to units
reduce steel improves 12,500 tonnes at - Prepared CL2 for
leaching in CTP 30 g/t startup.
(mid-Feb)
- Established high-
grade stockpile of
12
8,500t at 28g/tDoris Mine
N
Doris North ATD Connector Central
Production Infill Drilling
Development
Production
BTD East Limb
Infill Drilling BTD Connector BTD Central
BTD Extension
250 m
Category Tonnes Grade Ounces
(kt) (Au g/t) (koz) Drilling Development Production
• BTD Extension • Connector ATD • North ATD
Measured & Indicated 2,119 11.4 774 • Connector ATD • BTD East Limb
13
Inferred 1,521 8.2 400Doris North BTD Drilling Highlights
10TDD741 (Historical)
523 g/t Au over 5.6 m
Incl. 5,777 g/t Au over 0.5 m
High-Grade Doris
“Hinge”
N
TM50148
261.4 g/t Au over 7.1 m
Doris North
Incl. 2,710 g/t Au over 0.66 m
Diabase
Historical Drillhole
TM00058 (Historical) Referenced in text
112.8 g/t Au over 1.5m BTD East
2018 TMAC Drillhole
Limb
TM00132 (Historical) Existing
21.0 g/t Au over 2.0 m Development
TM50124 2018 Planned
13.3 g/t Au over 3.0 m Development
and 96.6 g/t Au over 2.9 m North Fault
Open BTD Extension
TM50152
71.8 g/t Au over 1.4 m 14
and 1,255 g/t Au over 1.5 m 100 mMadrid North and South Deposits
Madrid North Madrid South
Inferred &
Patch
Un-Classified
Suluk Wolverine
Naartok
Indicated Indicated
2018 Drilling
N
Suluk
Naartok
East Category Tonnes Grade Ounces
21.6 gpt/11.0 m (kt) (Au g/t) (koz)
Measured &Indicated 11,443 7.5 2,759
24.5 gpt/14.7 m Inferred 4,125 6.4 843
Naartok
West
15
31.3 gpt/11.0 m 250 mMadrid North Drilling Highlights
TM00375
11.5 g/t Au over 25.1 m
Naartok East
Incl. 18.1 g/t Au over 14.0 m
05PMD288 (Historical)
23.2 g/t Au over 15.9 m
PMD099 (Historical) N
33.1 g/t Au over 11.0 m
Rand
Naartok High-
Grade TM00371
West Plunge 6.0 g/t Au over 40.5 m Suluk
100 m
Historical Drillhole
TM00376
12.9 g/t Au over 50.0 m
2018 TMAC
Incl. 60.1 g/t Au over 8.5 m
Drillhole 16Boston Deposit
N 15.3 g/t Au/22.3m 22.0 g/t Au/17.55m
2017 Drillhole
Measured
15.9 g/t Au/18.4m
And
Indicated
Inferred
28.6 g/t Au/3.8m Un-Classified
Historical
56.6g/t Au/8.8m 28.5 g/t Au/7.1m
Historical 17.3 g/t Au/4.8m
46.6 g/t Au/7.8m
Historical
Category Tonnes Grade Ounces
(kt) (Au g/t) (koz)
Measured & Indicated 3,711 9.2 1,096 250 m
Inferred 1,393 7.4 330 17
17Balance Sheet, Cash Flow & Expenditures
Balance Sheet $27.1 M Unrestricted Cash
Liquidity $42.3 M Restricted Cash
(05/31/2018 ) Restricted cash to be released by LC-provider and fraction posted with insurance
companies (expected July closing)
Operations $10.9 M Cash flow from operations Q1-18
Increased mining grades and use of high grade stockpiles Q2-Q4
Expectations of improvement in recoveries – first step in May
CL2 now in commissioning and mine ramping up – both important to establishing
FCF
Sustaining capex, excl underground development, skewed in first half of 2018
Sealift ~$35 M remaining as at 05/31/18 (factors in diesel consignment)
Timing of sealift investment spend June to September
Debt Amortization US$6.5 M / quarter beginning Q4-18
US$30 M bullet payment Q1-19
Discretionary Madrid bulk sample - $10.5M (2018), $12.5M (2019)
18
Expenditures Boston, Madrid & regional explorationExecution and Strategic Focus
2018 Execution
• Continue to improve plant recovery from 83% in May
• Bring second concentrator on line to increase capacity to 2,000 tpd
• Ramp up mine to at least 1,500 tpd to feed increased plant capacity
Ongoing Strategic Focus
• Extend Doris mine life – focus on BTD exploration currently
• Explore and design mine at Madrid, including extracting bulk sample
• Explore Boston to determine project scope, mine design and
processing alternatives
• Secure all required permits
19Thank you / Quanaqqutin / Nakurmiik
20Share Capital Structure & Major Shareholders
As at May 31, 2018
Common Shares (Issued and Outstanding) 91,802,006
Share Incentive Options 4,834,500
Lenders Warrants – 1,900,000 @ C$15.43 – Expire Jul 31/22 & 433,834 @ C$7.50 – Exp. Jul 23/20 2,333,834
Restricted Shares 519,279
Director Share Units 31,249
Fully Diluted Shares 99,520,868
Percentage of Shares
Major Shareholders Number of Shares Outstanding
Resource Capital Fund VI L.P. 27,959,260 30.5
Newmont Mining Corporation 26,381,620 28.8
Blackrock, Inc 12,252,291 13.4
Directors and Officers 3,478,773 3.8
21
Kitikmeot Inuit Association 1,133,333 1.2Diesel Purchase and Storage Arrangement
PROCEDURE KEY TERMS / FEATURES
1. Macquarie steps into TMAC’s current fuel • Macquarie owns the fuel
purchase and delivery contract • No security required – not debt
2. Macquarie rents tanks from TMAC • Price = Cost of contract + Premium
3. TMAC will purchase the fuel from • Converts inventory working capital to
Macquarie as it lifts fuel from Roberts bay cash
tanks
22Environmental Bonding Product
Letter of credit agreement
Letters of
CIRNA
credit
Insurance
Company
Letters of
Demand Bond credit
KIA
23Debt Facility Summary
Principal
US$160 million No gold hedging required
Amount
Greater of US$ 3-mth LIBOR, and
Interest Rate 6.5% per annum plus
1.0%, compounded and payable quarterly.
Drawdowns Fully drawn Last draw July 26, 2017
US$6.5 M Quarterly October 31, 2018 – July 31, 2020
Payments US$30M Bullet January 31, 2019
US$5.5M Quarterly October 31, 2020 – April 30, 2022
Maturity Date July 31, 2022 Bullet payment of unpaid balance
Lenders received
Partial No standby fee – US$1.56M = to 2% of
Upfront – US$3.2M
Compensation outstanding amount at July 26, 2020
C$7.50 per share – 5 year to July 23, 2020
433,334 remaining of
Acceleration permitted
1,900,001 originally issued
Warrants C$15.43 per share – 5 year to July 31, 2022
Acceleration if shares > C$30.86 for 20 trading
1,900,000
days after July 26, 2018
24
Gold Calls 12,000 US$1,140/oz, five years to July 23, 2020Royalties & Taxes
Who What How Calculated
Kitikmeot Inuit
Association
NSR • 1% on Hope Bay. Not Elu.
Newmont/ • 1% on Hope Bay and Elu.
NSR • Maverix Metals Inc. entered into Purchase and Sale Agreement to
Maverix acquire a portfolio of royalties from Newmont including Newmont’s
royalty on Hope Bay and Elu. The transaction is expected to close shortly.
• On Inuit-Owned Land (Doris and Madrid)
Nunavut
• 12% of production (limit deductions to 75%
NPI of revenue (85% at Doris))
Tunngavik Inc.
• Deductions never lost and are carried
forward.
• On Crown Land (Boston & Elu)
Government of
Canada
NPI • Sum of graduated royalty rates from 0% to
25
14% of value of the output of the mineObligations
Who What
Kitikmeot Inuit Commercial Lease Payment
Association ($1.0 million per year plus inflation)
Production & Exploration Lease Payments
Nunavut Start 2017
Tunngavik Inc. $8 million payment (accrued in June 2017)
(payable over 8 quarters, $1 million each quarter)
Crown-
Indigenous
Claim & Lease Payments
Relations and
Northern Affairs
Property Taxes
Government of
(Relates to amount of infrastructure at Hope Bay)
Nunavut 26Doris Processing Plant – Design Changes
27Mineral Reserves (as at June 30, 2017)
Category/Deposit Tonnes Grade Contained Au
(t 000) (g/t Au) (oz 000)
Proven
Doris 493 15.8 250
Boston 657 8.5 180
Total Proven 1,150 11.6 430
Probable
Doris 1,652 8.3 442
Madrid North 8,350 6.7 1,802
Madrid South 692 10.3 230
Boston 2,687 8.1 703
Total Probable 13,381 7.4 3,177
Total P & P
Doris 2,145 10.0 692
Madrid North 8,350 6.7 1,802
Madrid South 692 10.3 230
Boston 3,343 8.2 883
Total P & P 14,531 7.7 3,607
28Mineral Resources (as at June 30, 2017)
Category/Deposit Tonnes Grade Contained Au
(t 000) (g/t Au) (oz 000)
Measured
Doris 281 22.9 207
Boston 608 10.3 201
Total Measured 889 14.3 408
Indicated
Doris 1,838 9.6 567
Madrid North 11,443 7.5 2,759
Madrid South 571 15.4 282
Boston 3,103 9.0 895
Total Indicated 16,954 8.3 4,503
Total M&I 17,843 8.6 4,911
Inferred
Doris 1,521 8.2 400
Madrid North 4,125 6.4 843
Madrid South 420 9.0 122
Boston 1,393 7.4 330
Total Inferred 7,459 7.1 1,694
29Information Regarding Scientific and
Technical Information
• Notes:
• CIM definitions were followed for Mineral Reserves and Mineral Resources.
• Numbers may not add due to rounding.
• Mineral Reserves are estimated using a cut-off grade of 4.4 g/t for Doris and Madrid North. Madrid South and Boston use
a 4.7 g/t Au cut-off grade.
• Mineral Reserves are estimated using an average long-term gold price of US$1250 per ounce and a US$/C$ exchange rate
of 0.85.
• A minimum mining width of 1.5 metres for longhole mining and 3 metres for Drift and Fill mining was used.
• Density was calculated using the geological block model density field.
• A 95% extraction factor was applied to longhole mining.
• The application of dilution varied by deposit, and depended on stope thickness.
• Mineral Resources are estimated at a cut-off grade of 4.0 g/t Au for Doris and Madrid North, and 4.5 g/t Au for Madrid
South and Boston.
• Mineral Resources are estimated using a long-term gold price of US$1400 per ounce, and a US$/C$ exchange rate of 0.85.
• A minimum mining width of approximately 1.5 metres was used.
• A 50 metre crown pillar allowance was applied to resources located below lakes.
• Doris North has been depleted based on surveyed mining cavities up to the end of May 2017. For the month of June
2017, a mathematical depletion was used based on production figures and the average dilution used for the Mineral
Reserve estimate for Doris North.
• Mineral Resources are inclusive of those resources converted to Mineral Reserves.
• Mineral Resources that are not Mineral Reserves do not have demonstrated economic viability.
30Information Regarding Scientific and
Technical Information
• Several slides reported intervals represent down-hole thickness; true width varies
depending on dip of the drill hole. True widths are estimated to be approximately
50% to 85% of down hole widths. Composite intervals are based on geological
observations. Gold values used to calculate composite intervals are uncut.
• Reported historical drill hole intersections have been obtained from TMAC Resources’
Hope Bay Drillhole Database which has been independently validated by Roscoe
Postle Associates Inc (“RPA”) and reported in Section 12 - Data Verification of the
“Technical Report on the Hope Bay Project Nunavut, Canada” dated May 28th, 2015.
• Please refer to the news published June 14, 2018 which is available from TMAC’s
website at www.tmacresources.com for the complete text of the release covering the
results of this work.
31Notes
32You can also read