By Mycle Schneider and Antony Froggatt with Julie Hazemann - A Mycle Schneider Consulting Project Paris, London, July 2012
←
→
Page content transcription
If your browser does not render page correctly, please read the page content below

By Mycle Schneider
                                       and Antony Froggatt
                                       with Julie Hazemann
Foto: Jörg Kohn

                                                         With the support of

                  A Mycle Schneider Consulting Project                         Hatzfeldt
                  Paris, London, July 2012                                     Foundation
       The World Nuclear Industry Status Report 2012

                                        By

                               Mycle Schneider
                    Independent Consultant, Paris, France
                         Project Coordinator and Lead Author

                                        and

                               Antony Froggatt
                    Independent Consultant, London, U.K.
                                       Author

                                        With

                                Julie Hazemann
                    Director of EnerWebWatch, Paris, France
                 Documentary Research, Modeling and Graphic Design

                           Paris, London, July 2012

                                     A
                         Mycle Schneider Consulting
                                   Project

                                 With the support of

                                                               Hatzfeldt Foundation
About the Authors


Mycle Schneider is an independent international consultant on energy and nuclear policy based in
Paris. He is a member of the International Panel on Fissile Materials (IPFM), based at Princeton
University, USA. He has provided information and consulting services to the Belgian Energy
Minister, the French and German Environment Ministries, the U.S. Agency for International
Development, the International Atomic Energy Agency, Greenpeace, the International Physicians for
the Prevention of Nuclear War, the Worldwide Fund for Nature, the European Commission, the
European Parliament’s Scientific and Technological Option Assessment Panel and its General
Directorate for Research, the Oxford Research Group, and the French Institute for Radiation
Protection and Nuclear Safety. Mycle has given evidence and held briefings at Parliaments in
thirteen countries. Between 2004 and 2009, he was in charge of the Environment and Energy
Strategies lecture of an International MSc at the French Ecole des Mines in Nantes. He has given
lectures at fourteen universities around the globe. He founded the Energy Information Agency
WISE-Paris in 1983 and directed it until 2003. In 1997, along with Japan’s Jinzaburo Takagi, he
received the Right Livelihood Award, also known as the “Alternative Nobel Prize.”

Antony Froggatt works as independent European energy consultant based in London. Since 1997,
he has worked as a freelance researcher and writer on energy and nuclear policy issues in the EU and
neighboring states. He has worked extensively on EU energy issues for European governments, the
European Commission and Parliament, environmental NGOs, commercial bodies, and media. He has
given evidence to inquiries and hearings in the parliaments of Austria, Germany, and the EU. He is a
part time senior research fellow at the Royal Institute of International Affairs – Chatham House in
London. He is a regular speaker at conferences, universities, and training programs across the region.
Prior to working freelance, Antony served for nine years as a nuclear campaigner and coordinator for
Greenpeace International.

Acknowledgments
The authors wish to thank Amory B. Lovins, Chris Paine, Hermann Hatzfeldt, Yves Marignac,
Reiner Metzger, Bernhard Piller, Philippe Rekacewicz, Philippe Rivière, Luis Speciale, Le Monde
Diplomatique, Paris, Die Tageszeitung, Berlin, Swiss Renewable Energy Foundation and the
Natural Resources Defense Council (NRDC), Washington, D.C. for their support for this project.
A big thank you to John Corbett for his extensive research assistance on finances and to Jörg Kohn
for designing the original cover page.
The report has greatly benefitted from proof-reading, editing suggestions and comments by Shaun
Burnie, Amory B. Lovins, Lutz Mez, Walt Patterson, MV Ramana, Sabine von Stockar and Steve
Thomas.
Special thanks to Julie Hazemann, for—besides everything else—repeatedly making extra time
available while there was none left to begin with.

Note
This report contains a very large amount of factual and numerical data. While we do our utmost to
verify and double-check, nobody is perfect. The authors are always grateful for corrections and
suggestions of improvement.

                                            Authors’ Contacts
                         Mycle Schneider                    Antony Froggatt
                         45, allée des deux cèdres          53a Nevill Road
                         91210 Paris                        London N16 8SW
                         France                             United Kingdom
                         Phone: +33-1-69 83 23 79           Ph: +44-20-79 23 04 12
                         Email: mycle@orange.fr             E: a.froggatt@btinternet.com


Mycle Schneider, Antony Froggatt             World Nuclear Industry Status Report 2012                   2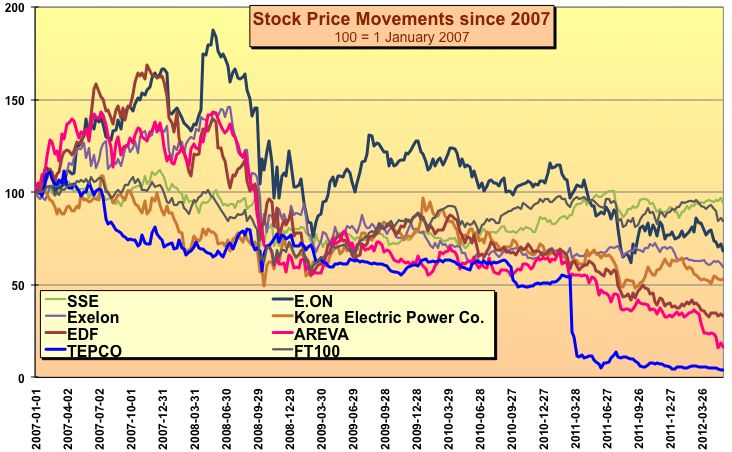
Table of Contents
Executive Summary & Conclusions................................................................................................... 4
Introduction ......................................................................................................................................... 9
General Overview Worldwide .......................................................................................................... 10
Overview of Operation, Power Generation, Age Distribution .................................................... 11
Overview of Current New Build ................................................................................................. 14
Potential Newcomer Countries ......................................................................................................... 21
Projects and programs officially abandoned in 2011 ...................................................................... 28
Unfulfilled Promises .......................................................................................................................... 29
Unrealistic Projections..................................................................................................................... 29
Construction Times of Past and Currently Operating Reactors ...................................................... 30
Construction Times and Costs of Reactors Currently Under Construction .................................... 32
Watts Bar-2 – 43 Years Construction .......................................................................................... 32
EPR – European Problem Reactor .............................................................................................. 32
Financial Markets and Nuclear Power ............................................................................................ 35
Financial Institutions’ Views of Nuclear Power ............................................................................. 35
Credit Rating Agencies and Nuclear Power .................................................................................... 36
Market Value ................................................................................................................................... 38
Book Value ...................................................................................................................................... 39
Nuclear Power vs. Renewable Energy Deployment ....................................................................... 41
Investment ....................................................................................................................................... 41
Installed Capacity ............................................................................................................................ 42
Electricity Generation ...................................................................................................................... 45
The Renewables and Nuclear Cost Cross-Over .............................................................................. 48
Grid Parity ................................................................................................................................... 48
Nuclear vs. Renewable Costs ...................................................................................................... 49
Annexes ............................................................................................................................................... 51
Annex 1. Overview by Region and Country ....................................................................................... 52
Africa ............................................................................................................................................... 52
The Americas................................................................................................................................... 53
United States Focus ..................................................................................................................... 56
Asia .................................................................................................................................................. 59
China Focus ................................................................................................................................. 59
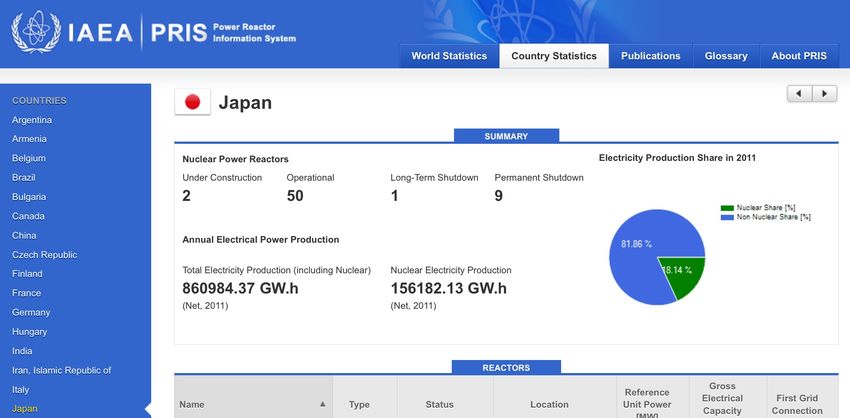
Japan Focus ................................................................................................................................. 63
European Union (EU27) and Switzerland ....................................................................................... 68
Western Europe ........................................................................................................................... 70
France Focus ............................................................................................................................ 72
Germany Focus ........................................................................................................................ 74
U.K. Focus ............................................................................................................................... 78
Central and Eastern Europe ......................................................................................................... 81
Former Soviet Union ....................................................................................................................... 86
Annex 2: Reactor Construction Times 1992-2012 .............................................................................. 90
Annex 3: Construction and Operating License (COL) Applications in the U.S. ................................ 91
Annex 4: Construction Times in the U.S. and France ......................................................................... 92
Annex 5: Definition of Credit Rating by the Main Agencies .............................................................. 93
Annex 6: Abbreviations ....................................................................................................................... 94
Annex 7. Status of Nuclear Power in the World (1 July 2012) ........................................................... 96
Annex 8. Nuclear Reactors in the World Listed as “Under Construction” (1 July 2012) ................... 97
Mycle Schneider, Antony Froggatt World Nuclear Industry Status Report 2012 3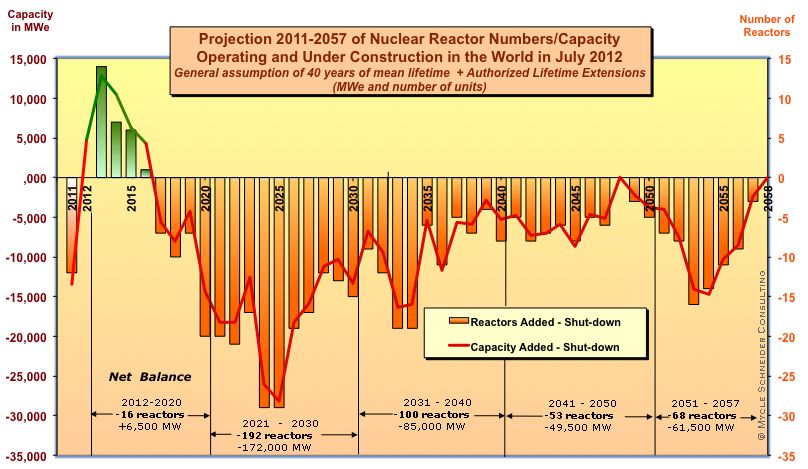
Executive Summary & Conclusions

Twenty years after its first edition, World Nuclear Industry Status Report 2012 portrays an industry
suffering from the cumulative impacts of the world economic crisis, the Fukushima disaster,
ferocious competitors and its own planning and management difficulties.
The report provides a global overview of the history, the current status and trends of nuclear power
programs in the world. It looks at units in operation and under construction. Annex 1 also provides
detailed country-by-country information. A specific chapter assesses the situation in potential
newcomer countries. For the first time, the report looks at the credit-rating performance of some of
the major nuclear companies and utilities. A more detailed chapter on the development patterns of
renewable energies versus nuclear power is also included.
The performance of the nuclear industry over the 18 months since the beginning of 2011 can be
summed up as follows:

                                                                                                                                                                                                                   Reactor Status and Nuclear Programs
                             • Startups and Shutdowns. Only seven reactors started up, while 19 were shut down in 20111
                                 and to 1 July 2012, only two were started up, just compensating for two that were shut down
                                 so far this year. As of end of June 2012 no reactor was operating in Japan and while two
                                 units at Ohi have got restart permission, it remains highly uncertain, how many others will
                                 receive permission to restart operations.
                             • Nuclear Phase Out Decisions. Four countries announced that they will phase out nuclear
                                 power within a given timeframe: Belgium, Germany, Switzerland and Taiwan.
                             • Newcomer Program Cancellations. At least five countries have decided not to engage or re-
                                 engage in nuclear programs, although they had previously planned to do so: Egypt, Italy,
                                 Jordan, Kuwait, and Thailand.
                             • New Nuclear Countries. Iran became the first country to start commercial operation of a new
                                 nuclear power program since Romania in 1996.

                                                                                                                                                                                                                                       Construction & New Build Issues
                             • Construction Cancellation. In both Bulgaria and Japan two reactors under construction were
                                 abandoned.
                             • Construction Starts. In 2011, construction began on four reactors and two so far in 2012.
                             • New Build Project Cancellation. In Brazil, France, India and the United States new build
                                 projects were officially cancelled. In the Netherlands, the U.K. and the U.S. key utilities
                                 withdrew leaving projects in jeopardy.
                             • Certification Delays. The certification of new reactor technologies has been delayed numerous
                                 times. The latest announcement concerns the certification in the U.S. of the Franco-German
                                 designed EPR2 that was pushed back by 18 months to the end of 2014.
                             • Construction Start Delays. In various countries firmly planned construction starts were
                                 delayed, most notably in China, where not a single new building site was opened, but also in
                                 Armenia, Finland and the U.S.


1
  We define shut down as definitively taken off the grid. This includes the 10 Fukushima reactors, of which
four are destroyed; units 5 and 6 at Daiichi and the four reactors at Daiini remain in cold shutdown and are
almost certain never to operate again. However, their definitive closure has not yet been officially confirmed.
2
  European Pressurized Water Reactor (in Europe) or Evolutionary Pressurized Water Reactor (in the U.S. and
elsewhere).

Mycle Schneider, Antony Froggatt                                                                                                                                                                                                                         World Nuclear Industry Status Report 2012   4
                             • Construction License Delays. In the U.S. licensing applications for 28 reactors were received
                                 for the first time in over three decades in a two-year period between July 2007 and June
                                 2009, but nothing since. Of the 28 applications, 16 were subsequently delayed and eight
                                 were suspended indefinitely or officially cancelled. However, for the first time in over 30
                                 years two construction licenses were issued.
                             • Construction Delays. Of the 59 units under construction in the world, at least 18 are
                                 experiencing multi-year delays, while the remaining 41 projects were started within the past
                                 five years or have not yet reached projected start-up dates, making it difficult to assess
                                 whether they are running on schedule. On construction delays the U.S. Watts-Bar-2 project
                                 holds the record. Construction started in 1973 and grid connection was finally planned for
                                 2012, but was delayed again until “late 2015 or 2016”.
                             • Newcomer Countries. The analysis of a number of potential newcomer countries3 shows that
                                 few, if any, new members of the nuclear operators club to be expected over the next few
                                 years. No financing agreements are in place for any of the cases studied, many of them have
                                 to deal with significant public opposition, especially after the Fukushima accident and often
                                 they lack a skilled workforce and appropriate legal framework. Some countries have to deal
                                 with particularly adverse natural conditions (earthquake and flooding risks, lack of cooling
                                 water access, etc.). Finally, nuclear power’s principle competitors, mainly renewables and
                                 natural gas on the production side, increasingly are more affordable and much faster to
                                 install.

                                                                                                                                                                                                                                                         Economics & Finances
                             • Cost Increases. Construction costs are a key determinant of the final nuclear electricity
                                 generating costs and many projects are significantly over budget: The U.S. Watts-Bar-2
                                 reactivation project alone increased by 60 percent over the past five years; the EPR cost
                                 estimate has increased by a factor of four (adjusted for inflation) over the past ten years.
                             • Credit Rating. Of eleven assessed nuclear companies and utilities, seven were downgraded by
                                 credit rating agency Standard and Poor’s over the past five years; four companies remained
                                 stable, while none were upgraded over the same period. Rating agencies consider nuclear
                                 investment risky and “a nuclear project could be the thing that pushes [the utility] over the
                                 edge—it's just another negative factor”, explains Moody’s. On the contrary, the rating
                                 agency welcomed the decision by German utilities RWE and E.ON to pull the plug on their
                                 U.K. new build plans as they “can instead focus on investment in less risky projects”.
                                 Similarly, electronics giant Siemens announcement to entirely withdraw from nuclear power
                                 “frees up funds that Siemens can redeploy in businesses with better visibility”. Both
                                 decisions are consequently considered “credit positive”.
                             • Share Value. The assessment of a dozen nuclear companies reveals that all performed worse
                                 than the UK FTSE100 index, the only exception being Scottish SSE, which has recently
                                 pulled out of plans to build nuclear plants in the UK. TEPCO, owner of the devastated
                                 Fukushima site, lost 96% of its share value since 2007. Over the same time period, more
                                 surprisingly, the shares of the world’s largest nuclear operator, French state utility EDF, lost
                                 82 percent of their value, while the share price of the world’s largest nuclear builder, French
                                 state company AREVA, fell by 88 percent.


3
 Bangladesh, Belarus, Indonesia, Jordan, Poland, Saudi Arabia, Thailand, Turkey, United Arab Emirates, and
Vietnam. As indicated, programs were officially abandoned in Egypt, Italy and Kuwait.

Mycle Schneider, Antony Froggatt                                                                                                                                                                                                                            World Nuclear Industry Status Report 2012   5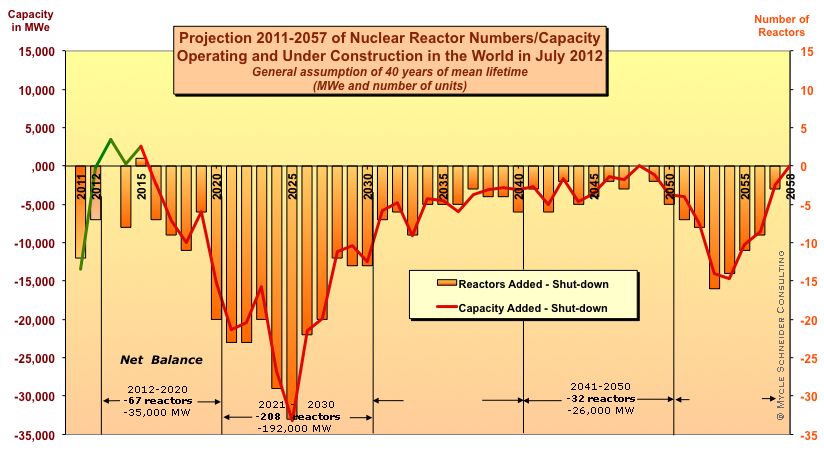
                                                                                                                                                               Nuclear Power vs. Renewable Energy Deployment
In contrast to many negative indicators for nuclear power renewable energy development has
continued with rapid growth figure. This has taken place during the ongoing international economic
crisis, significant cuts in guaranteed feed-in tariffs and worldwide manufacturing overcapacities.
• Investment. Global investment in renewable energy totaled US$260 billion in 2011, up five
    percent from the previous year and almost five times the 2004 amount. Considering a 50 percent
    unit price drop over the past year, the performance of solar photovoltaics (PV) with
    US$137 billion worth of new installations, an increase of 36 percent, is all the more impressive.
    The total cumulative investment in renewables has risen to over US$1 trillion since 2004,
    according to Bloomberg New Energy Finance, this compares to our estimate of nuclear power
    investment decisions of approximately $120 billion over the same time period. The rise and fall
    of nuclear investments is essentially due to the evolution of the Chinese program, with
    40 percent of current worldwide construction.
• Installed Capacity. Installed worldwide nuclear capacity decreased in the years 1998, 2006, 2009
    and again in 2011, while the annual installed wind power capacity increased by 41 GW4 in 2011
    alone. China constitutes an accelerated version of this global pattern. Installed wind power
    capacity grew by a factor of 50 in the past five years to reach close to 63 GW, five times more
    than the installed nuclear capacity and equivalent to the French nuclear fleet.5 Solar capacity was
    multiplied by a factor of 47 in those five years to reach 3.8 GW, while nuclear capacity increased
    by a factor of 1.5 to 12 GW. Since 2000, within the European Union nuclear capacity decreased
    by 14 GW, while 142 GW of renewable capacity was installed, 18 percent more than natural gas
    with 116 GW.6
• Electricity Generation. The quantity of electricity produced by nuclear power plants globally has
    been increased only slightly over the past decade and as a result its contribution to the global
    energy mix is decreasing as other sources accelerate production. In 2011 wind turbines produced
    330 TWh more electricity than it did at the turn of the century, which is a four times greater
    increase than was achieved by the nuclear sector over the same period. The growth in solar PV
    generated power has been impressive in the last decade and especially in the past few years, with
    a tenfold increase in the past five years. In Germany, for the first time, power production from
    renewables at 122 TWh (gross), only second to the contribution of lignite 153 TWh, exceeded
    coal’s 114.5 TWh, nuclear power’s 102 TWh and natural gas’ 84 TWh. The German renewable
    electricity generation thus corresponded to 29 percent of French nuclear production. One should
    recall that France generates almost half of the European Union’s nuclear electricity. In China,
    just five years ago, nuclear plants were producing ten times as much electricity as wind, by 2011
    the difference had shrunk to less than 30 percent.
• Grid Parity. Grid parity occurs when the unit costs of renewable energy is equal to the price that
    end users pay for their electricity. Grid parity for solar photovoltaic power has already happened
    in a number of markets and regions with particular conditions. Several assessments expect that
    this will become a worldwide phenomenon within less than a decade. This will radically change
    the incentives for further large scale expansion of solar facilities around the world.

                                                                                                                                                                                                                         Lifetime Extensions and Stress Tests
As a result of insufficient new capacities coming online, the average age of the world’s operating
nuclear fleet continues to increase and now stands at 27 years. Assuming a 40-year lifetime,
67 additional units or 35 GW would have to be ordered, built and commissioned by 2020, beyond the
units already under construction, just to maintain the status quo. This is an unlikely scenario,


4
  GW stands for gigawatt or thousand megawatt.
5
  Note that nuclear plants usually generate between two and five times more electricity per installed GWe than
wind turbines.
6
  Note that the electricity generation per installed GWe varies considerably between energy sources.

Mycle Schneider, Antony Froggatt                                                                                                                                                                                                                         World Nuclear Industry Status Report 2012   6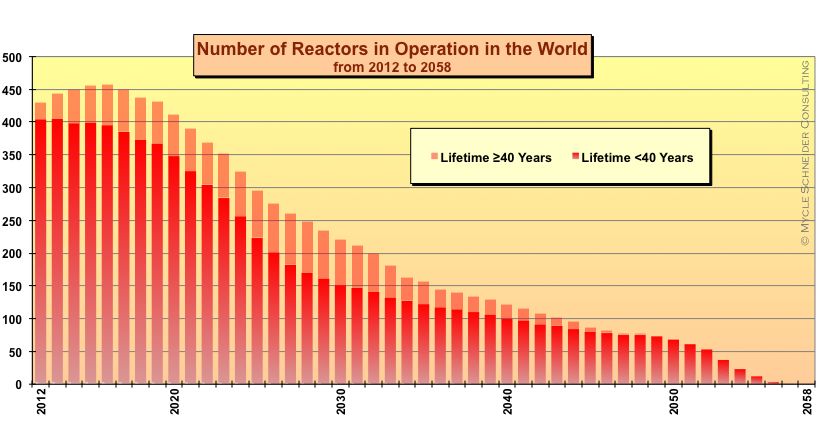
although not entirely impossible, if China were to restart building large numbers of reactors.
Furthermore, as our lifetime extension projections illustrate, the systematic prolonged operation of
reactors up to licensed limits (up to 60 years) would not fundamentally change the problem of the
industry.7 An additional 19 reactors would have to begin operation in order to break even by 2020,
but the installed capacity would be slightly positive (+4 GW). This scenario is possible, but will
require a number of specific conditions including that the generalized lifetime extension is
technically feasible, economically attractive and publicly and politically acceptable.
Plant life extension seems the most likely survival strategy of the nuclear industry at this point. The
French case illustrates this. As the French Court of Audits has calculated, eleven EPRs would have
to be built in France by the end of 2022 in order to maintain the current nuclear share. “This seems
highly unlikely, if not impossible, including for industrial reasons”, the Court comments and
concludes: “This implies one of two things: a) either it is assumed that plants will operate for more
than 40 years (…); b) or the energy mix will move towards other energy sources. However, no clear
public decision has been made concerning these major strategic issues, even though they call for
short-term action and major investments.” An appropriate description for the situation in many
nuclear countries.
Serious questions need to be raised about the extent to which the lessons of Fukushima are being
even considered by today’s nuclear operators. There are around 400 nuclear power reactors in
operation and in the absence of a major new build the nuclear industry is pushing to keep those units
operating as long as possible. The fact that one third of the nuclear countries generated their historic
maximum of nuclear electricity in 20118 raises the troubling question of the depth of the nuclear
safety assessments or so-called “stress tests” carried out around the world after 3/11. This study did
not assess safety issues, but if plant life extension becomes the only future for the industry, the
pressure on safety authorities will grow substantially.

                                                                                                                                                                                                                                                           Conclusion
Prior to the March 2011 (3/11) Fukushima disaster, the nuclear industry had made it clear that it
could not afford another major accident. Over the past ten years the industry has sold a survival
strategy to the world as the nuclear revival or its renaissance. In reality many nuclear companies and
utilities were already in great difficulties before the triple disaster hit the Japanese east coast in 2011.
Fifteen months after 3/11, it is likely that the decline of the industry will only accelerate. Fukushima
continues to have a significant impact on nuclear developments everywhere. Fifteen years ago,
nuclear power provided over one third of the electricity in Japan, but as of May 2012 the last
operating reactor was closed. The Japanese government is facing massive opposition to nuclear
power in the country, thus making the restart of any reactors difficult. The controversy over the
restart permission for the Ohi reactors in the Kansai region illustrates the dilemma. Germany shut
down half of its nuclear fleet after 3/11. Japan and Germany could be leading a new trend. The
German direction is clear with the possibility of Japan following: an electricity system based on
highly efficient use and renewable energy technologies, even if many questions remain, including the
timescale, local versus centralized, grid transformation and smart system development. It appears
increasingly obvious that nuclear systems are not competitive in this world, whether from systemic,
economic, environmental or social points of view.
The nuclear establishment has a long history of failing to deliver. In 1973-1974, the International
Atomic Energy Agency (IAEA) forecasted an installed nuclear capacity of 3,600-5,000 GW in the
world by 2000, ten times what it is today. The latest example was from Hans Blix, former Director
General of the IAEA, who stated two months after 3/11: “Fukushima is a bump in the road…”. The
statement is both crass and far from today’s reality.


7
         It raises a whole range of safety related issues that we have not analyzed in this report.
8
         Brazil, China, Czech Republic, Hungary, India, Iran, South Korea, Pakistan, Russia, Taiwan

Mycle Schneider, Antony Froggatt                                                                                                                                                                                                                         World Nuclear Industry Status Report 2012   7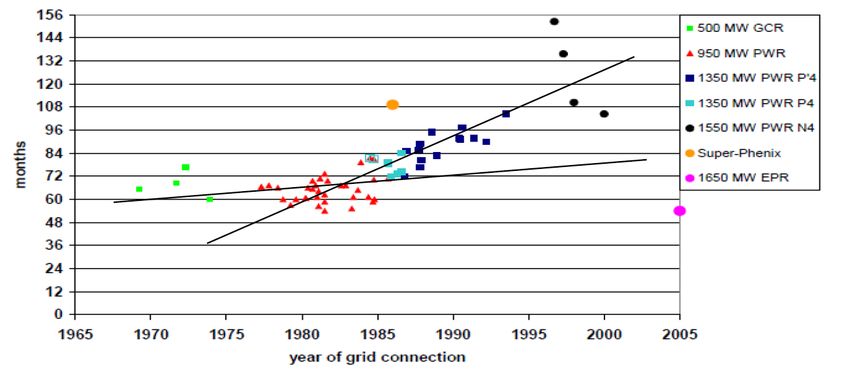
                                                                                                                                                                           Operation and Construction Data as of 1 July 20129
Operation. There are 31 countries operating nuclear power plants in the world10, one more than a year ago,
with Iran finally starting up the Bushehr reactor that had been under construction since 1975. A total of
429 reactors combine an installed capacity of 364 GWe11. These figures assume the final shutdown of the ten
Fukushima reactors. It should be noted that as of 5 July 2012 only one (Ohi-3) of the 44 remaining Japanese
reactors is operating and their future is highly uncertain. This compares to the historical maximum of
444 reactors in 2002. Installed capacity peaked in 2010 at 375 GWe before declining to the level of a decade
ago. Nuclear electricity generation reached a maximum in 2006 with 2,660 TWh and dropped to 2,518 TWh in
2011 (down 4.3 percent compared to 2010), while the nuclear share in the world’s power generation declined
steadily from a historic peak of 17 percent in 1993 to about 11 percent in 2011.
Construction. There are 13 countries currently building nuclear power plants, two fewer than a year ago with
Iran starting up its plant and Bulgaria abandoning construction at the two Belene units where work had started
in 1987. Japan halted construction at two sites (Ohma and Shimane-3) and Pakistan started construction on two
units (Chasnupp-3 and -4). There are currently 59 reactors under construction with a total capacity of 56 GW.
However:
•                             Nine reactors have been listed as “under construction” for more than 20 years.
•                             Four additional reactors have been listed for 10 years or more.
•                             Forty-three projects do not have an official (IAEA) planned start-up date.
•                             At least 18 of the 59 units listed by the IAEA as “under construction” have encountered construction
                              delays, most of them multi-annual. Of the remaining 41 reactor units construction began either within the
                              past five years or they have not reached projected start-up dates yet. This makes it difficult or impossible
                              to assess whether they are on schedule or not.
Nearly three-quarters (43) of the units under construction are located in three countries: China, India and
Russia.


9
  See table in Annex 7 for a country-by-country overview of reactors in operation and under construction as
well as the nuclear share in electricity generation and primary energy.
10
   Unless otherwise noted, the figures indicated are as of 1 July 2012.
11
   All figures are given for nominal net electricity generating capacity. GW stands for gigawatt or thousand
megawatt.

Mycle Schneider, Antony Froggatt                                                                                                                                                                                                                         World Nuclear Industry Status Report 2012   8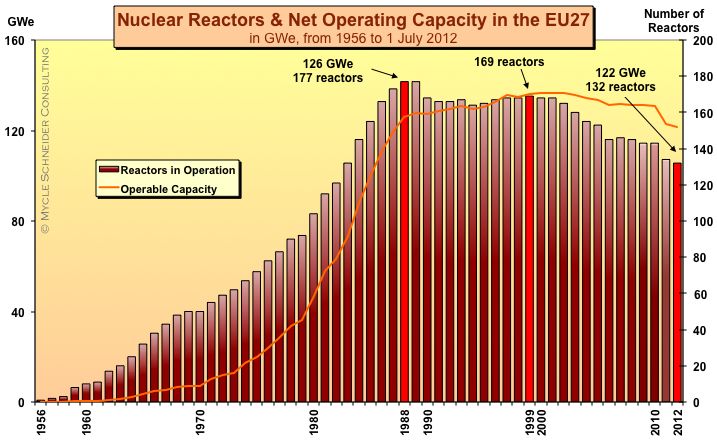
Introduction
                                         The Chernobyl disaster "caused such a negative opinion of nuclear
                                            energy that, should such an accident occur again, the existence
                                                  and future of nuclear energy all over the world would be
                                                                                            compromised."
                                                   World Association of Nuclear Operators (WANO), 1996
The triple disaster earthquake-tsunami-nuclear accident that hit Japan on 11 March 2011 had a
profound impact on environmental, economic and energy policy not just in Japan but far beyond.
The Japanese people were and are deeply traumatized by the aftermath of the tragedy now widely
known as 3/11. Trust in political leaders was shaken, confidence in apparently superior technology
destroyed. In China the government froze all new nuclear projects and the public became aware of
the nuclear power issue through the disastrous events in its neighbouring country. In South Korea
public support for nuclear power plummeted. Governments in many countries are reviewing their
nuclear plans. Belgium and Germany confirmed nuclear phase-out legislation by 2025 and 2022
respectively. The Netherlands and Switzerland have abandoned new reactor build projects.
The expression of opposition to nuclear programs is changing. In Japan, on 28 April 2012,
64 mayors and 6 former mayors from 35 prefectures have started a network with the aim of creating
communities that do not rely on nuclear energy, with the ultimate aim of achieving a nuclear-free
Japan. Members include the heads of the cities of Sapporo, Nagoya, the 3/11-striken town of
Minamisoma and Tokyo’s Setagaya Ward as well as Tokai-mura’s mayor. Tokai-mura hosts the
nuclear power plant closest to Tokyo, which has not operated since 3/11.
On 5 May 2012, the last operating reactor went offline in Japan. The local authorities play a key role
in preventing the restart of nuclear plants in Japan as an unwritten law requires their approval prior to
operating. Local authorities have increasingly raised their voices in other countries. In South Korea
the mayor of Seoul has vowed to reduce energy consumption of the city in order to save the
equivalent of the output of a nuclear reactor. Even in China, a local authority has voiced opposition
to the construction of the Pengze nuclear plant in a neighboring district. In France, several dozen
municipalities, including the city of Strasbourg, have voted a motion requesting the closure of the
Fessenheim nuclear plant.
In 1992, in order to assess the impact of the Chernobyl disaster on the global nuclear industry and the
resultant trends, Greenpeace International, WISE-Paris and the Washington based Worldwatch
Institute jointly published the first World Nuclear Industry Status Report. “Many of the remaining
plants under construction are nearing completion so that in the next few years worldwide nuclear
expansion will slow to a trickle”, we wrote. “It now appears that in the year 2000 the world will have
at most 360,000 megawatts of nuclear capacity – only ten percent above the current figure.” The
actual figure for 2000 was an installed capacity of 356,600 MW. “Not only coal plants, but also new,
highly efficient natural gas plants, and new technologies such as wind turbines and geothermal
energy, are all substantially less expensive than new nuclear plants. The market niche that nuclear
power once held has in effect gone”, we concluded twenty years ago. In 2012, reality has confirmed
that assessment and nuclear power’s competitors have most definitely taken over as this latest report
demonstrates.

Mycle Schneider, Antony Froggatt           World Nuclear Industry Status Report 2012                          9
General Overview Worldwide
                                                                                                                                                     Even before the Fukushima disaster,
                                                                                                                                         the long-awaited nuclear renaissance in the West
                                                                                                                                                       seemed to be running out of steam.
                                                                                                                                                                                                                     Energy Economist
                                                                                                                                                                                                                        February 2012

As of the middle of 2012, a total of 31 countries were operating nuclear fission reactors for energy
purposes—one more than in 2010–11, with Iran finally starting up its Bushehr reactor, construction
of which began in 1975. Nuclear power plants generated 2,518 Terawatt-hours (TWh or billion
kilowatt-hours) of electricity in 201112, the same as in 2001 and a 112 TWh or 4.3 percent decrease
compared to 2010, which is 5.3 percent less than the historic maximum in 2006. The maximum share
of nuclear power in commercial electricity generation worldwide was reached in 1993 with
17 percent (see figure 1). It has dropped to 11 percent in 2011, a level last seen in the early 1980s.
This decline in 2011 corresponds to more than the annual nuclear generation in all but five of the
nuclear countries. The decline is exclusively caused by the substantial drop in Japan (124 TWh or
44 percent), Germany (31 TWh or 23 percent) and the United States (17 TWh or 2 percent), since in
all but five countries nuclear generation actually increased or remained stable in 2011. Ten
countries13 even generated their historic maximum in 2011. Considering the decision in many
countries to carry out “stress tests” or other nuclear safety audits at their facilities following the 3/11
events, this is a rather surprising result. It indicates that inspection and analysis did not have any
operational impact in most cases, which might suggest the assessments were brief and limited in
scope.14
The “big six” countries—France, Germany, Japan, Russia, South Korea, and the United States—
generated over 70 percent of all nuclear electricity in the world. Two thirds of the 31 countries
operating reactors are nevertheless past their nuclear generation peak. The three countries that have
phased-out nuclear power (Italy, Kazakhstan, Lithuania), and Armenia, generated their historical
maximum of nuclear electricity in the 1980s. Several other countries’ nuclear power generation
peaked in the 1990s, among them Belgium, Canada, Japan, and the UK. And six additional countries
peaked generation between 2001 and 2005: Bulgaria, France, Germany, South Africa, Spain, and
Sweden. Among the countries with a steady increase in nuclear generation are China, the Czech
Republic and Russia. However, even where countries are increasing their nuclear electricity
production this is often not keeping pace with overall increases in electricity demand leading to a
reduced role for nuclear power.
In fact, all nuclear countries—with the exception of Iran that started up its first nuclear plant only in
2011—reached the maximum share of nuclear power prior to 2010. While five countries peaked in
2008 (China) or 2009 (Armenia, Czech Republic, Romania, Russia), the other 25 countries saw their
largest nuclear share up to 2005. In total, nuclear power in nine countries played its largest role
during the 1980s15, in twelve countries in the 1990s and in thirteen countries in the 2000s.
Increases in nuclear generation are mostly as a result of higher productivity and uprating16 at existing
plants rather than to new reactors. According to the latest assessment by Nuclear Engineering
International 17 , the global annual load factor 18 of nuclear power plants decreased from 77 to


12
   If not otherwise noted, all nuclear capacity and electricity generation figures based on International Atomic
Energy Agency (IAEA), Power Reactor Information System (PRIS) online database,
www.iaea.org/programmes/a2/index.html.
13
   Brazil, China, Czech Republic, Hungary, India, Iran, South Korea, Pakistan, Russia, Taiwan
14
   The so-called “stress tests” have been subject to multiple criticisms, however, they are not the subject of
analysis in this report.
15
   Belgium, Finland, Germany, Italy, Netherlands, South Africa, South Korea, Spain, Taiwan.
16
   Increasing the capacity of nuclear reactors by engineering changes like more powerful steam generators or
turbines.
17
   Nuclear Engineering International, “Load Factors to end December 2011”, May 2012.

Mycle Schneider, Antony Froggatt                                                                    World Nuclear Industry Status Report 2012                                                                                                      10
76 percent in 2011. Not surprisingly the biggest change was seen in Japan, where the load factor
plunged from an already modest 69.5 percent to 39.5 percent. This is also due to the fact that
officially 50 of the 54 pre-3/11 units in Japan are still counted as operational—even though some
reactors have not generated electricity for years.19 In Germany eight units have been officially closed
very quickly and thus do not appear in the year-end load factor of 85 percent anymore.
Figure 1: Nuclear Electricity Generation in the World
NUCLEAR ENERGY • World
TWh
% Nuclear Electricity Production in the World 1990-2011
(in TWh and share of electricity production) 4000
© Mycle Schneider Consulting
20%
3500
max.&17%! max.&2,660&TWh!
3000
2,518&TWh!
15%
2500
2000
11%#
10%
1500
1000
5%
500 enlever
0% 0
1990
1995
2000
2005
2010
2011
Source : IAEA-PRIS, BP, MSC, 2012
Taiwan and Romania had the highest load factors in 2011 with 95.5 and 95.4 percent respectively.
Russia is generally on an upward trend (now 80 percent) with load factors of the 15 operating
Chernobyl-type RBMK (light water cooled, graphite moderated) reactors rising from 60 percent to
81 percent between 2010 and 2011. South Korea is fluctuating at a very high level (90 percent). The
U.S. is continuing an excellent average load factor of 86 percent, especially considering its large
operating fleet. France at a load factor of 76 percent has increased productivity but remains on the
lower end of the performance indicator.
Overview of Operation, Power Generation, Age Distribution
There have been two major waves of grid connections since the beginning of the commercial nuclear
age in the mid-1950s. (See Figure 2.) A first wave peaked in 1974, with 26 reactor startups. The
second wave occurred in 1984 and 1985, the years preceding the Chernobyl accident, reaching
33 grid connections in each year. By the end of the 1980s, the uninterrupted net increase of operating
units had ceased, and in 1990 for the first time the number of reactor shutdowns outweighed the
number of startups. The 1992-2001 decade showed almost twice as many startups than shutdowns
18
Nuclear Engineering International load factor definition: “Annual load factors are calculated by dividing the
gross generation of a reactor in a one-year period by the gross capacity of the reactor (sometimes called
output), as originally designed, multiplied by the number of hours in the calendar year. The figures are
expressed as percentages. Where a plant is uprated, the revised capacity is used from the date of the uprating.”
19
Three units of the Kashiwazaki Kariwa plant, for example, have been off-line since the earthquake in 2007.
Mycle Schneider, Antony Froggatt World Nuclear Industry Status Report 2012 11
(50/26), while in the past decade 2002-2011 the trend reversed (36/49), notably with 19 units20
closing and only seven starting up in 2011.21

Figure 2. Nuclear Power Reactor Grid Connections and Shutdowns, 1956–2012

                                                                                                                                                                                                                                                                                       Source: IAEA-PRIS, MSC, 2012
As of 1 July 2012, under the Baseline Scenario (see hereunder), a total of 429 nuclear reactors were
considered operating in 31 countries, down 15 from the maximum of 444 in 2002. The current world
reactor fleet has a total nominal capacity of about 362.5 gigawatts (GW or thousand megawatts).
However, there are large uncertainties to these figures, mainly stemming from the undefined future
of the 50 Japanese nuclear reactors that are officially still operating but are all shut down as of
1 July 2012. We have therefore considered three scenarios:

• The Baseline Scenario. Only the 10 Fukushima reactors are permanently closed.
• The East Coast Scenario. In addition to the Fukushima units, the seven reactors impacted either
directly or indirectly by 3/11 events remain closed. These include three Onagawa reactors that were
closest to the 3/11 epicenter, the three remaining Hamaoka units, shut down at the request of former
Prime Minister Naoto Kan because of high earthquake risk estimates and the Tokai reactor, the
nuclear plant closest to the Tokyo Metropolitan area (ca. 100 km). The total number of operating
units in the world would drop to 421 and the installed capacity to 356 GWe.
• The German Scenario. In addition to the units considered closed under the Baseline and East
Coast Scenarios the 12 reactors with an operational age in excess of 30 years will remain shut down.
The German government decided in the wake of 3/11 to shut down for good the eight reactors that
had operated for over three decades. That would leave Japan with 25 operating reactors, the
worldwide figure would drop to 409, last seen in 1987, and the installed capacity to 348 GWe, not
experienced since the middle of the 1990s.


20
   Ten in Japan, eight in Germany, one in the UK. In Japan, these are the 10 Fukushima reactors, of which four
are destroyed; units 5 and 6 at Daiichi and the four reactors at Daiini remain in cold shutdown and are almost
certain never to operate again. However, their definitive closure has not yet been officially confirmed.
21
   Three in China (including an experimental breeder reactor of 20 MW in China, which is counted by the
IAEA, but strangely had never been in its statistics of units “under construction”), plus one each in India, Iran,
Pakistan and Russia.

Mycle Schneider, Antony Froggatt                                                                                                                                                                                                                         World Nuclear Industry Status Report 2012                    12
Considering the opposition in Japan, especially by local authorities under the influence of an
increasingly vocal public opinion, against the restart of any nuclear power plant (see Japan Focus for
details), it is possible that there will be the short-term closure of the majority of the nuclear program
in the country. This would not be a “phase-out” scenario but rather the simple “abandoning” of
nuclear power. Every authorization of restart will be subject to intense battles between promoters and
opposition of the nuclear option. Under these circumstances, the scenarios above could prove quite
conservative.
The total world installed nuclear capacity has decreased only six times since the beginning of the
commercial application of nuclear fission, all in the past 15 years—in 1997, 2003, 2007, 2008, 2009
and 2011. Despite 15 fewer units operating in early 2012 compared to 2002, the generating capacity
is still about identical. This is a result of the combined effects of larger units replacing smaller ones
and, mainly, technical alterations at existing plants, a process known as uprating. In the United
States, the Nuclear Regulatory Commission (NRC) has approved 140 uprates since 1977. These
included, in 2011, five uprates between 1.6 percent (Surry 1 and 2) and 17 percent (Point Beach 1
and 2)22. The cumulative approved uprates in the United States total 6.2 GW.23 Most of these have
already been implemented, and applications for an additional 1.5 GW in increases at 20 units are
pending.24 A similar trend of uprates and lifetime extensions of existing reactors can be seen in
Europe. The main incentive for lifetime extensions is their considerable economic advantage over
new-build, but upgrading and extending the operating lives of older reactors will result in lower
safety margins than replacement with more modern designs.
Figure 3. World Nuclear Reactor Fleet, 1954–2012
NUCLEAR ENERGY • World
Nuclear Reactors & Net Operating Capacity in the World Number of
GWe
Reactors
in GWe, from 1954 to 1 July 2012
400 364 GWe
500
429 reactors
444 reactors
322 GWe 450
350 424 reactors
Reactors in operation 400
300 of which:
Tokai (1) - Hamaoka (3) - Onagawa (3) 350
Japanese reactors >30 years (12)
250
Operable capacity 300
200 250
© Mycle Schneider Consulting
200
150
150
100
100
50
50
0 0
1954
1960
1970
1980
1989
1990
2000
2002
2010
2012
Sources: IAEA-PRIS, MSC, 2012
22
The fifth uprate (15 percent) was authorized at Nine Mile Point 2.
23
Nuclear Regulatory Commission (NRC), “Approved Applications for Power Uprates”, updated 29 March
2012, at www.nrc.gov/reactors/operating/licensing/power-uprates/status-power-apps/approved-applications,
accessed on 2 May 2012.
24
Nuclear Regulatory Commission (NRC), “Pending Applications for Power Uprates”, updated 30 April 2012,
at www.nrc.gov/reactors/operating/licensing/power-uprates/status-power-apps/pending-applications.html,
accessed on 2 May 2012.
Mycle Schneider, Antony Froggatt World Nuclear Industry Status Report 2012 13
Including uprates in many countries, as well as new-build capacity, net of closures, the capacity of
the global nuclear fleet increased by about 30 GWe between 1992 and 2002 to reach 362 GWe; it
peaked in 2010 at 375 GWe before falling back to the level achieved a decade ago.

The use of nuclear energy has been limited to a small number of countries, with only 31 countries, or
16 percent of the 193 members of the United Nations, operating nuclear power plants in early 2012
(see Figure 4). One new country, Iran, started operating its first nuclear power reactor in 2011. Iran is
the first in 15 years to join the list of countries generating electricity from fission since Romania
joined the nuclear club in 1996. Half of the world’s nuclear countries are located in the European
Union (EU), and they account for nearly half of the world’s nuclear production. France alone
generates about half (49 percent) of the EU’s nuclear production.

Figure 4. Nuclear Power Generation by Country, 2011

                                                                    Source: IAEA-PRIS, MSC, 2012

Overview of Current New Build
Currently, 13 countries are building nuclear power plants, which is two less than a year ago:
    • Iran finally started operating its only reactor that had been under construction at Bushehr since
         1975. No further active building is currently ongoing.
    • Bulgaria abandoned the construction of the only two units at Belene, which it had been
         building since 1987.
    • Japan halted work at two units following the 3/11 events, Ohma and Shimane-3, which had
         been under construction since 2007 and 2010 respectively. No further project is underway or
         planned at this stage.
    • Pakistan started construction at Chasnupp-3 in late May 2011, two months after the connection
         of Chasnupp-2 to the grid in March only three days after 3/11.
In addition we have removed the Russian Kursk-5 unit from the list, following reports that the
builder, Rosatom, confirmed abandoning the project. It was intended to be an upgraded version of

Mycle Schneider, Antony Froggatt           World Nuclear Industry Status Report 2012                         14
the Chernobyl RBMK design.25 As of 1 May 2012, we consider 59 reactors under construction. The
current number compares with a peak of 234 units in building progress—totaling more than
200 GW—in 1979. However, many of those projects (48) were never finished (see Figure 5.) The
year 2004, with 26 units under construction, marked a record low for construction since the
beginning of the nuclear age in the 1950s.
Over the past year, the most spectacular construction freeze took place in China. No new concrete
base has been poured in the country after 3/11. The World Nuclear Association assumes that at least
five authorized construction starts did not happen, with at least another ten that were in the pipeline
for that year.26

Figure 5. Number of Nuclear Reactors under Construction

                                                                                                                                             Number of Nuclear Reactors Listed as "Under Construction"
                                                                                                                                                                                                                                                                       by year, 1954 - 1 July 2012
                                          250
                                                                       © Mycle Schneider Consulting

                                                                                                                                                                                                                                                                         234

                                          225
                                                                                                                                                                                                                                                                          48
                                          200

                                          175
                     Number of Reactors

                                          150
                                                                                                                                                                                                                                                                                                     Cancelled or Suspended Projects!
                                          125
                                                                                                                                                                                                                                                                                                     Completed and Ongoing Projects!
                                          100
                                                                                                                                                                                                                                                                          186
                                                                                                                                                                                                                                                                                                                                        62
                                              75
                                                                                                                                                                                                                                                                                                                                        3
                                              50
                                                                                                                                                                                                                                                                                                                                        59
                                              25

                                                      0
                                                                   1954                                                                 1960                                                     1965                                                    1970   1975       1980    1985     1990       1995      2000     2005     2010 12

                                                                                                                                                                                                                                                                                                              Source: IAEA-PRIS, MSC 2012

The total capacity of units now under construction in the world is about 56 GWe, down by about
6 GWe compared to a year ago, with an average unit size of around 955 MW. (See Table 1 and
Annex 4 for details.) A closer look at currently listed projects illustrates the level of uncertainty
associated with reactor building, especially given that most constructors assume a five year
construction period:
•                               Nine reactors have been listed as “under construction” for more than 20 years. The U.S. Watts
                                Bar-2 project in Tennessee holds the record, as construction started in December 1972, but was
                                subsequently frozen. It has now failed to meet the latest startup date in 2012 and is now
                                scheduled to be connected to the grid in 2015. Other long-term construction projects include
                                three Russian units, two Mochovce units in Slovakia, and two Khmelnitski units in Ukraine. The
                                construction of the Argentinian Atucha-2 reactor started 31 years ago.
•                               Four reactors have been listed under-construction for 10 years or more. These are two Taiwanese
                                units at Lungmen for about 13 years and two Indian units at Kudankulam for around 10 years.
•                               Forty-three projects do not have an IAEA planned start-up date, including nine of the 10 Russian
                                projects and all of the 26 Chinese units under construction.


25
   The WNA states on its website: “In February 2012 Rosatom confirmed that the project was terminated.” see
http://www.world-nuclear.org/info/inf45.html, accessed 4 May 2012.
26
   www.world-nuclear.com/info/inf63.html, accessed 3 May 2012.

Mycle Schneider, Antony Froggatt                                                                                                                                                                                                                                World Nuclear Industry Status Report 2012                                   15
You can also read