2019 Annual Review - SHIPPING AND SHIPBUILDING MARKETS
←
→
Page content transcription
If your browser does not render page correctly, please read the page content below
Annual Review

                              2019

SHIPPING AND SHIPBUILDING MARKETS
Contents                                                                                                        Shipping &
                                                                                                                Shipbuilding
Shipbuilding .................. 05                                                                              Markets
Dry Bulk......................... 33

Tanker............................. 45
                                                                                                    530         The BRS Group is a diversified global
                                                                                                                shipping services group offering a range
Chemicals &                                                                            Employees worldwide      of maritime activities which complement
Small Tankers ............... 59                                                                                its core shipbroking business. In addition

LPG .................................. 65                                                           225         to Shipbroking and Yacht Brokerage, the
                                                                                                                Group’s activities include Freight Futures
LNG.................................. 71                                                         Shipbrokers    (FFA’s), Software Technology and Market
                                                                                                                Intelligence.
Offshore ......................... 77

Cruise.............................. 85
                                                                                                    100
                                                                                 Assets transactions per year
Yachting.......................... 91

Containerships.............. 97                                                                 4,500
                                                                             Chartering transactions per year
Ro-Ro............................ 107

Car Carrier................... 113

                                            BRS GROUP - Annual review 2019                                                                                   1
Certainly
                                                                                                           of Justice in effect displaced sanctions’ penalties
                                                                                                           to compliance of major banks who set their own
                                                                                                           rules and standards. Rare was a payment or a
                                                                                                           transfer that was without incident no matter

                                     uncertain
                                                                                                           what origin or purpose. Significant costs and
                                                                                                           uncertainty require more cash reserves. With
                                                                                                           the impending IFRS regulations coming into
                                                                                                           effect, cash reserves will continue to be an issue.

                                                                                                           Pressure to dis-intermediate continues to grow,
                                     A very complicated year which allows us a glimpse                     with traders and brokers on the front line. Cost
                                     of what is to come.                                                   cutting efficiency has led to various initiatives
                                                                                                           to promote more transparency at less cost.
                                     The macro political scene sets the tone for international trade       Electronic platforms, back-office and post fixing
                                     and this year it had its twists and turns. The Trump-induced          tools, ship tracking and its logical evolution into
                                     trade wars meant significant uncertainty in the three major           algorithmic trading tools, all speed up the pace
                                     sectors: dry cargo, tankers and containers. We were all hard          of evolution in our industry but add significant
                                     pressed to foresee or even retrospectively anticipate the             uncertainty as to the long term structure and
                                     significance these would have on the shipping markets and             functioning of shipping markets. Indices as
                                     it is clear this lack of certainty played a significant role. On      market indicators (and by extension shipbrokers’
                                     the European scene, with Brexit looming, Italian populism, the        contributions) will surely be a growing issue.
                                     Yellow Jackets, nationalism building, and the traditional axis
                                     within the community suffering, uncertainty is the backdrop           The Chinese finance houses dominated the
                                     for a region where a large part of the maritime community has         shipbuilding market and contributed to a
                                     its headquarters.                                                     significant increase in activity compared to
                                                                                                           2017. Unfortunately the over-ordered Very
                                     Uncertainty in the energy sector and more specifically in the oil     Large Containership segment arrived at the
                                     trades had an ongoing negative effect on an overbuilt market.         heart of the trade wars, while the wave of
                                     During the latter part of the year, uncertainty converted into        tanker newbuildings ordered during the heady
                                     speculation and various trades drew attention and some                years of 2014/2015 felt like they were adding
                                     positive reactions.                                                   to long lines at soup kitchens, despite a record
                                                                                                           demolition of some 20 million dwt. Bulkers were
                                     The real uncertainty however remains the implication of the           the main concentration by the Chinese, as the
                                     2020 IMO regulations. The debate on the significant use of            dry cargo market has performed relatively well
                                     scrubbers to meet requirements dominated the press and left           for the last few years, but some offshore and
                                     owners and freight users divided as to the implications. It           specialised sectors like ro-ro, LNG bunkering
                                     seems that larger ships with standard trades make sense and           and ferries saw some renewed interest.
                                     are being installed with scrubbers but few believe this is a long
                                     term solution. The industry needs to make significant progress        Undoubtedly the uncertainty in 2018 will
                                     and contributions to the growing ecological issues in as much         provoke further developments in 2019. What
                                     as political and public perception of shipping as a significant       transpired at the end of last year in the world
                                     polluter is growing. The uncertainty surrounding this issue has       stock markets could be an indicator but certainly
                                     probably the most influence on how international trade will           tells us that uncertainty does not lead to strong
                                     evolve. Yards, shipowners and design companies all struggle           markets but surely opportunities. Next year
                                     with being in the know; LNG, solar, wind, low sulphur fuel,           will require a constant review of strategy and a
                                     hydrogen, vie for market share and legitimacy. Regulations,           nimble approach to inevitable change.
                                     coupled with economics, will eliminate the uncertainty but
                                     not in 2019.                                                                                                Tim JONES
                                                                                                                                                   President
                                     Significant trade wars and trade sanctions added to the
                                     uncertainty surrounding everyday activity. Almost every major
                                     owner and charterer announced their withdrawal from activities
                                     sanctioned by the US - with Iran at the heart of these - despite
                                     often being legal in their national jurisdiction. The US Department

2   BRS GROUP - Annual review 2019   BRS GROUP - Annual review 2019                                                                                              3
Shipbuilding

A promising first half,
an uncertain second one
2018 started briskly in the wake of 2017. In the
first half of the year, newbuilding orders were
placed at a rate of about 10m dwt per month.
However the pace dropped in the second half, as
owners grappled with a rise in newbuilding prices
and growing uncertainty over the IMO 2020
deadline.

Regardless, newbuilding orders rose to 95.5m
dwt in 2018 versus 83.1m dwt in 2017. Demand
for bulkers, container carriers and specialised
ships increased, while for tankers it receded,
reflecting low freight rates and poor sentiment.
Thanks to this additional demand, shipbuilders
succeeded in raising newbuilding prices by about
10%. This enabled them to pass on some of the
additional building costs resulting from higher
steel prices, new regulations and increased
pressure from marine suppliers, who have also
been struggling since 2008.

VIIKKI
LNG-fuelled forest product carrier, 25,600 dwt (B.Delta 25), built in 2018
by China’s Jinling for Finland’s ESL Shipping.

                                                                             5
50
SHIPBUILDING SHIPBUILDING
KEY POINTS OF 2018 KEY POINTS OF 2018
0
2003 2004 2005 2006 2007 2008 2009 2010 2011 2012 2013 2014 2015 2016 2017 2018
Deliveries vs demolitions Fleet evolution
Deliveries Demolitions Fleet KEY POINTS OF 2018 Summary 2017 2018
Million
Million dwt
dwt Million
Million dwt
Ships 1,000 1,245
Orders
200 2,000 m dwt 83.1 95.5
180 The three Asian shipbuilding giants, representing almost 95% of the global
1,800
orderbook by deadweight, continued to fight fiercely for market share. In Ships 1,313 1,142
160 Deliveries
140 1,600
2018, China consolidated its top position with a 43.1% market share. In second m dwt 96.1 78.7
120
place Korea increased its market share to 27.5%, while Japan slipped back to Ships 2,886 2,995
100
1,400 24.0% in third place. The ‘rest of the world’ (RoW) and Europe registered a 3.8% Orderbook
m dwt 214.8 231.7
and 1.6% share of the global market respectively.
80 1,200
Ships 36,972 37,674
60 Newbuilding deliveries fell to 78.7m dwt in 2018 against 96.1m dwt the Active Fleet
1,000
40 previous year, reflecting the decline in newbuilding orders in 2016 (32.6m m dwt 1,804.7 1,855.7
20 800 dwt). The global orderbook increased from 214.8m dwt to 231.7m dwt in Ships 7.8% 7.9%
0 2018, while the world fleet increased from 1,805m dwt to 1,855m dwt Orderbook/Active Fleet
600 m dwt 11.9% 12.5%
-20 (37,674 ships) during the year.
-40 400
Shipowners sought to take advantage of low asset prices in early 2018 and
-60
200 many returned to the shipyards, but owners were equally active on the second
-80 Orderbook 2017 2018
hand market (110m dwt in sales in 2018 versus 132m dwt in 2017).
-100 0
2003 2004 2005 2006 2007 2008 2009 2010 2011 2012 2013 2014 2015 2016 2017 2018
Newbuilding prices increased by some 10% during the year regardless of Market share 43.7% 43.1%
vessel size and type, even for tankers, which were less in demand. This was China Ships 1,234 1,283
the effect of tension in the newbuilding market. Orderbooks stretched well
m dwt 93.9 99.8
Deliveries Demolitions Fleet Evolution beyond the two-year yardstick, reaching three years for the busiest yards.
Market share 24.4% 27.5%
The IMO 2020 sulphur cap caused more debate (and disagreement) than any
Korea Ships 396 465
other issue in the market in 2018. It raised numerous questions, many of
which remain unanswered. m dwt 52.4 63.8
Should owners install scrubbers (exhaust gas cleaning systems) or not? If Market share 25.1% 24.0%
Orders so, what type: open loop, closed loop or hybrid? Will open-loop scrubbers
Million dwt Japan Ships 750 730
be banned by more countries? Who pays for the equipment: owners or m dwt 54 55.5
Orders charterers? And who is responsible in the case of scrubber breakdown? How
300
reliable will scrubbers be in a high-temperature, high-corrosion environment, Market share 1.6% 1.6%
Million dwt and operating with different engine outputs? Europe Ships 237 288
250
Will the price spread between ‘compliant’ fuel and high sulphur fuel widen or m dwt 3.4 3.6
narrow, and what will be the availability of both fuel types? Are scrubbers Market share 5.2% 3.8%
200
just a temporary fix that will become redundant after a couple of years?
ROW Ships 267 229
What adjustments, if any, will the Baltic Exchange make to their indices (on
which the FFA market and a good part of the physical market depends)? What m dwt 11.1 8.9
150 proportion of the world fleet will in fact be fitted with scrubbers?
While all these questions were raised during 2018, the answers will only
100 become apparent during 2019, 2020 and beyond. The uncertainty created
by the sulphur cap poses a challenge for everyone in the industry: owners,
charterers, traders, shipbuilders, oil refiners, bunker suppliers, banks and
50
brokers. Opportunities for some, headaches for others.
The trade dispute initiated by the US constituted the second hot topic in
0
2018, but its impact was difficult to assess. Chinese exports shrank by 4.4%
2003 2004 2005 2006 2007 2008 2009 2010 2011 2012 2013 2014 2015 2016 2017 2018 year-on-year in December 2018, the worst decline in two years and much
worse than economists expected. The same month, Chinese imports slumped Newbuilding
Bulk Tanker Containers Others
by 7.6% year-on-year, which also suggests that the world’s second-largest
economy is struggling. Reuters’ analysts had expected a 3% decline and a 5% prices increased
increase in exports and imports respectively but despite the year-end slump
in exports, China’s trade surplus with the US swelled to $323bn in 2018, the 10% in 2018
Deliveries Demolitions Fleet highest on record.
Million dwt Million dwt
200 2,000
180
1,800
160
6 140 BRS GROUP - Annual review1,600
2019 BRS GROUP - Annual review 2019 7
120
1,400
SHIPBUILDING SHIPBUILDING
WORLD ECONOMY, MARITIME TRADE AND FREIGHT RATES WORLD ECONOMY, MARITIME TRADE AND FREIGHT RATES
WORLD ECONOMY, MARITIME Global Trade and World GDP & Active Fleet Growth Freight Rates Average Time Charter rates were:
Global trade and world GDP & active fleet growth • Aframax: $14,833 in 2017 and $14,220 in 2018
TRADE AND FREIGHT RATES Dry bulk
• Suezmax: $18,196 in 2017 and $16,050 in 2018
12%
10.2% • VLCC: ....... $26,539 in 2017 and $25,750 in 2018
9.3% After an extremely difficult year in 2016 (in which the Baltic Exchange Dry
World Economy 7.1%
9.4% Index (BDI) fell to its lowest level since launch), the dry bulk market saw the
8% 6.5% recovery started in 2017 continue into 2018. Container
The world economy performed well in 2018, with a 5.4%
growth of 3.7%, just 0.1% less than in 2017. However, 4.5% 4.1% 4.2% Container charter rates continued to improve in 2018
3.9% 3.6% 3.6% 3.3% 3.7% The BDI logged an averaged 1,352 points in 2018 versus 1,145 in 2017, albeit
seaborne trade growth went down from 4.2% in 2017 to 4% after the record lows seen in 2016 and the subsequent
4.3%
3.5% 3.5% 3.4% 3.5% 3.7% 3.8% 3.1% there was the start of a decline at the end of the year.
3.1% in 2018. Inward-looking trade policies and the rise 3.4% 3.5% 3.2% 3.0% 2.8% recovery in 2017. The Alphaliner Charter Index averaged
2.0%
of protectionism threaten an otherwise positive outlook 68 in 2018 versus 55 the previous year.
0% The Baltic Capesize 5TC averaged $12,962 in Q1, $14,980 in Q2, $22,207 in
for seaborne trade, according to the 2018 United Nations -0.1%
Q3, and $15,829 in Q4. Despite this, charter rates remained only slightly above
Conference on Trade and Development (UNCTAD) review
operating expenses. As carriers consolidated into ever
of maritime trade. Rising trade friction could derail the -4% smaller numbers of large alliances, they were able to use
recovery seen in the past two years and reshape global -3.8% Tanker
their bargaining power to keep rates under check.
trade patterns. UNCTAD also warned that competition
authorities should remain vigilant over the acceleration -8% Tanker rates were under greater pressure in 2018. The Baltic Exchange Clean The idle or unemployed containership pool increased
of M&A activity in the liner shipping sector. 2009 2010 2011 2012 2013 2014 2015 2016 2017 2018 Tanker Index (BCTI) started 2018 at 655 and ended at 813, and averaged from about 0.4m teu (1.8% of the active fleet) at the end
2009 2010 2011 2012 2013 2014 2015 2016 2017 2018
579 over the year, compared to 606 in 2017. of 2017 to 0.6m teu (2.8%) at end 2018.
Overall, UNCTAD predictions for seaborne trade are
World
World GDP
GDP Seaborne
SeaborneTrade
Trade World
WorldActive
ActiveFleet
FleetGrowth
Growth
positive, with a potential compound annual growth rate Average 1-year Time Charter rates were as follows:
of 3.8% between 2019 and 2023.
• MR2: $13,147 in 2017 and $13,261 in 2018
While volumes across all sectors are expected to grow, • LR1: $13,725 in 2017 and $13,240 in 2018
containerized and dry bulk shipments are expected to rise Maritime Trade • LR2: $14,789 in 2017 and $14,040 in 2018
the fastest, at the expense of tanker volumes. “Projections
Dry bulk trade growth dropped to 2.6% in 2018, in contrast to 4.1% in 2017 and During 2018, 1-year Time Charter rates fluctuated within the following bands:
of the rapid growth in dry cargo are in line with a five-
1.7% in 2016.
decade-long pattern that saw the share of tanker volumes • MR2: between $13,000 and $14,500 per day
being displaced by dry cargoes, dropping from 50% in Growth in theCharter
Alphaliner tanker trade continued
Index since to slow, from 4.1% in 2016 to 2.7% in
2010 • LR1: between $13,000 and $15,000 per day
1970 to less than 33% in 2017,” said UNCTAD. 2017, to 1.4% in 2018. • LR2: between $13,500 and $18,000 per day
However, the report warned the threat of growing global Finally, container throughput growth fell to 4.6% in 2018, down from 6.7% in In the crude segment, the Baltic Exchange Dirty Tanker Index (BDTI) started
trade disputes would cloud prospects for shipping. 2017
120
but up from 2.7% in 2016. the year at 700 and ended at 1266, with an overall average of 798 in 2018
Tensions between the world’s two largest economies, the versus 787 in 2017.
100
US and China, as well as with Mexico, Canada and the
80 Crude tanker rates had softened across the board in 2017 and the start of
European Union are “an immediate concern”.
Maritime Trade Growth 2018. However, rates increased sharply in Q4 2018 as a consequence of the
60
Maritime trade growth fall in the oil price, which plummeted by more than 40%.
40
Time Charter rates for VLCCs started the year at $27,000, dropped to a low
16%
20
of $19,000 during the summer, and ended at $31,000.
0 14.1%
14%
2010 2011 2012 2013 2014 2015 2016 2017
12%
12.3%
Charter rates for cellular ships (6-12 month fixtures)
10%
Alphaliner Charter
8.3% Index since 2010 2016 avg 2017 avg 2018 avg Change
8% Size
$/day $/day $/day 2018/2016
5.8% 6.0% 5.7% 6.7%
6%
6.5% 5.0%
4.1% 4.1% 8,500 teu 8,667 13,396 15,538 79%
300 4.6%
4% 4.7% 5.1%
3.8% 2.7%
3.8% 2.7% 5,600 teu 6,129 12,063 13,078 113%
1.4% 2.6%
2%
250
2.0% 1.7% 1.4%
0% 4,000 teu (Panamax) 5,133 7,533 11,204 118%
0.4% -0.1%
200 -1.1% -1.2%
-2% 2,500 teu 5,979 8,179 10,792 80%
2010 2011 2012 2013 2014 2015 2016 2017 2018
150 1,700 teu 7,004 7,404 9,646 38%
Dry Bulk Trades Growth (Mt) Oil Trades Growth (Mt) Container Throughput Growth (Teu)
Dry Bulk Trades Oil Trades Container Throughput 1,000 teu 6,621 6,375 7,242 9%
Growth (Mt) Growth (Mt) Growth (Teu)
100
Alphaliner Index 43.2 54.7 68.2 58%
50
0
8 BRS GROUP - Annual review 2019 BRS GROUP - Annual review 2019 Picture: HAFNIA SHANGHAI, 75,000 dwt shallow draft LR1 Tanker (IMO3), under sea trials at GSI before delivery to Vista Hong Kong. 9
2000 2001 2002 2003 2004 2005 2006 2007 2008 2009 2010 2011 2012 2013 2014 2015 2016 2017
SHIPBUILDING SHIPBUILDING
ORDERS AND ORDERBOOKS ORDERS AND ORDERBOOKS
New Ordersfor
New orders forstandard
Standard Vessels
vessels per Year
per year
Million dwt
Million dwt
Korea continued to dominate the segment and managed to increase its market Tanker Summary 2017 2018
30
141 share from 42% to 50% in 2018. Both China and Japan conceded ground, falling
Orders m dwt 31.9 25.4
from 29% to 24% and 20% to 18% respectively.
25 Deliveries m dwt 38.4 28.9
Tanker deliveries declined to 28.1m dwt in 2018 from 38.6m dwt in 2017. The
active tanker fleet grew from 570m dwt at the end of 2017 to 577m dwt at Orderbook m dwt 75.4 71.9
20
the close of 2018. The tanker orderbook represented some 12.4% of the active Active Fleet m dwt 570.2 577.8
tanker fleet at year end, distributed as follows: Orderbook/Active Fleet 13.22% 12.44%
44 213
15
187
• MR1: orderbook 0.1m dwt; fleet 19.5m dwt; ratio 0.5% m dwt 22.1 17.1
120 China
• MR2: orderbook 8.3m dwt; fleet 74.9m dwt; ratio 11% Market share 29% 24%
10
• Panamax and LR1: orderbook 1.9 m dwt; fleet 32.3m dwt; ratio 5.8% m dwt 31.5 35.7
74 Korea
5 • Aframax and LR2: orderbook 10.4m dwt; fleet 109.1m dwt; ratio 9.5% Market share 42% 50%
22 28
8 33
• Suezmax and LR3: orderbook 8.2m dwt; fleet 89.7m dwt; ratio 9.1% m dwt 15.4 13.3
8
- • VLCC: orderbook 31.6m dwt; fleet 226.5m dwt; ratio 13.9% Japan
Market share 20% 18%
VLCC
VLCC Suezmax
Suezmax Aframax/LR2
Aframax Panamax/LR1
/ LR2 Panamax / LR1 MR
MR Handy
Handy Capesize
Capesize Panamax
Panamax Supramax
Supramax Handysize
Handysize Containership
Containership
2016
2016
2017 2018
2017 2018
Containerships orders continued to rise in 2018, after the recovery seen in Container Summary 2017 2018
2017. Some 13.3m dwt of contracts were placed, compared to 8.1m dwt in
Orders m dwt 8.1 13.3
2017, although this was below the yearly average of 14.2m dwt since 2000.
New orders per year (2010-2018)
New OrdersAND
ORDERS for Specialised
ORDERBOOKSVessels per Year Deliveries m dwt 12.6 14.2
no.ships
It follows two highly volatile years: the complete collapse in orders in 2016,
m dwt 2010 2011 2012 2013 2014 2015 2016 2017 2018 Orderbook m dwt 30.7 30.3
when just 3.0m dwt was contracted; and the vintage year of 2015 when 24.1m
120 Tanker 29.6 8.6 13.1 33.6 32.5 50.7 11.6 31.9 25.4 dwt was ordered, the third highest figure since 2000. Active Fleet m dwt 253.5 266.1
Orders and orderbooks Bulk 88.5 39.7 24.0 75.4 57.0 33.8 16.3 39.2 48.1
Orderbook/Active Fleet 12.11% 11.39%
for standard vessels
100 Container 7.3 20.9 3.5 22.9 12.5 24.1 3.0 8.1 13.3
In 2017, the focus was on Very Large Containerships (VLCS) with two
groundbreaking orders by MSC and CMA CGM for a total of twenty 23,500 m dwt 14.7 10.2
Newbuilding orders increased by 15% in 2018 to reach Other ships 4.4 6.7 6.0 8.9 12.1 7.1 1.7 3.9 8.7 teu carriers (400m length overall and 61m beam). In 2018, Hyundai Merchant China
Market share 48% 34%
95.5m
80 dwt. This follows the 155% increase seen in 2017 Total 129.8 75.9 46.6 140.8 114.1 115.7 32.6 83.1 95.5 Marine ordered 12 x 23,000 teu VLCS at Daewoo shipyard.
75
(83.1m dwt versus 32.6m dwt in 2016). m dwt 7.6 10.4
Contrary to previous years, China’s market share in this segment receded, falling Korea
The
60 2018 figure is very close to the yearly average of In 2018, only 18 VLOCs were ordered, 14 to be operated by Vale and 4 by Market share 25% 34%
from 49% to 34%. This shortfall was snapped up by Korea, whose market share
97.5m dwt registered since 2000. As mentioned, orders MOL. Owners 49 gave priority to Ultramax and Kamasarmax orders, with 147 climbed from 25% to 34%. Japan’s share remained unchanged at 23%. m dwt 7.0 6.9
for Japan
40 bulkers, container carriers and specialised ships and 108 contracts placed respectively. Some 141 Capesizes (>85,000
38 dwt)
In contrast to the bulker and tanker segments, container carrier deliveries rose Market share 23% 23%
34
increased, while those for tankers declined. were also contracted, of which 40% were Newcastlemax (55 ships).
26
22
in 2018 to 14.2m dwt in 2018 from 12.6m dwt in 2017. The active container
Bulker
20 orders rose by 23% to 48.1m dwt in 2018, up Deliveries declined in 2018 as a consequence of the drop in orders in 2016. A carrier fleet grew from 253m dwt at end 2017 to 266 m dwt at end 2018. The
from 39.2m dwt in 2017, and above the yearly average total of 28.1m dwt was delivered versus 38.6m dwt5in 2017. At the end of the orderbook represented about 11.3% of the active fleet at year end.
of044.5m dwt seen since 2000. year, the dry bulk orderbook stood at 111m dwt and the dry bulk active fleet
hadFerries
grown from 812m dwt to 835m dwt. Tonnage on order represented 13.3% It is interesting to note that there is basically no newbuilding activity in the
Contracting in both
Chemical carriers 2016 LPG
stainless andcarriers
2017 was boosted by
LNG carriers & Ro-pax Ro-ro Car carriers Cruise vessels
segments below 1,000 teu and between 4,000 and 10,000 teu.
steel of the active bulker fleet, broken down as follows:
large orders for VLOCs to support the Brazilian ore trade
(30 x 405,000
2016 2017 dwt VLOCs in 2016 and 2 x 405,000 dwt
2018 • Handysize and Handymax: orderbook 6.0m dwt; fleet 121.0m dwt; ratio 4.9%
plus 33 x 325,000 dwt VLOCs in 2017). • Supramax and Ultramax: orderbook 19.2m dwt; fleet 167.3m dwt; ratio 11.5%
Existing Orderbook O/E Orders in 2018
Size range teu ships teu ships teu % ships teu
• Panamax and Kamsarmax: orderbook 24.6m dwt; fleet 166.9m dwt; ratio 14.7%
18,000-23,000 92 1,808,559 46 1,018,278 56.3% 12 276,000
Bulk Summary 2017 2018 • Post-Panamax and Babycape: orderbook 5.0m dwt; fleet 54.9m dwt; ratio 9.1%
13,300-17,999 34 571,375 3 45,846 8.0% 21 312,972
Orders m dwt 39.2 48.1 • Capesize and Newcastlemax: orderbook 31.6m dwt; fleet 248.7m dwt; ratio 12.7%
12,500-13,299 237 3,253,587 52 751,004 23.1% 5 63,450
Deliveries m dwt 38.6 28.1
• VLOC: 21.7m dwt; fleet 71.8m dwt; ratio 30.2%
10,000-12,499 160 1,707,703 34 401,098 23.5% 25 296,250
Orderbook m dwt 91.3 111.4 Chinese shipbuilders solidified their share of the dry bulk market at 62% in 7,500-9,999 480 4,228,654 0 0 0% - -
2018, while Japan’s market share slipped from 31% to 30%. Korean shipbuilders,
Active Fleet m dwt 812.1 835.6 5,100-7,499 456 2,832,080 0 0 0% - -
who had previously been forced out of this market due to the prevailing low
Orderbook/Active Fleet 11.24% 13.33% 4,000-5,099 641 2,905,500 0 0 0% - -
prices, continued to hold around 5%.
3,000-3,999 245 851,765 17 54,5 6.4% 10 30,488
m dwt 53.4 69.1
China This was principally due to the VLOCs ordered by Korean shipowners Polaris, 2,000-2,999 664 1,689,771 107 271,172 16.0% 55 138,072
Market share 58.5% 62% H-Line and Korea Line at Hyundai Heavy Industries backed by Vale employment.
1,500-1,999 591 1,014,554 87 157,48 15.5% 41 73,898
Korea
m dwt 5.9 5.8 H-Line also ordered 3 Capesize bulkers at Hyundai shipyard, and the SM Group/
Korea Shipping Corp ordered 2 Handysize bulkers at Dae Sun Shipyard.
1,000-1,499 711 818,382 48 57,016 7.0% 25 28,640 There was a
steep decline in
Market share 6% 5% 500-999 777 576,28 25 17,644 3.1% 5 3,280
m dwt 27.9 32.9 There was a steep decline in tanker (including chemical) orders at 25.4m dwt
100-499 196 62,865 1 120 0.2% 1 120
Japan in 2018 (31.9m dwt in 2017). This is well below the average of 32.1m dwt
Market share 31% 30%
recorded since 2000. All sizes of tankers were affected except MR2 and to a Total 5,284 22,321,075 420 2,774,158 12.4% 200 1,223,170 tanker orders
lesser extent LR1.
10 BRS GROUP - Annual review 2019 BRS GROUP - Annual review 2019 Picture: PAUL A DESGAGNES, chemical/product tanker (IMO2), 15,100 dwt, delivered by Turkey’s Besiktas shipyard in 2018 to Groupe Desgagnes. 11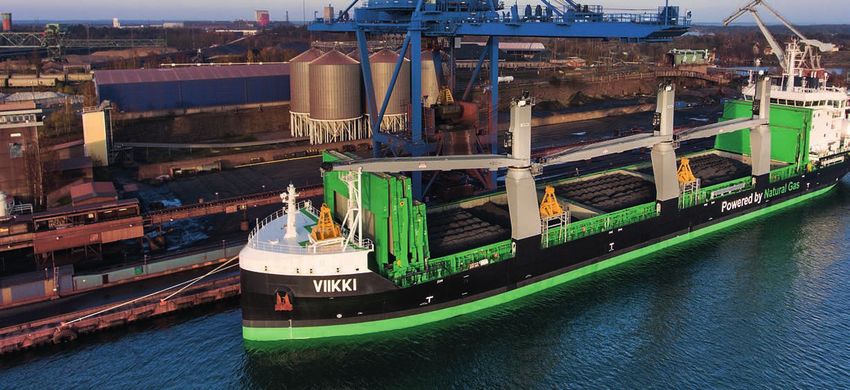
SHIPBUILDING SHIPBUILDING
ORDERS AND ORDERBOOKS ORDER CANCELLATIONS AND DEMOLITIONS
Historical LNG carriers orders
Cbm Ships Orders and orderbooks ORDER CANCELLATIONS IN 2018
for specialised vessels Cancellations in 2018
New Orders
2000 for Standard17
2,334,224 Vessels per Year Others - 11%
2001
Million dwt 3,574,503 26 In the specialised vessel segment, there was particular interest in LPG carriers, 15 Ships
LNG carriers, ro-ros, ferries and cruise ships in 2018. Both LNG carriers and Order cancellations - a potent sign of the crisis in the shipbuilding industry after
2002 1,972,148 14 2008 - fell to their lowest level in over a decade in 2017, at 4.4m dwt. 2018 saw
Container - 15%
30
cruise vessels saw a 141
record level of contracting. 24 Ships
2003 2,934,074 20 a slight increase, at 5.9m dwt.
2004 9,940,342 66
25
2005 7,489,377 43 Orders vs cancellations (2009-2018) Bulk - 51%
Tanker* - 23% 28 Ships
2006 6,049,231 31 31 Ships
20 m dwt 2009 2010 2011 2012 2013 2014 2015 2016 2017 2018
2007 4,197,061 24
Cancellations 36.6 38.4 23.3 16.6 31.2 15.1 11.6 12.3 4.4 5.9
2008 969,241
44 6 213
15
2009 142,741 1 187
Orders 33.9 129.8 75.9 46.6 140.8 114.1 115.7 32.6 83.1 95.5
2010 1,964,348 13 120
10
2011 7,527,720 49
2012 5,481,558 34 74 DEMOLITION IN 2018
5
22 28
2013 5,518,446 35
8 33 8
2014 11,157,622 69
- Demolition activity declined in 2018 to 27.6m dwt from 31.7m dwt in 2017,
2015 3,903,963 25 Demolitions in 2018
VLCC Suezmax Aframax / LR2 Panamax / LR1 MR Handy Capesize Panamax Supramax Handysize Containership reflecting the improvement in rates in most shipping markets. That trend was
2016 903,550 7 accentuated in the bulk and container carrier markets, where demolition plummeted Others - 7%
2016 2017 2018 148 Ships
2017 3,173,000 22 from 14.3m dwt to 4.6m dwt and from 5.6m dwt to 1.3m dwt respectively. On the
2018 11,593,794 75 contrary, tanker scrapping surged from 9m dwt to 19.7m dwt. Container - 5%
48 Ships
New Orders for Specialised Vessels per Year Demolition prices in the Indian subcontinent rose sharply in 2018 and reached
no.ships an average of $420/LT for bulkers and $430/LT for tankers ($350 and $375
New orders for specialised vessels per year in 2017). Bulk - 17%
120 Tanker* - 72% 60 Ships
181 Ships
N° of ships Scrap prices for container carriers also rose, reaching an average of $445/LT
100 versus $375/LT in 2017.
The average age of demolition climbed substantially in 2018, to 31 years
80 for bulkers (25 in 2017) and 23 years for container carriers (20 in 2017).
75
However, the average age of tanker scrapped fell from 24 to 23 years.
60 Going forward, the upcoming rules and regulations related to the Ballast Water
49 Treatment System (BWTS) and the 2020 sulphur cap will likely have a positive * Incl. Chemical Tankers
38 impact on demolition.
40
34
26
22 Demolitions vs deliveries (2009-2018)
20
5 m dwt 2009 2010 2011 2012 2013 2014 2015 2016 2017 2018 LNG carriers saw
0
36 29.4 41.5 59.5 44.9 34.3 36.1 44 31.7 27.6
record levels
Demolitions
Chemical carriers
Chemical stainless
carriers LPG
LPGcarriers
carriers LNG
LNGcarriers
carriers Ferries & Ro-pax
Ferries & Ro-pax Ro-ro
Ro-Ro CarCar
carriers
carriers Cruise vessels
Cruise vessels
steelsteel
stainless Deliveries 115.1 150.1 162.2 152.4 107.1 88.1 94.3 98.8 96.1 78.7
2016
2016
2017 2018
2017 2018
of ordering
Demolition Activity
Bulk Tanker Container
Orders for specialised vessels Year Dwt Ave Age of Scrap price Dwt Ave Age of Scrap price Dwt Ave Age of Scrap price
scrapped scrap range ($) scrapped scrap range ($) scrapped scrap range ($)
2013 2014 2015 2016 2017 2018 N° of Ships 2016 2017 2018
2009 13,652,367 31 275.4 8,228,123 27 326.3 6,037,153 27 275.4
Chemical carriers Chemical carriers
964,459 1,959,079 1,923,549 845,228 398,675 392,298 40 26 26
stainless steel (dwt) stainless steel 2010 7,612,665 32 390.4 13,258,957 27 436.7 2,171,355 26 399.2
LPG carriers (cbm) 5,092,657 4,239,880 3,551,472 26,768 1,182,734 1,429,174 LPG carriers 3 24 34 2011 24,988,666 30 484.6 8,775,202 28 510.8 1,214,599 29 491.7
2012 35,358,976 28 426.3 13,686,965 24 450.0 4,835,001 24 446.7
LNG carriers (cbm) 5,518,446 11,162,935 3,903,963 903,550 3,173,000 11,419,794 LNG carriers 7 22 75
2013 23,049,210 28 398.8 11,286,945 24 421.3 6,148,826 22 424.2
Ferries & Ro-pax (gt) 6,057,116 6,198,959 5,475,021 871,996 1,581,409 1,821,472 Ferries & Ro-pax 42 34 49 2014 16,607,153 27 431.3 8,098,733 26 470.4 5,789,141 22 476.3
Ro-ro (lm) 12,770 8,583 30,246 60,534 37,148 114,740 Ro-ro 19 11 19 2015 28,933,863 25 335.6 2,566,945 28 361.5 2,697,788 22 371.3
2016 30,420,562 23 254.2 2,283,380 27 283.3 8,817,506 19 289.6
Car carriers (cars) 260,979 148,263 217,776 19,248 38,360 21,100 Car carriers 3 5 5
2017 14,327,343 25 354.0 9,060,651 24 375.4 5,664,959 20 375.0
Cruise vessels (gt) 742,688 2,140,430 2,497,605 2,460,708 2,898,725 2,549,014 Cruise vessels 26 37 38 2018 4,612,036 31 423.3 19,794,808 23 432.9 1,307,344 23 445.8
12 Picture: WISBY PACIFIC, MR2 tanker, 49,686 dwt, built by GSI in 2018 for Wisby Tankers and on charter to Sweden’s Stena. BRS GROUP - Annual review 2019 BRS GROUP - Annual review 2019 13
SHIPBUILDING SHIPBUILDING
SHIPBUILDING CAPACITY DELIVERIES AND WORLDWIDE SHIPBUILDING CAPACITY IN 2017
DELIVERIES AND WORLDWIDE
SHIPBUILDING CAPACITY IN 2018
Total deliveries fell to 78.7m dwt in 2018, compared to 96.1m dwt in 2017.
This was divided into 28.1m dwt of bulk carriers (38.6m dwt in 2017), 28.9m
dwt of tankers (38.4m dwt) and 14.2m dwt of containerships (12.6m dwt).
In China, annual shipbuilding production (which increased 63% between
2006 and 2011 to reach a peak of 97.7m dwt) fell slightly from 38.5m dwt
in 2017 to 34.5m dwt in 2018.
In Japan, annual output (which declined 35% between 2006 and 2011 to
45.1m dwt) inched down from 20.2m dwt in 2017 to 19.8m dwt in 2018.
In South Korea, annual production (which rose only slightly by 2% between
2006 and 2011 to 82.7m dwt) fell quite significantly from 30.8m in 2017 to
19.0m dwt in 2018.
It is interesting to note that the number of active building facilities (yards
that either won new contracts and/or delivered tonnage during a given year)
rose slightly in 2018 to 317, a sign of the additional demand. The number
of yards had previously fallen from a peak of 685 in 2007 to 310 facilities
NEWBUILDING PRICES IN 2018
in 2017.
The number of Due to increased demand, shipbuilders succeeded in raising newbuilding
prices by some 10% across the board in 2018. This was less overall than in When orders
active yards rose Ship deliveries in China, Korea & Japan (2008-2018) 2017, but reflects a more even distribution of price rises.
exceed deliveries
By contrast, increases were more targeted in 2017, when we saw hikes of
slightly in 2018 Deliveries (million dwt) 2008
22.4
2012
65.0
2013
43.0
2014
35.7
2015
37.9
2016
35.9
2017
38.5
2018
34.5
15%-20% for larger bulkers, but more modest increases of 5%-10% for tankers prices usually rise
China of all sizes and smaller bulkers.
South Korea 33.9 49.1 33.2 24.6 29.2 35.9 30.8 19.0
We note that historically there is a certain correlation between newbuilding
Japan 27.7 29.1 25.0 22.4 21.1 21.6 20.2 19.8 orders and deliveries, and that when the number of orders exceeds or is about
to exceed the number of deliveries, prices tend to rise (see graph below).
Historical Building
Active building Facilities
facilities per
per year & year
region&(excluding
main areas (Excluding offshore)
offshore) World neworders
World new orders and
and deliveries
deliveries (2000-2018)
(2000-2018)
Million dwt N° of facilities Million dwt
Million dwt N° of facilities Million dwt
350 800 300
685
700
300
250
600
When orders exceed deliveries,
250 NB prices start to rise
200
500 When deliveries exceed orders,
200 NB prices start to fall
317
400 150
150 NB prices
273
300 rise again
100
100
200
50
50 100
- - 0
2000
2000 2001
2001 2002
2002 2003
2003 2004
2004 2005
2005 2006
2006 2007
2007 2008
2008 2009
2009 2010
2010 2011
2011 2012
2012 2013
2013 2014
2014 2015
2015 2016
2016 2017
2017 2018
2018 2000 2001 2002 2003 2004 2005 2006 2007 2008 2009 2010 2011 2012 2013 2014 2015 2016 2017 2018
2000 2001 2002 2003 2004 2005 2006 2007 2008 2009 2010 2011 2012 2013 2014 2015 2016 2017 2018
CHINA JAPAN SOUTH KOREA EUROPE ROW N° of World Active Shipyards
China Japan South Korea Europe ROW N° of facilities Orders
Orders Deliveries
Deliveries Newbuilding Prices
14 Picture: LA LOIRAIS, logger bulk carrier, 39,800 dwt, delivered by Jiangmen Nanyang in 2018 to LD Bulk. BRS GROUP - Annual review 2019 BRS GROUP - Annual review 2019 Picture: STOLT EXCELLENCE, stainless steel chemical tanker, 38,000 dwt, delivered by Hudong Zhonghua in 2018 to Stolt Tankers. 15
0rders
SHIPBUILDING
NEWBUILDING PRICES IN 2018
Price rises were
more evenly
distributed in 2018
Newbuilding prices (million $)
Low 4Q Peak 2Q End 2016 End 2016 End 2017 End 2017 End 2018 End 2018 In the dry bulk segment, China maintained its lead with
1993
2002 2008 China 1st tier** SK/Japan China 1st tier** SK/Japan China 1st tier** SK/Japan SHIPBUILDING IN THE WORLD 32.6m dwt of new orders (about 70% of the global bulk
Tankers orderbook). These ships represented 80% of China’s total
order intake in 2018. In the tanker and containership
VLCC 100 64 140-155 75-77 81-83 78 83 85/90 90
Shipbuilding in China segments, it had to settle for second place, with 15% (3.8m
Suezmax 63 44 90-100 50-52 56-58 53 58 55/59 64 dwt) and 20% (2.7m dwt) respectively of world orders.
China retained its position as the world’s leading shipbuilder in 2018, ranking
Aframax (A) 45 (A) 34 (A) 70-75 (A) 40-42 (A) 45-47 (A) 46 (A) 50 (A) 47 (A) 51 (A)
LR2 42-44 (LR2) 47-49 (LR2) 48 (LR2) 52 (LR2) 48 (LR2) 55 (LR2) number one in all three categories: the largest orderbook at 99.8m dwt (43% Chinese shipbuilding output declined, however, in 2018
market share), the most newbuilding orders at 40.4m dwt (35% share), and the to 34.5m dwt, down from 38.5m in 2017. However the
MR2 IMO 3 32,5 27 48-51 31-33 34-35 33 36 34/35 37
largest number of deliveries, at 34.5m dwt (44% share). ratio orderbook/output rose from 2.4 at the end of 2017
Bulkers to 2.9 at the close of 2018.
Chinese yards won some 20% more new orders in 2018 compared to 2017,
Newcastlemax
(205k dwt)
N/A N/A N/A 40-42 50-55* 48 50 52/54 58/60* while the other zones (Korea, Europe and Rest of World) registered a decrease.
Japan was the exception in securing a remarkable 90% increase in new orders.
Capesize
(180k dwt)
48 36 90-101 37-38 47-52* 46 48 50/52 55/57* It is interesting to note that 72% of Chinese orders were won by just 10
shipyards out of a total 117 active facilities in 2018.
Panamax (P)
29 (P) 21.5 (P) 53-60 (K) 23-24 24-25* 26.5 (K) 28.5 (K) 29/30 (K) 34 (K)*
Kamsarmax (K)
Ultramax (U)
22-23 (U) 23-24 (U)* 25.5 (U) 26.5 (U)
Supramax (S) 25 (H) 20 (S) 47-50 (S) 27/28 (U) 31 (U)* 2017 2018
19-20 (H) 21-22 (H)* 23 (H) 24 (H)
Handymax (H) China
m dwt Ships m dwt Ships
* Japan only, ** Prices at China’s 2nd tier yards are an estimated 5% lower
Market share 43.7% 1,234 43.1% 1,283
Bulk 53.4 472 69.1 630
Orderbook Tanker 22.1 341 17.1 264
Second hand price evolution during 2018 for 5 year old vessels (million $) Container 14.7 232 10.2 209
All ships 93.9 1,234 99.8 1,283
Jan 2018 High Low Dec 2018 Variation Jan- Dec
Bulk 23.1 213 32.6 300
VLCC 61.25 63.41 10 Dec 60.00 5 Feb 63.25 3.2%
Orders
Tanker 6.6 108 3.8 85 72% of China's
orders were won
Aframax 29.37 30.42 26 Nov 28.50 10 Sep 30.33 3.2% Container 3.1 65 2.7 81
All ships 34.0 441 40.4 548
MR Tanker 23.49 26.42 26 Nov 23.25 8 Jan 26.11 11.1%
Capesize 32.85 38.20 2 Jul 32.40 8 Jan 35.16 7.0%
Bulk 22.5 238 16.8 142 by just 10 yards
Tanker 10.9 134 8.8 162
Panamax 20.16 21.89 26 Jun 20.16 2 Jan 21.33 5.8% Deliveries
Container 3.7 81 7.2 106
Supramax 17.10 18.50 20 Aug 17.10 2 Jan 17.91 4.7% All ships 38.5 528 34.5 502
16 Picture: GOTHIA SEAWAYS, 6,700 lm on 7 decks plus 1 car deck. Delivered in January 2019 by Jinling Shipyard to DFDS and operated by DFDS. BRS GROUP - Annual review 2019 BRS GROUP - Annual review 2019 Picture: VISBORG, High Speed 30 knot ropax, 1,600 passengers, ice class 1A with Dual Fuel (LNG) Propulsion, delivered by GSI in 2018 to Sweden’s Gotlandsbolaget. 17SHIPBUILDING SHIPBUILDING
SHIPBUILDING IN CHINA SHIPBUILDING IN CHINA
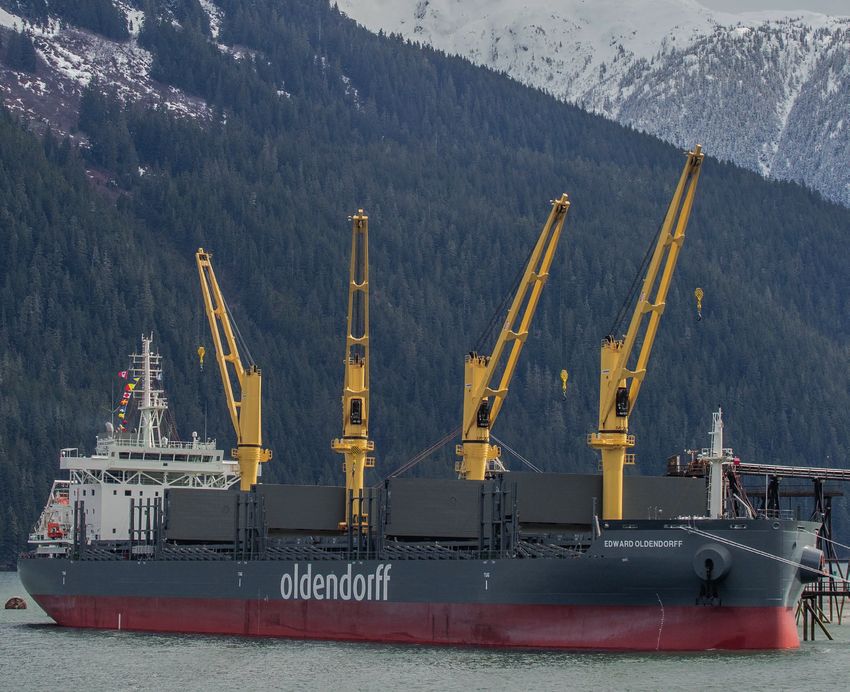
(MES) and Mitsui & Co, thus combining MES’ technological strength, Mitsui’s sales Most leasing companies took out mortgage loans from traditional shipping • Jiangsu New Hantong Ship Heavy Industry signed orders
Some newsworthy events of the year capabilities, and Yangzijiang’s building expertise. Production will be based at banks to finance deals. Western banks such as BNP Paribas, Crédit Agricole, for 8 x 208,000 dwt Newcastlemax and 10 x 82,000
Yangzijiang’s existing Taicang facilty in Jiangsu and the venture is expected to DVB, Société Générale and Standard Chartered are also providing finance to dwt Kamsarmax with German shipowner Oldendorff for
commence operations in April 2019. Chinese leasing companies. delivery in 2020 and 2021.
• The world’s first VLCC with a wind-power auxiliary
• Yangfan Group is cutting its shipbuilding capacity by 25%. The group, • Nantong Xiangyu won orders for 19 x 64,000 dwt
sail propulsion system was successfully delivered by
which has three yards in the Zhejiang province city of Zhoushan, will close Ultramax from Japanese owners (15 for Nisshin Shipping
Dalian Shipbuilding (DSIC) in 2018. This is not only a Ship finance drawdowns of Chinese leasing companies since 2016 ($m):
Zhoushan Shipyard, the oldest of the three. Founded in 1952 as a state- and 4 for Doun Kisen). Nisshin Shipping has now
major innovation, but also a remarkable initiative that
owned company, the shipyard was privatized in 2005 and taken over a contracted a total of 25 Ultramax bulkers at Xiangyu.
underlines cooperation between China’s shipbuilding
year later by Yangfan’s current parent company, Jianlong Group. Zhoushan Company 2016 2017 2018
and shipping industries. It is also another major • We note a growing interest among Japanese owners
Shipyard’s annual shipbuilding capacity reached 500,000 dwt at its peak
breakthrough for DSIC and China Merchant Energy for Chinese yards. In 2018, they contracted 65 orders
and the yard was capable of constructing vessels up to 92,500 dwt. ICBC Leasing 2,700 2,200 3,200
Shipping (CMES) in their bid to jointly build a VLCC in China, including 46 bulkers, 13 container carriers, 5
brand. • Qingdao Yangfan Shipbuilding has successfully completed a lengthy Bank of Communications Leasing 2,900 3,000 2,000
tankers and 1 LNG bunker carrier, as follows:
restructuring, having gone into bankruptcy protection in October 2016. CMB Financial Leasing 1,500 1,700 1,500
• GSI successfully delivered the world’s fastest ropax ferry
State-run Huatong Group, which holds a 22% equity interest in Qingdao • Nantong Xiangyu: 19 bulkers
to Swedish owner Gotland. This high-specification, Minsheng Financial Leasing 1,800 1,200 1,200
Yangfan, has proposed a new restructuring plan in which it will buy the • Tsuneishi Zhoushan: 13 containers
environmentally-friendly ropax vessel will be driven
remaining 78% of the yard’s equity from the Jianlong Group. Jianlong CDB Financial Leasing 800 700 1,200 • Jiangmen Nanyang: 9 bulkers
by LNG fuel engines and sail in the Baltic.
decided to sell after Yangfan’s employees strongly opposed its earlier AVIC International Leasing 300 700 1,100 • Yangzijiang: 6 bulkers
restructuring proposal. • Hantong: 5 bulkers
CCB Leasing 600 400 1,000
White List • A court finally ruled to liquidate Zhejiang Ouhua Shipbuilding after the • Samsung Zhoushan: 5 tankers
CSSC Leasing 1,000 1,000 800 • Nacks: 4 bulkers
shipyard applied for bankruptcy protection in May 2018. Ouhua has
In 2018, two yards (Nantong Huatai and Ouhua)
unfinished orders for four containerships and six multipurpose vessels. Huarong Leasing - 200 600 • SWS: 2 bulkers
previously listed in the official White List went bankrupt.
• Dacks: 1 bulker
The government has now adjusted the guidelines for the • New Dayang Shipbuilding was established after the yard formerly known Cosco Shipping Leasing Co Ltd - 200 600
• Hudong-Zhonghua: 1 LNG bunker vessel
list and inclusion is no longer a condition for banks to as Dayang Shipbuilding completed a restructuring with new investor
provide finance to yards. The rationale behind the White SUMEC. It was previously an affiliate of Sinopacific Shipbuilding but filed • Guangzhou Wenchong signed 12 x 2,000 teu container
List is increasingly under threat. Since its inception in for bankruptcy protection. Since restructuring, the yard has secured orders Leading Chinese leasing companies specialising in shipping and offshore: carriers with Taiwan’s Wan Hai Lines for delivery 2020
2014, 70 yards have been registered on the list and 9 for 11 bulkers including an order from AVIC International Leasing for 8 x and 2021.
have been removed due to bankruptcy. 63,500 dwt units. It has also signed a letter of intent with CDB Leasing, a Company Total value of vessel and offshore assets (Million$) • ENN Energy ordered China’s first LNG bunkering vessel.
unit of China Development Bank, for the construction of 12 x 63,500 dwt The 8,500 cbm vessel will be built by Dalian Shipbuilding,
Ultramaxes. ICBC Leasing 12,000 and will operate in the waters around Zhoushan when it
Consolidation, Restructurings & Bankruptcies
• China’s state council has given preliminary approval for China Shipbuilding Bank Of Communication Leasing 9,200 is delivered in May 2020.
• China’s Yangzijiang Shipbuilding (YZJ Group) entered Industry Corp (CSIC) to rejoin China State Shipbuilding Corp (CSSC). Minsheng Financial Leasing 6,000 • Hudong-Zhonghua and MOL signed an order for the
into a joint venture with Japan’s Mitsui E&S Shipbuilding Together, CSIC and CSSC will have more sales capacity than all of the South
CMB Financial Leasing 5,300 world’s largest LNG bunkering vessel. The 18,600 cbm
Korean shipbuilders combined, and a larger order backlog than any other vessel will supply LNG fuel to the world’s largest 23,500
shipbuilding conglomerate in the world. Cosco Shipping Leasing Co Ltd 5,200
teu container ships under construction at Hudong Zhon-
• It is also rumoured that China Merchant Group could take over the CSSC Leasing 3,200 ghua and SWS for CMA CGM. The ship is the first LNG
shipbuilding activities of AVIC,, giving the company control of AVIC Weihei CDB Financial Leasing 3,200 bunker vessel in the world to use the membrane Mark III
and AVIC Dingheng yards. Flex containment system.
AVIC Leasing 2,100
• 8 Ropax orders were placed in China by European owners
CCB Leasing 1,700
in 2018:
Chinese leasing companies Others 3,400
Financial leasing companies have become a force to be reckoned with in • 4 at AVIC Weihai by Stena (3,600 lane meters/1,200
shipping. In the last few years, Chinese financial lessors, usually but not always passengers) that follow an initial order in 2016 of
the subsidiaries of leading Chinese banks, have filled the funding gap left by 4 similar units. The first ship is to be delivered in
European commercial lenders. Some significant orders in 2018 2020 and thereafter every 6 months.
But some of these Chinese financial lessors have also entered into speculative • Shandong Shipping signed a significant dry bulk order for 10 x 180,000 dwt • 3 at GSI including 1 by DFDS (4,500 lm/600 passengers)
shipbuilding contracts to take advantage of prevailing low prices and also Capesize bulkers at Shanghai Waigaoqiao Shipbuilding (SWS), financed by for 2021 delivery plus 1 by Algerian state owned ENTMV
support the Chinese shipbuilding industry. Bocom Leasing and Huachen Leasing. The ten units will be taken on long-term (3,000 lm/1,800 passengers) also for 2021 delivery.
charter by Germany’s RWE.
In 2018, Chinese leasing companies allocated about $13bn to shipping, • 1 at Jinling for TT-Line (4,600 lm/866 passengers) for
versus $11bn in 2017. Both the number of companies and the value of their • Shanghai Waigaoqiao Shipbuilding (SWS) won an order for 2 Vista-class delivery in 2022. An option should be declared in 2019.
shipping portfolios will continue to expand. The market has already evolved luxury cruise vessels for delivery in 2023 and 2024 from CSSC Carnival, a
from a core of 5 top leasing companies some eight years ago, to more than joint venture between Chinese state-owned CSSC and the Carnival Group.
30 companies today. The ships will have capacity for over 5,200 passengers, and have an en-bloc
contract price of $1.54bn. If a further four options are exercised, the contract
The world's first VLCC In 2018, some $3.3bn of lease finance was provided by ICBC Leasing, followed could total $4.62bn (RMR32bn), which would represent the largest ever order China's leasing
by $2bn from Bank of Communications Financial Leasing, with CMB Financial in China’s shipbuilding history.
with auxiliary wind Leasing with $1.5bn in third place. New entrants to the market included companies allocated
SIPG Financial Leasing and SPDB Financial Leasing, part of Shanghai Pudong
power was delivered Development Bank. $13bn to shipping
18 Picture: NEW VITALITY, the world's first VLCC with wind-power auxiliary sail propulsion, 306,752 dwt, built by Dalian Shipbuilding in 2018 for CMES. BRS GROUP - Annual review 2019 BRS GROUP - Annual review 2019 19SHIPBUILDING
SHIPBUILDING IN SOUTH KOREA
Shipbuilding in South Korea 2017 2018
South Korea
Korea maintained its position as the second largest m dwt Ships m dwt Ships
shipbuilder in 2018, ranking second for its 63.8m dwt Market share 24.4% 396 27.5% 465
orderbook (a 27.5% market share) and also for its 30.4m Bulk 5.9 19 5.7 21
dwt of newbuilding orders (26% market share). However,
Orderbook Tanker 31.5 219 35.7 217
it ranked third for its tonnage output 19m dwt (24%), just
behind Japan’s shipbuilders with 20m dwt (25%). Container 7.4 47 11.9 95
Korean shipyards won 5% fewer orders by deadweight All ships 52.4 396 63.8 465
in 2018 compared to 2017 but managed to increase the Bulk 5.9 18 0.5 5
number of orders by about 20%. They also succeeded in Tanker 20.1 118 16.0 98
securing all 65 large LNG carrier orders placed during the
Orders Container 4.3 28 7.2 66
year, and nearly 55% of all new containership orders. A sign
of the consolidation in the country, 92% of orders in 2018 Gas 1.6 25 6.5 75
were secured by the 'Big Three': Hyundai Heavy Industry All ships 32.0 193 30.4 247
with 46%, DSME with 29%, and Samsung with 17%.
Bulk 1.2 8 0.7 3
Korean shipbuilding output decreased from 30.8m to
Tanker 20.1 152 11.9 100
19m dwt, but the ratio between the current orderbook
and output rose from 1.7 at end 2017 to 3.4 at end 2018. Deliveries Container 5.7 41 2.7 18
Gas 3.4 61 3.7 53 for the year, in fact receiving 132 new contracts worth $13.7bn. The company Dae Sun Shipbuilding and Engineering secured 5 orders
Korea’s shipbuilders maintained their lead in the tanker
remains optimistic for 2019 and has set a target of $15.9bn for the year in 2018 (2 Handysize bulkers, 1 Handy Tanker and 2
segment, capturing some 63% (16m dwt) of tanker All ships 30.8 272 19.0 178
($8bn for Ulsan, $4.3bn for Samho and $3.5bn for Mipo). This represents small ferries). Korea Eximbank and other creditor banks
orders worldwide.
a near 20% increase on 2018. Faced with fierce competition from Chinese are still working with Dae Sun to restructure its debts.
yards, the group plans to establish a new research and development center
Daehan Shipbuilding regained its autonomy in 2018. The
in Pangyo to focus on core technologies in shipbuilding and other businesses
Some significant orders in 2018 operated by the group.
yard was previously placed under the management of
Most newsworthy events of the year DSME in 2017 to assist in its restructuring. The yard’s
• The 'Big Three' secured all of the 65 large LNG carriers
Samsung HI (SHI) secured $6.0bn of orders compared to its target of $8.2bn. focus is now on standard large tankers and it secured
ordered globally in 2018 (25 units for HHI, 20 for
Due to a lack of new orders, the company called on its workers to accept a orders for 12 Aframax and 4 Suezmax in 2018. This
DSME and 20 for Samsung). Rates for LNG carriers Consolidation, Restructurings and Bankruptcies program of unpaid leave in order to survive. SHI also agreed to build smaller compares to 6 Aframax in 2017 and no orders in 2016.
reached as high as $220,000 in 2018, while a shift
The Korean shipbuilding industry continued its vigorous reorganization in MR tankers for the first time, which had been previously reserved for Samsung
towards clean energy and lower emissions is also Hanjin Subic applied for rehabilitation at the end of 2018,
2018 (including capacity and labour reductions, lay-offs, and closures). Under Ningbo in China. It secured 5 MR2 tankers from Japanese trading house Mitsui
encouraging natural gas consumption. The industry a process where an insolvent company may ask for court
pressure from the government and national banks, all the yards are working for long-term charter to Chevron (2 units) and Cargill (3 units). For 2019, the yard
last saw a boom in ordering in 2011–12 in the wake and creditor approval to restructure its debts. Hanjin Subic
to reduce building capacity and cut costs. remains quite optimistic and is targeting $7.8bn of orders, which represents an
of Fukushima catastrophe. had entered into an autonomous restructuring agreement
increase of about 30% year-on-year.
The ‘Big Three’ might become the ‘Big Two’.. For decades, Hyundai Heavy in 2016 with its main creditor, Korea Development Bank (KDB).
• The 'Big Three' also picked up an order for 20 large
Industries (HHI), Samsung Heavy Industries (SHI), and Daewoo Shipbuilding & Daewoo Shipbuilding and Marine Engineering (DSME) exceeded its $5.0bn
containerships from Hyundai Merchant Marine Samkang Shipbuilding & Construction signed contracts
Marine Engineering (DSME) dominated the Asian shipbuilding scene. However, sales target for 2018 with $6.2bn of contracts. DSME is aiming for more than
(HMM). This domestic order (8 x 15,300 teu at HHI, 7 for 4 Aframax for foreign owners but unfortunately
the South Korean government is pushing for a consolidation that would see $8bn of orders in 2019.
x 23,000 teu at DSME and 5 x 23,000 teu at Samsung) failed to issue the refund guarantees. Samkang’s facility
just two dominant South Korean shipbuilders.
is supported by state-controlled Korea Ocean Business Hyundai Mipo Dockyard (HMD) continued to dominate the small and mid-tier is the former Goseong yard belonging to embattled STX
Corp (KOBC). DSME escaped bankruptcy in 2017 following two bailouts from its main lenders, shipyard segment, accumulating about 82% of new orders placed at Korean Offshore & Shipbuilding. It was set up in 2017 when Seoul-
Korea Development Bank (KDB) and the Export-Import Bank of Korea. As part yards of this size in 2018. It won 54 orders in 2018 against 51 in 2017, listed Samkang M&T joined forces with asset manager
• Hyundai Mipo secured an order to build up to 12 x
of the bailout, DSME had to cut more than 1,000 jobs, sell non-core subsidiaries, representing about 70% of its building capacity. Its main product is the MR UAMCO to acquire the yard as part of STX’s restructuring.
1,800 teu feeder containerships for Japanese tonnage
and implement a series of extensive cost-cutting measures. KDB and the Export- tanker and the company (including its Vietnamese subsidiary HVS) succeeded Samkang M&T is involved in steel-pipe production and
provider Nissen Kaiun which are understood to be for
Import Bank of Korea, which holds more than $2bn of DSME’s bonds, began a in winning about 45% of MR orders placed worldwide. the manufacture of ship blocks for domestic shipyards. It
long-term charter to Korea Marine Transport Co (KMTC).
sale process in the second half of 2018. They aim to complete the transaction in is currently building 2 x 6,600 dwt, IMO type 2 chemical
STX Offshore & Shipbuilding (STX) escaped receivership in 2018. Its main
• H-Line shipping has formalized orders for 3 x 180,000 2019 when DSME’s situation is expected to stabilise. tankers for a domestic owner at its existing site.
shareholder Korean Development Bank (KDB) decided to give the company
dwt LNG-fuelled Capesize bulkers from HHI. These
The establishment of KOBC was part of the South Korean government’s more time to pursue its self-rescue plan after the shipbuilder secured support
ships will be chartered to POSCO and will receive
five-year plan to revive its maritime industry. KOBC plans to support the from its labor union. The shipbuilder secured orders for 7 x 50,000 dwt MR
subsides of up to 6% of the newbuilding cost from the
construction of 200 ships. In its effort to help a struggling shipping and tankers in 2018, far below its target of 20 ships, but they were nonetheless
Korean state.
shipbuilding industry, South Korea has been criticized for its protectionist vital for its survival.
approach by other countries. The Shipbuilders’ Association of Japan has
Engineering, which filed for court
Sungdong Shipbuilding & Marine Engineering
written to its Korean counterpart, the Korea Offshore and Shipbuilding
Association, to express concern at the Korea Development Bank’s loans to
receivership in March 2018, is now for sale. A restructuring plan involving The 'Big Three'
the removal of 500 jobs, to follow the 300 cut earlier in May, failed to get
Korean yards won struggling shipbuilders. The European Community Shipowners Association and
the European shipbuilders’ association, Sea Europe, issued a joint statement
approval. Sungdong was established in 2003 and was originally a ship block Korean yards
manufacturer for DSME before becoming a shipbuilder in 2005. During the
100% of all LNG decrying perceived unfair trade practices in South Korea.
shipping boom, Sungdong grew into the world’s eighth-largest shipbuilder. It could become the
Hyundai Heavy Industries (HHI) secured some 46% of new orders placed in entered voluntary restructuring in 2010. However, the yard won only 5 orders
orders in 2018 Korea in 2018 versus 60% in 2017. The group met its sales target of $13.2bn in 2017 compared to 43 in 2013. 'Big Two'
20 BRS GROUP - Annual review 2019 BRS GROUP - Annual review 2019 Picture: TORM HERDIS, LR2 tanker, 115,109 dwt, delivered by GSI in 2018 to TORM in Denmark. 21SHIPBUILDING SHIPBUILDING
SHIPBUILDING IN JAPAN SHIPBUILDING IN EUROPE
Shipbuilding in Japan Shipbuilding in Europe • Romania is now in fifth position by size of orderbook.
Japan maintained its third place in 2018, ranking European shipyards saw a 37% increase in orders in 2018, at 106 contracts Its largest yard Daewoo Mangalia (DMHI) became
2017 2018 Damen Shipyards Mangalia in 2018 after DSME’s 51%
third with an orderbook of 55.5m dwt (29.9% market Japan versus 77 in 2017. This increase was mainly due to orders of cruise ships (36
share) and also third for its 21.3m dwt of newbuilding m dwt Ships m dwt Ships units), dry cargo ships (30) and ropax/ferries (21). majority was sold to the Damen Shipyards Group.
orders (18%). However, it placed slightly ahead of Korea Market share 25.1% 750 23.9% 730
Under the deal, a 2% stake was transferred to 2MMS, a
A total of 36 cruise ships were contracted in 2018 compared to 30 in 2017 joint venture controlled by the Romanian government.
for tonnage output, at 19.8m dwt (25%) versus its Bulk 27.9 368 32.9 412 (25 in 2016, 21 in 2015, 16 in 2014, 10 in 2013 and 4 in 2012). The three This leaves the Romanian government with a
competitor’s 19 m dwt (24%).
Orderbook Tanker 15.4 215 13.3 164 major builders, Fincantieri, Meyer Werft and Chantiers de l’Atlantique, controlling interest, while Damen retains operational
Japanese shipbuilders doubled their new orders in 2018, received 20 orders, while the remaining 16 orders were shared among eight control of the yard. Romania’s other shipbuilders,
Container 7.0 53 6.8 63
at 21.3m dwt compared to 2017’s 11.2 m dwt. Demand other shipyards. Europe’s yards are determined to hold onto the market for Constanta, Vard Tulcea, Vard Braila and Damen Galatz,
was higher in all three of the main segments (bulker, All ships 54.0 750 55.5 730 small cruise ships. The orderbook of the three major European builders now remain active.
tanker, container carrier). Although 35 Japanese yards Bulk 7.7 98 14.2 178 stretches until 2027.
secured orders in 2018, Japan’s three largest shipyards • Despite political uncertainty, Turkey’s shipbuilders
Tanker 2.8 36 3.9 44 maintained their sixth ranking, winning 12 orders in
Imabari, JMU and Oshima picked up 75% of the total (51%, Orders 2017 2018
16% and 8% respectively). Japan remains a strong player Container 0.5 6 2.8 36 Europe 2018 including 4 ferries: 2 x 120 m long ferries with
m dwt Ships m dwt Ships
in the bulk segment, with a significant increase in dry bulk All ships 11.2 167 21.3 292
LNG propulsion from Norway’s Havila Kystruten to be
orders in 2018, at 14.2m dwt versus 7.7m dwt in 2017.
Market share 1.6% 237 1.5% 288 built at Tersan, and 2 double-enders from Norway’s
Bulk 13.6 205 9.2 134
Ferry/ro-ro 0.09 30 0.1 42 Basto Fosen to be built at Sefine.
Japan recorded a slight increase in output from 19.8m Tanker 4.3 75 6.1 95
dwt in 2017 to 20.2m in 2018. The ratio between the Deliveries Orderbook Tanker 2.0 53 1.9 47 • Dutch shipbuilders moved up to seventh position
Container 1.5 12 2.9 26 thanks mainly to Royal Bodewes which secured 7
current orderbook and output remained flat at 2.8 end- Cruise 0.01 1 0.8 104
2018 versus 2.7 end-2017. All ships 20.2 337 19.8 312 orders in 2018. Ferus Smit successfully secured 12
All ships 3.4 237 3.6 288
smaller orders, including 5 x 5,000 dwt and 6 x 8,600
Ferry/ro-ro 0.1 36 0.7 21 dwt general cargo ships for Arklow Shipping.
• Mitsui Engineering & Shipbuilding (MES) will cease production at its Chiba Tanker 0.6 11 0.4 8 • Croatia felt to eighth position in 2018, having occupied
Some newsworthy events of the year facility after delivery of its last tanker at the end of 2019. Opened in 1940, Orders
Cruise 0.2 30 0.2 36 third position for several years. Pula-based Uljanik
Chiba was one of the main Japanese sites for building VLCCs. The decision Group is at breaking point and on the brink of collapse.
• Japanese shipbuilders face intense competition from follows MES’ alliance with Tsuneishi which produces large units in Zhoushan, All ships 1.1 77 0.9 106
China and Korea. Japanese shipowners, traditionally The yard’s inability to pay its bank loans, workers,
China, and Cebu, Philippines. MES’ Tamano site will also cease merchant Ferry/ro-ro 0.08 26 0.02 10 subcontractors and suppliers has led to the cancellation
extremely supportive of their national shipbuilding shipbuilding to concentrate on military vessels.
industry, are now more and more inclined to build Tanker 1.2 30 0.6 14 of several ships under construction, including 2 cruise
Deliveries
vessels in China or Korea where they can secure lower • Fukuoka Shipbuilding acquired Usuki Shipyard, following its earlier Cruise 0.09 9 0.0 12
ships, a livestock carrier and 2 ro-ros.
prices and earlier delivery dates. acquisition of Watanabe Shipbuilding. Both are located on Kyushu Island.
All ships 1.7 89 0.8 56
The Japanese stainless steel chemical tanker market will now be dominated
Japan lodged a complaint with the World Trade by three shipbuilders: Fukuoka (with Watanabe and Usuki), Kitanihon
Organization (WTO) alleging Korea was violating Shipbuilding and Shin Kurushima.
free-market principles by subsidising struggling
shipbuilders with loans granted by state lenders • Sanoyas Shipbuilding Corporation won its first merchant shipbuilding Most newsworthy events of the year
and export credit agencies. This includes Korea contract in three years. Local tonnage provider Shunzan Kaiun ordered two
Development Bank (KDB), the Export-Import Bank of 82,000 dwt bulk carriers for delivery in early 2020. deadweight, as for the other countries,
Ranking Europe's shipyards on the basis of deadweight
Korea (KEXIM), Korea Ocean Business Corporation, and would produce the following list:
• Spanish shipping company Elcano took delivery of its 2 MEGI 178,000 cbm
Korea Trade Insurance Association (K-Sure). Daewoo
LNG carriers from Imabari, the first ever LNG carriers built in Japan using • Russia’s shipbuilding industry retained its leading position in 2018, with
Shipbuilding & Marine Engineering (DSME) was a
the membrane Mark III Flex containment system. the largest orderbook by deadweight at 1.5m dwt. This was largely on
particular target of criticism, with Japan criticising the
substantial bailouts provided by KDB and KEXIM. The the back of several large domestics orders placed in 2017 by Rosneft
restructure of STX Offshore & Shipbuilding, Daehan and Sovcomflot. Five new tanker orders (2 Aframax for Rosneft and 3 MR
Shipbuilding, and Sungdong Shipbuilding & Marine Some significant orders of the year Tankers for a domestic owner) were placed at state-owned Zvezda Far
Engineering were also criticised. Eastern Shipyard.
• Kawasaki Heavy Industry won an order from Kumiai Navigation (KN) of
• Italy moved up to second position in 2018 with an orderbook of 0.4m dwt,
Singapore for a VLGC with LPG propulsion. It will be only the fourth vessel
due mainly to Fincantieri. The group succeeded in delisting Norway’s Vard
worldwide with LPG propulsion, together with 2 units ordered by Exmar at
from the Singapore Stock Exchange by purchasing additional shares to take
Hanjin Subic (if these are built, taking into account the latest developments at
its ownership up to 96%. The Italian group had previously been prohibited
the yard), and 1 by China’s Tianjin Southwest Maritime at Jiangnan.
from increasing its capital beyond 74.45%.
• Imabari secured 17 x 11,000 teu neo-Panamax containerships from Shoei
• Spain dropped to third position during 2018. Four Suezmax tankers have
Kisen Kaisha, the shipowning and leasing arm of Imabari Shipbuilding. Twelve
now been delivered from Navantia to local shipowner Ibaizabal, with two
units will be chartered by Green Compass Marine (6 units) and Evergreen
Japan's new orders Marine Hong Kong (6 units), subsidiaries of Evergreen Marine Corp. The other
remaining tankers under construction. Yards Armon and Barreras both
secured contracts for 2 ferries in 2018.
36 cruise ships
5 units will be chartered by Evergreen compatriot, Yang Ming.
doubled in 2018 • Germany’s orderbook is now in fourth position thanks to its three prolific were contracted
shipyards Meyer Weft, MV Werften, and Flensburger. Flensburger has
repositioned itself with several high-value cruise ferry orders. in 2018
22 BRS GROUP - Annual review 2019 BRS GROUP - Annual review 2019 Picture: BIT HERO, High Heat (250 C) Bitumen and Pitch Carrier, 9,921 dwt with ice class 1A, built by Turkey’s RMK in 2018 for Tarbit Shipping of Sweden. 23You can also read