California in 2050: Some Sizzling Predictions - December 2017 Kristin Ralff Douglas Policy & Planning Division - CA.gov
←
→
Page content transcription
If your browser does not render page correctly, please read the page content below
California in 2050:
Some Sizzling Predictions

         December 2017
       Kristin Ralff Douglas
    Policy & Planning Division
                                 1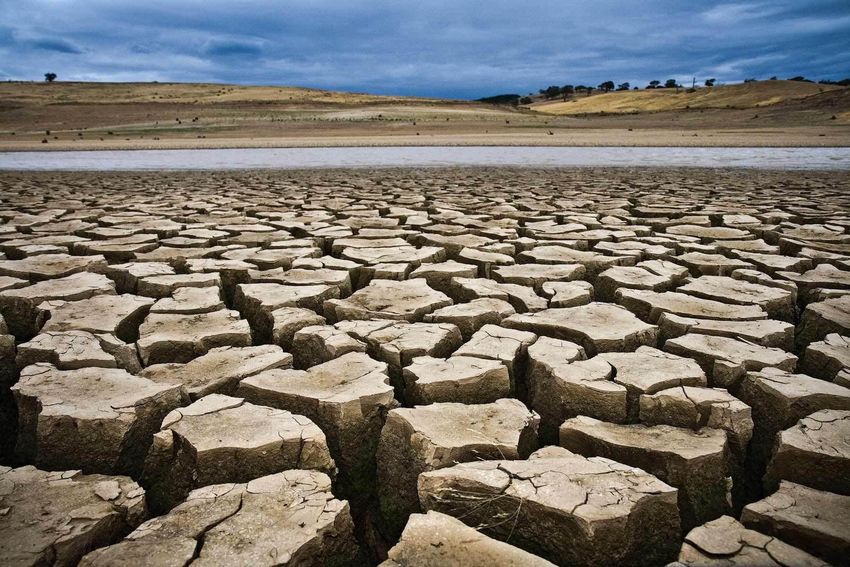
California is Experiencing Climate Change Now,
     and Larger Changes are on the Horizon

• As part of the CPUC’s Policy & Planning Division’s (PPD) ongoing work on
  climate change, PPD produced this slide deck to provide a review of recent
  research on the potential impacts of climate change to California in the
  near future.

• Understanding this research will assist the Commission and its
  stakeholders in their efforts to adapt the electric sector to those changes
  and consider adaptation issues in commission proceedings, especially
  those considering long-term investments.

                               Policy & Planning Division                       2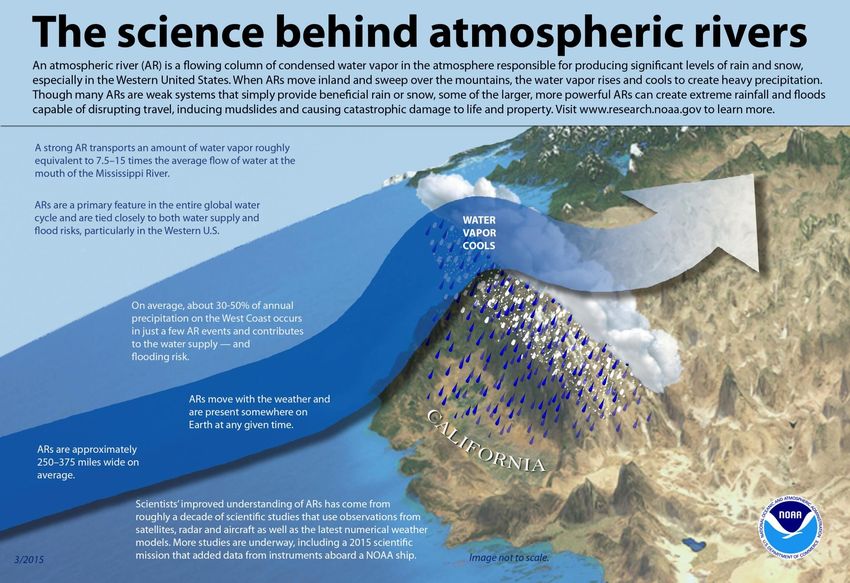
Key Findings from Recent Research on Future
          Climate Impacts to California
• Extreme heat days in cities like Fresno will likely triple by 2030, with a 60%
  chance of at least 3 heat waves lasting more than 6 days each year. By
  2050 it will be a 90% chance. (Cal-adapt)

• There is a 67% chance that sea levels in California will reach 6 inches by
  2030 and one foot by 2050. Under current emissions scenarios, by 2100
  sea levels could be up to 3.5 feet and potentially up to 10 feet. (Ocean
  Protection Council Working Group)

• There is an 80% chance of having a 30-year drought in the Southwest
  under current emission trajectories. (NASA)

• Wildfires are expected to burn 77% more area by 2050. (UCLA)

                                Policy & Planning Division                     3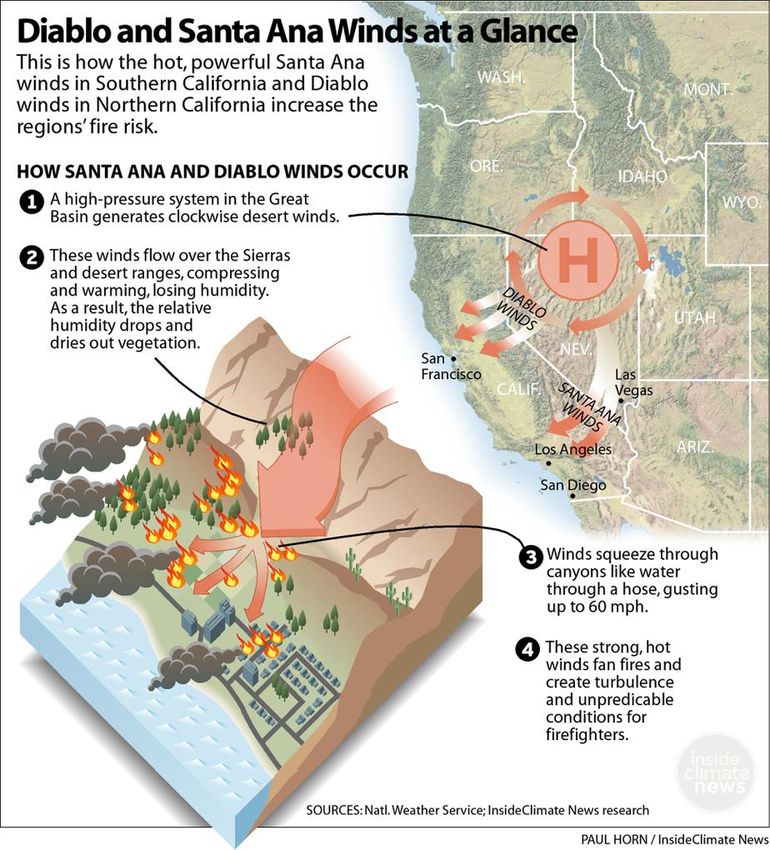
Presentation Outline

• Review a striking federal government study documenting significant global
  changes and specifically attributing those changes to human activity

• Review alarming research findings predicting dramatic changes in
  California for increasing:

    1.   Temperatures
    2.   Sea Level Rise
    3.   Drought and Deluge
    4.   Wildfires

                              Policy & Planning Division                  4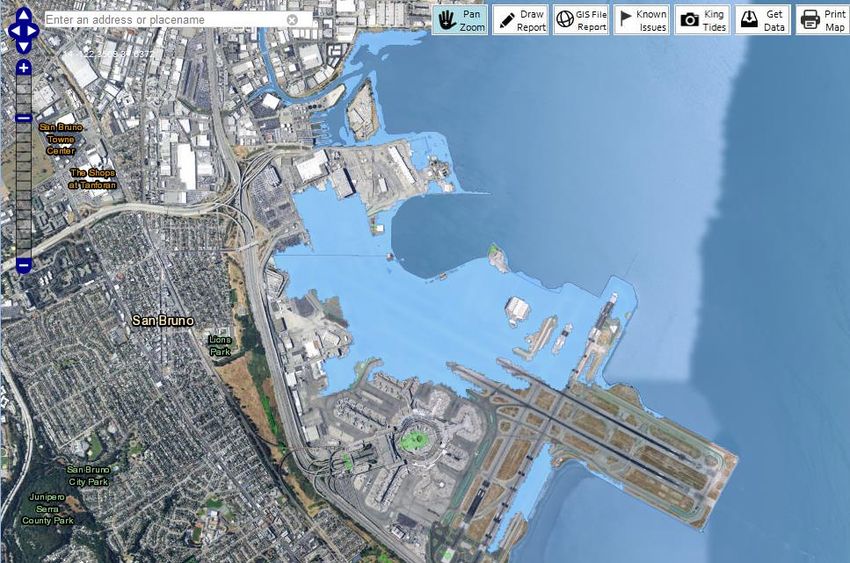
US Global Change Research Program
• USGCRP was mandated by Congress in 1990 to “assist the Nation and the
  world to understand, assess, predict, and respond to human-induced and
  natural processes of global change.” There are 13 participating US
  agencies including: NASA, DOE, and EPA

• Striking highlights from the recently released Climate Science Special
  Report:
    – Average global temperatures are rising faster than they have at any time in the
      past 1,700 years; they have increased by 1.8°F (1°C) from 1901-2016; 1.2°F
      (.65°C) of that change occurred between the period of 1986-2016
    – Human activities are the primary drivers of recent temperature rise; they are
      responsible for 92-123% of the observed changes from 1951 to 2010
    – 2014, 2015, and 2016 all set global temperature records
    – There is “high confidence” that recent record-setting temperatures will
      become “common” in the next few decades

                                 Policy & Planning Division                         5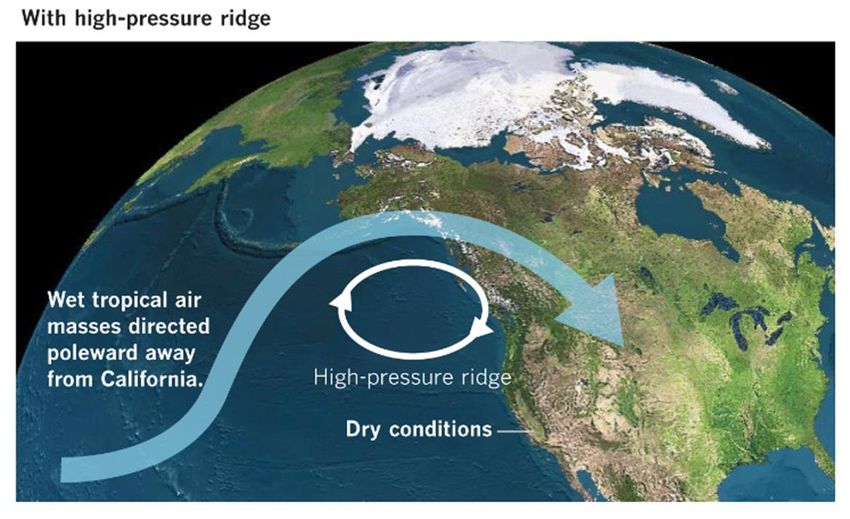
Key Findings From USGCRP Report (Cont.)
• California is already experiencing dramatic impacts from climate change
  with as little as 1.8°F (1°C) global average temperature increase.

• Even if emissions halted today, the globe is committed to at least an
  additional 1.1°F (.6°C) warming, reaching 2.9°F (1.6°C) – pushing us very
  close to the point many scientists believe is the “point of no return” –
  3.6°F (2°C).

• If emissions continue unabated we could reach 9°F (5°C) by end of
  century. Humans have never lived on a planet that hot.

                               Policy & Planning Division                     6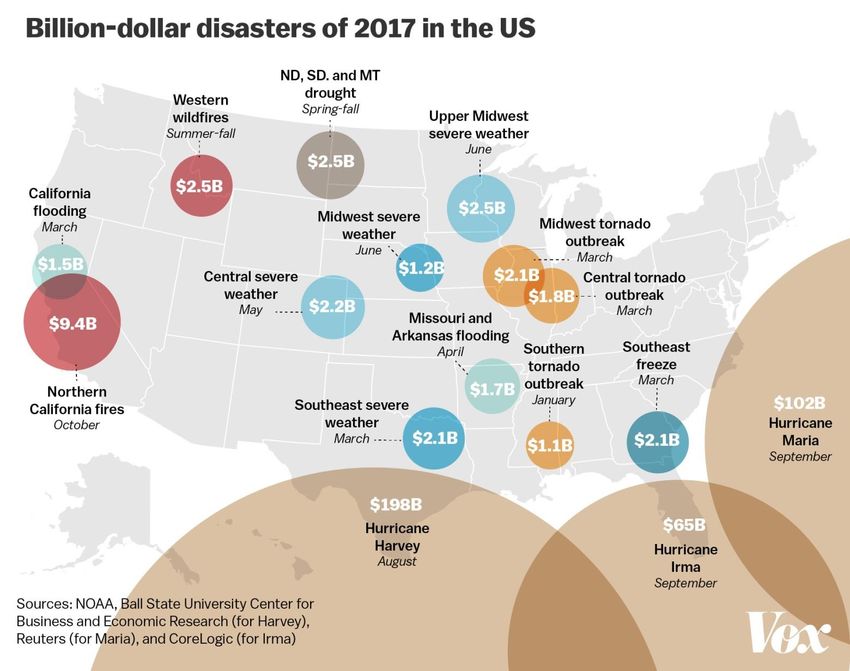
Climate Science Special Report Projects
         Alarming Temperature Increases
• Between 2021-2050 – temperatures are projected to rise by 4.3°F
  (2.38°C)
   – The increase in this time period is projected to be 2.5°F (1.38°C),
     which is in addition to the increase of 1.8°F (1°C) already experienced
   – Scientists generally believe 3.6°F (2 °C) is a critical turning point

• Between 2071-2100 – temperature increases are projected to range
  from 4.6°F (2.38°C) to 13.7°F (7.6°C) depending on emissions
   – The lower emissions scenario (RCP 4.5) would see additional increases
     of 2.8°-7.3°F (1.5-4°C) above the increases already experienced
   – The higher emission scenario (RCP 8.5) would see additional increases
     of 5.8°-11.9°F (3.2-6.6°C)
   – We are currently on the higher emissions path
                              Policy & Planning Division                       7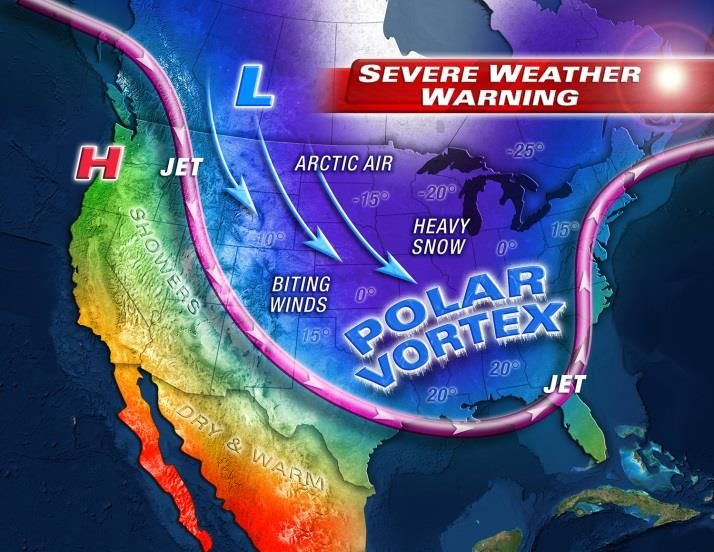
In Order to Avoid the Worst Impacts, Emissions
      Must Be Reduced Significantly Now

-- Governor Brown signed onto an article that presented this chart
-- Even California’s aggressive policies do not target zero emissions by 2040 or 2050
                                   Policy & Planning Division                           8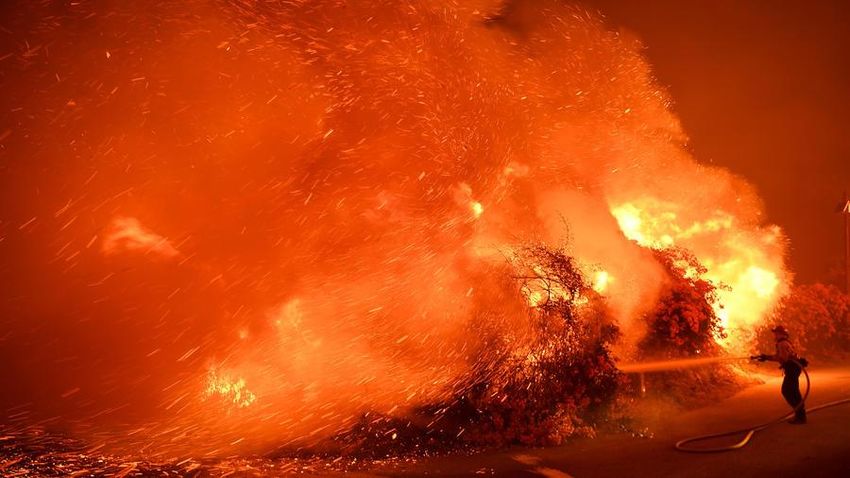
Global Temperatures are Increasing Due to
Higher Concentrations of CO2 in the Atmosphere

-- CO2 concentrations in the atmosphere drive temperature increases
-- CO2 is increasing at the rate of 3.2 ppm per year; by 2047 we will reach 500 PPM
-- 400PPM could commit the globe to average warming of between 1.8° – 7.2°F (1°-4°C)
– 500PPM could commit the globe to warming of 3.6°- 9°F (2°-5°C) (Climate Central)
                                  Policy & Planning Division                       9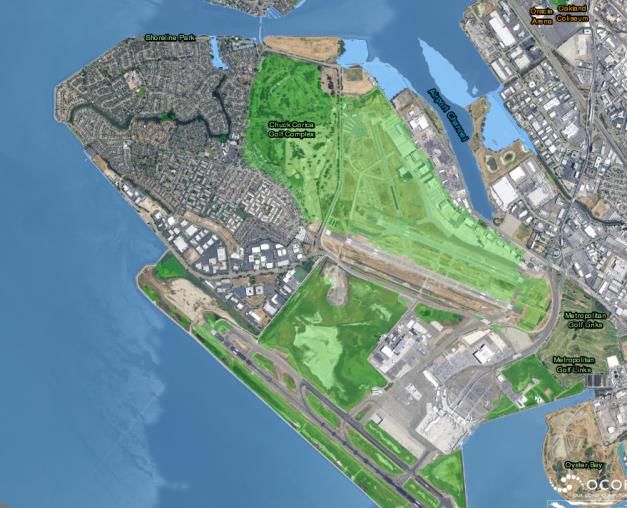
FYI: The Last Time CO2 Levels Were This High,
             Humans Didn’t Exist

                 Policy & Planning Division     10
1. Temperatures In California Are Rising
Policy & Planning Division 11Fresno Could Experience Extreme Heat
From cal-adapt.org. Emissions continue to rise strongly through 2050 and plateau around 2100 (RCP 8.5) . Days above derived from HadGEM2-
ES model
-- Graph from Cal-adapt.org; using HadGEM2-ES model (dry and hot scenario)
-- Each dot represents a day over 106.6°F; the yellow dots are days up to 124°F
-- Starting in 2020 the number and intensity of extreme heat days clearly increase
Policy & Planning Division 12Extreme Heat in Fresno: Significant Increase in
the Number of Days over 106.6 °F
• Historical Average
– Historical Average is 4 per year
– More recent average is 6
– Historical average of heat waves (>5 days): 2.5
• Between 2030-2040
– No. of extreme heat days and nights: 7-32, average 20
– No. of heatwaves: annual average is 2.5 lasting 6 days (plus a 60%
chance of having at least three)
• Between 2040-2050
– No. of extreme heat days and nights: 9-37, average 22
– No. of heatwaves: annual average is 2.5 lasting 9 days (plus a 90%
chance of having at least 3, and a 50% of having at least 1 lasting >11
days)
Policy & Planning Division 13California Becomes Arizona? -- 96% of residential customers in AZ have air conditioning, only 60% in CA currently do -- Studies predict increasing temperatures will cause more Californians to buy air conditioning units. Even a 50% increase in residential usage brings California close to Arizona household usage, and even closer in prices. The average cost is $1500 per household, which means the higher end could be $3000 per household. (EIA) 14
Impacts of Extreme Heat to the Grid

• Many studies show that extreme heat has significant impact
  to the grid including:
   – Line sag decreases transmission efficiency
   – Thermal efficiency of power plants decrease
   – Thermal efficiency of solar panels also decrease and wind speeds
     often slow (a new study shows decrease in wind production across the
     northern hemisphere of 8-40%)
   – Assets such as transformers can not cool down and overheat, causing
     them to break or to operate less efficiently and require more
     maintenance
   – Cooling demand increases significantly during both day and night

                            Policy & Planning Division                 15
2. Sea Level is Rising in California
Policy & Planning Division 16Studies Show Sea Levels Are Rising
-- This chart is from a report issued in 2017 called Rising Seas In California
-- There is a 67% probability that seas will rise in San Francisco by 6 inches to 1 foot
by 2050; models show similar rise in most of California
-- Sea Level rise in California is more affected by the Antarctic sea melt
Policy & Planning Division 17Sea Rise Will Quickly Impact
Critical Infrastructure
SFO
OAK
-- SFO and OAK under 25 cm (9.8 inches) sea level rise with 20-year storm surge
-- Graphic From Our Coast, Our Future (OCOF) collaborative
Policy & Planning Division 18Critical Electric Sector Infrastructure Could Also be Impacted:
IOUs Assessing Asset-by-Asset Climate Vulnerabilities
-- This chart is from a report issued in
2016 by Pacific Gas & Electric, Climate
Change Vulnerability Assessment
Policy & Planning Division 19Impacts of Sea Level Rise to the Grid
• Studies have shown that sea level could have significant
impact to the electric and natural gas infrastructure
• Sea water is corrosive and could permanently damage
equipment
• The weight of sea waters rising could impact natural gas
pipelines
• All three IOUs anticipate that major substations will be
impacted with 24 inches of sea level rise
Policy & Planning Division 203.1 Drought in California
Policy & Planning Division 21Melting Arctic Sea Ice May Cause Multi-year
Droughts in California
-- Current levels of sea ice steer
wet tropical air towards
California
-- Less Arctic ice drives wet
air away from California and
encourages the formation of
high pressure ridges, which
prevents precipitation from
reaching California
Policy & Planning Division 2230-yr Mega Droughts Predicted for Future
• NASA study predicts that droughts in the Southwest could be
drier and longer than they have been in the last 1,000 years.
• Results of modeling show drought similar to 1930s 8-year long
dustbowl could last 30-35 years.
• Likelihood of a mega drought lasting more than 3 decades is:
– 12% if emissions stop today
– 60% if emissions decline starting mid century
– 80% if emissions continue to increase along current trajectories
throughout the 21st century
Policy & Planning Division 23Impacts of Drought to the Grid
• Scientists have highlighted a variety of concerns regarding the
impact of drought on the California Grid:
– Carbon emissions could increase if hydropower decreases, as
California relies on hydropower for zero-carbon emissions
– Lack of water would impact operations of many types of power plants,
including natural gas and solar thermal, which use water for
operations
– Drawing groundwater causes subsidence and impacts all infrastructure
including electric sector infrastructure
– Droughts are increasingly regional, so Northwest hydropower
production will decrease at the same time that increasing
temperatures increase demand in the WECC.
Policy & Planning Division 243.2 Droughts Interspersed With Deluge
Policy & Planning Division 25Atmospheric Rivers Are Predicted
to Become More Intense
• California receives the majority of its rainfall/snowfall from storms
caused by atmospheric rivers (aka Pineapple Express)
• Climate models and basic physics suggest that atmospheric rivers will
become moister and more intense in the future, as a warmer
atmosphere can hold more water vapor (about 4% more for every
degree 1°F of warming). (MIT)
• A recent study by the Massachusetts Institute of Technology estimates
the number of storms will more than double (from 4 to 9) by 2100.
• Experts say more modeling of atmospheric rivers must be conducted to
fully understand changes due to climate change.
Policy & Planning Division 26Policy & Planning Division 27
January 2016 News Headline:
  Warming Pacific Ocean Could Bring Hurricanes

-- Only two storms have hit Southern California; one direct and one that hit Baja first
-- As seas warm, storms could hold together longer and hit Southern California more
often, coming over from Hawaii or up from Mexico
                                    Policy & Planning Division                            28
Melting Arctic Ice Also Causes the Polar Vortex
-- As the cool air of the Arctic
becomes warmer, the jet
stream slows down, becomes
wavy, and releases the cold
air further south
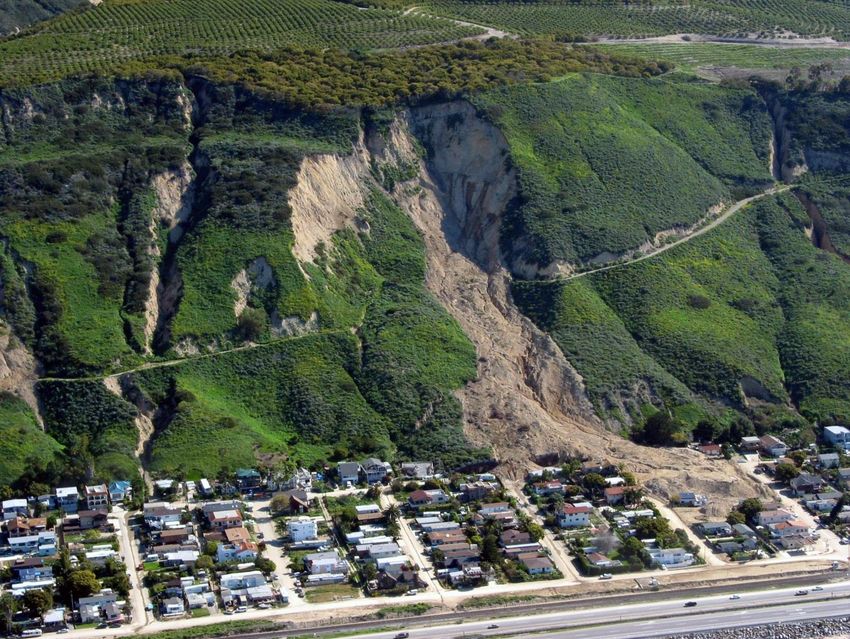
Policy & Planning Division 29Impacts of Deluge to the Grid
• Scientists have highlighted concerns of impact of atmospheric rivers
to the electric sector including:
– Our current reservoir system is not designed to handle significant
amounts of rain in a single year
– There are heightened risk of massive mud slides in areas scarred by
wildfires, which can wipe out electric sector infrastructure
• A new climate regime swinging between extreme drought and
extreme rainfall will require new approaches in planning.
• MIT is conducting research to understand the impacts of deluge to
the grid
Policy & Planning Division 304. Wildfires in California
The 2017 Thomas fire as seen from space
Policy & Planning Division 31Wildfires or Firestorms?
• Wildfires are exacerbated by drought, atmospheric rivers,
temperature increases, and by high pressure systems inland which
increase wind (Santa Anas)
• US Forest Service says an “unprecedented” 165 million trees are
dead in California, and are fodder for wildfire and bark beatles
Policy & Planning Division 32Policy & Planning Division 33
Future Wildfires
• As the temperatures in the Great Basin increase, the length of the
  Santa Ana season is likely to extend beyond the current October to
  December timeframe.

• Under a scenario where the melting artic creates stronger and more
  frequent high pressure systems over California, the land is drier and
  more prone to wildfire throughout that season.

• However, recent research shows the frequency of high-wind events
  has actually decreased over the last several decades, which shows
  that more research is needed. (UCLA)

                            Policy & Planning Division                 34
Future Wildfires To Significantly Increase in Size
• Research by UCLA projects that
fires in Southern California will
become more destructive
because of hotter drier
conditions.
• The area burned in Santa Ana
fires is projected to increase
64%
• The area burned in NON-Santa
Ana fires is projected to
increase by 77% by 2050.
Percent Increase in Median Annual Area Burned
with a 1ºC Increase in Global Average Temperature
(National Research Council) Policy & Planning Division 35Impacts of Wildfire to the Grid
• Recent wildfires in California raised concerns regarding the
proximity of electric equipment to highly populated areas
• Electric equipment can cause wildfires, and is also damaged by
wildfires from power lines to in-home smart meters
• Different conditions cause different fire types and profiles.
– Santa Ana wind fires have been responsible for half of all acres
burned, but 80% of the economic losses
– Non-Santa Ana fires were responsible for 70% of suppression costs
Policy & Planning Division 36Events in 2017 Cost the U.S. Billions in
Weather-Related Damage
Policy & Planning Division 37Current Decisions Affect Future Electric Sector
• California and its electric grid are already experiencing the impacts
of climate change.
• Knowing what the research foresees for the future helps align
current decisions with future reality because the past is no longer
the predictor of the future.
• Investments in climate mitigation to reduce emissions will pay
dividends, as will investments in climate adaptation because the
research demonstrates that the changes are happening and will
continue to happen.
Policy & Planning Division 38Presentation Summary
• There is significant evidence of climate changes already taking place
in California and around the globe including increased
temperatures, drought, wildfire, and sea levels.
• The sooner that mitigation strategies are implemented the lesser
the impacts
• Most changes will happen with increased volatility, not with a
smooth transition to a new normal
• Even with aggressive mitigation strategies, adaptation measures
must be implemented due to projected impacts
Policy & Planning Division 39Links to Reports
• US Global Research: https://www.globalchange.gov/
• Cal-Adapt.org: http://cal-adapt.org/
• Wind Power Decreasing: https://www.nature.com/articles/s41561-
017-0029-9
• Rising Seas in California:
http://www.opc.ca.gov/webmaster/ftp/pdf/docs/rising-seas-in-
california-an-update-on-sea-level-rise-science.pdf
• Our Coast, Our Future: http://data.pointblue.org/apps/ocof/cms/
• Lawrence Berkeley National Labs study on Artic Ice Loss:
https://www.nature.com/articles/s41467-017-01907-4
• NASA study on Mega Droughts:
https://www.nasa.gov/press/2015/february/nasa-study-finds-
carbon-emissions-could-dramatically-increase-risk-of-us
Policy & Planning Division 40Links to Reports (con’t)
• Water usage for power sector: https://www.ucsusa.org/clean-
energy/energy-water-use/water-energy-electricity-
overview#.WjlmHHa1t7c
• Atmospheric River research:
https://www.esrl.noaa.gov/psd/arportal/
http://journals.ametsoc.org/doi/10.1175/JCLI-D-16-0544.1
• UCLA Wildfire Study:
http://iopscience.iop.org/article/10.1088/1748-
9326/10/9/094005/meta
Policy & Planning Division 41You can also read