Camels Head Risk Profile 2018/19 - Devon & Somerset Fire & Rescue ...
←
→
Page content transcription
If your browser does not render page correctly, please read the page content below
Camels Head Risk Profile 2018/19
Camels Head Risk Profile 2018/19 2
Overview
one Crew Managers and six Firefighters. Staff are Below are the Officers in charge of this station.
involved in delivering a range of Community Safety
activities that are primarily aimed at preventing fires
as well as deaths and injuries in fires.
The station area is home to a range of risks, including
HM Naval Base Devonport which is one of three
principal base ports for the Royal Navy fleet. Much of
the Naval Base site is operated by Babcock Marine
Watch Manager Watch
who are the main contractor of the nuclear licensed Young Manager
site. Babcock also provide docking, construction and White Watch Hanks
refitting facilities for the Military and Civilian
companies.
This plan presents the risks in your area and The main arterial route between Devon and Cornwall
the actions that Devon & Somerset Fire & passes through the station area and crossing the
Rescue Service (DSFRS) will take to make the River Tamar via Tamar Bridge through the Saltash
community safer. Our actions are a mix of Tunnel which Camels Head form part of the response
to. The Torpoint ferry landing slip also falls in the Watch Manager Watch Local Risk
activities based on prevention, protection and Kerr Manager Manager Davis
station area.
emergency response, all undertaken by the Red Watch Weedon
people that are best suited for each activity. Blue Watch
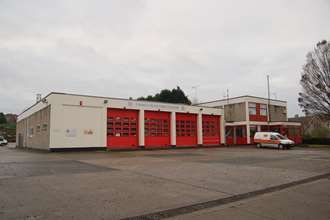
Camels Head Fire Station is located in Ferndale Road,
Weston Mill, Plymouth close to the Camels Head Gate
entrance to HM Naval Base Devonport Station area To discuss the content of this plan with a
covers the western side of Plymouth an area of member of the fire service, please use the
approximately 12.20 square kilometres and a
population of 52,530 people.
contact details below:
The Watch Manager has overall responsibility for the Name: Local Risk Manager Shaun Davis
station. Personnel, in addition to their traditional Tel: 01752 333681
firefighting and community safety roles, are Technical Email: stevehill@dsfire.gov.uk
Specialist Rescue trained in order to respond to
For more information please visit
incidents involving water rescue and rope rescue. Each
www.dsfire.gov.uk/yoursafety
watch consists of 8 personnel – one Watch Manager,
www.dsfire.gov.uk V1.0 Published April 2018Camels Head Risk Profile 2018/19 3
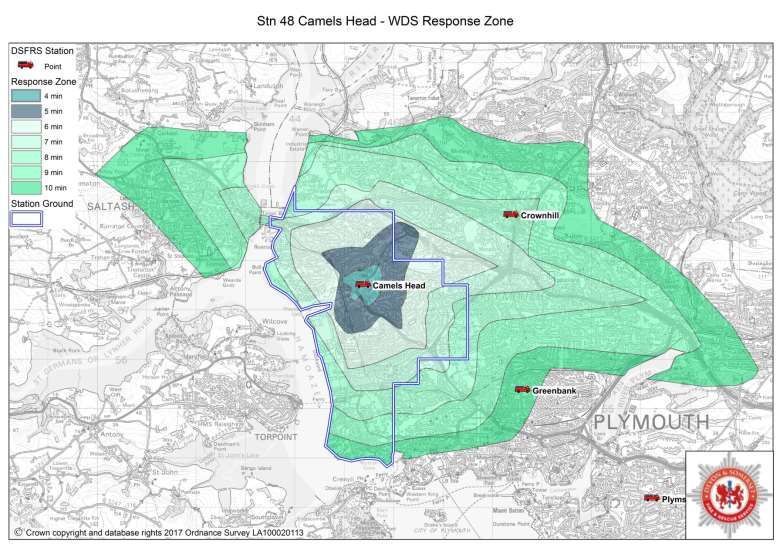
Our Response
The map opposite shows an
estimate of how long the fire engine
will take to reach residents in
Camels Head from the time they
make the call. It will naturally take
us longer to get places further away
from the station.
Residents of Camels Head should
take the following precautions to
help keep them safe from fire:
Fit a working smoke alarm
Take care when cooking
and never leave cooking
food unattended
Plan and practise your
escape route
Make a bedtime check
Don't overload your electrics
Put cigarettes right out
Use candles carefully
Have your chimney swept
regularly
www.dsfire.gov.uk V1.0 Published April 2018Camels Head Risk Profile 2018/19 4
Prevention and Protection
We maintain a very simple philosophy that prevention is better than cure and we recognise that risk reduction begins with safe behaviours at home, at
work, or on the road, and this leads to a safer society for all. We have developed a community safety strategy to focus our work and set our levels of
resourcing where we have most risk. Using our knowledge, along with that of local organisations and partners we will target those people and
properties that are more likely to be affected by fire and other emergencies, according to our risk analysis and risk profiling. The risks identified at
Camels Head station have been identified below, our prevention and protection work will be prioritised accordingly.
Youth
Health
Dwelling Business Road Community Water Development
& Heritage
Fires Safety Safety Resilience Safety & Community
Wellbeing
Cohesion
Risk Key
VERY HIGH HIGH MEDIUM LOW VERY LOW
www.dsfire.gov.uk V1.0 Published April 2018Camels Head Risk Profile 2018/19 5
Our Incidents
The activity information for this local community area is shown in the tables below.
Incidents attended (within station area)
Five Year
Station - 48 Camels Head 2012/13 2013/14 2014/15 2015/16 2016/17
Average
All Fires 163 199 204 158 179 181
Fires where people live (primary) 47 50 62 52 52 53
Fires where people work and visit (primary) 38 44 32 36 39 38
Fires - outdoor and refuse fires (secondary) 74 103 108 69 88 88
Chimney Fires 4 2 2 1 0 2
All False Alarms 168 183 177 151 167 169
False Alarms - Automatic Fire Alarms 96 99 104 82 105 97
False Alarms - Good Intent 62 74 64 63 60 65
False Alarms - Malicious attended 10 10 9 6 2 7
All Special Service Calls 119 145 121 122 149 131
Co-Responding 2 2 3 1 8 3
Road Traffic Collisions 18 20 19 23 14 19
Flooding & Water Rescues 14 10 12 10 12 12
Other Special Service calls 85 113 87 88 115 98
All Incidents 450 527 502 431 495 481
All Incidents minus False alarms 282 344 325 280 328 312
All Incidents minus False alarms and Co-Res. 280 342 322 279 320 309
Station Availability
In the 12 months from April 2016 to March 2017 the station was able to
crew the following appliances
% Hours
Hours Unavailable
Availability
Fire Engine 1 Wholetime 0 100.0%
www.dsfire.gov.uk V1.0 Published April 2018Camels Head Risk Profile 2018/19 6
Station Response Activity:
The table below shows the number of times the local fire station was called out (which may or may not have resulted in attending an incident). It also shows the
number percentage of calls on and off the station ground.
5 year
Station - 48 Camels Head 2012/13 2013/14 2014/15 2015/16 2016/17
average
Total Turnouts 947 1126 712 657 701 829
Turnouts to incidents on Station Ground 547 676 414 381 405 485
% of Turnouts to Incidents on Station Ground 57.8% 60.0% 58.1% 58.0% 57.8% 58.5%
% of Turnouts to incidents not on Station Ground 42.2% 40.0% 41.9% 42.0% 42.2% 41.5%
Station Demand 2012/13 - 2016/17*
The graphs below demonstrate the peak demand on the station in terms of time of the day and month of the year.(*Incidents in station area, not including false
alarms or co-responding)
Hour of the day Month of the year
50 60
Annual Number of Incidents
Annual Number of Incidents
50
40
40
30
30
20
20
10 10
0 0
0 1 2 3 4 5 6 7 8 9 10 11 12 13 14 15 16 17 18 19 20 21 22 23 Jan Feb Mar Apr May Jun Jul Aug Sep Oct Nov Dec
Hour of Day Month of Year
5 yr Average - Stn 48 2016/17 - Stn 48 5 yr Average - Stn 48 2016/17 - Stn 48
www.dsfire.gov.uk V1.0 Published April 2018You can also read