Can Management Actions Within the Fiji Locally Managed Marine Area Network Serve to Meet Fiji's National Goal to Protect 30% of Inshore Marine ...
←
→
Page content transcription
If your browser does not render page correctly, please read the page content below
Can Management Actions Within the Fiji Locally Managed
Marine Area Network Serve to Meet Fiji's National Goal to
Protect 30% of Inshore Marine Areas by 2020?

Morena Mills, Stacy Jupiter, Vanessa Adams, Natalie Ban, Bob Pressey
This work was supported by an Early Action Grant to the national Protected Area Committee from
UNDP‐GEF and a grant to the Wildlife Conservation Society from the John D. and Catherine T. MacArthur
Foundation (#10‐94985‐000‐GSS). Some text from this document is excerpted from a paper currently
under review in Conservation Letters.

© 2011 Wildlife Conservation Society Fiji Country Program and ARC Centre of Excellence for Coral Reef
Studies, James Cook University, Australia

This document to be cited as:
Mills M, Jupiter S, Adams V, Ban N, Pressey B (2011) Can management actions within the Fiji Locally
Managed Marine Area Network serve to meet Fiji's national goal to protect 30% of inshore marine areas
by 2020? Wildlife Conservation Society and ARC Centre of Excellence for Coral Reef Studies, Suva, Fiji, 16
pp.

Cover photo: (c) Stacy Jupiter
1
Executive Summary
In 2005 at the Barbados Plan of Action in Mauritius, the Fiji Government made a commitment
to effectively manage and finance at least 30% of Fiji's inshore marine areas by 2020. Given that
much of the planning for inshore marine management is undertaken by partners of the Fiji
Locally Managed Marine Area (FLMMA) network, this study was undertaken to evaluate
whether the expansion through the FLMMA network could achieve national conservation
objectives by 2020. The work was completed as part of a prioritized action for quarter 3 of 2011
under Fiji's National Biodiversity Strategy and Action Plan (NBSAP) Implementation Plan 2010‐
2014 thematic section for Inshore Fisheries.
We developed a model simulating opportunistic expansion of the FLMMA network to 2020
under business as usual conditions using data collected from key informant interviews to
identify factors driving establishment of fisheries closures in Fiji, data on the existing
distribution of closures, FLMMA documents and maximum entropy modelling. We additionally
compared this model to results obtained through systematic conservation planning techniques,
which by definition are designed to optimize the cost‐effectiveness of the management actions.
We found that under the opportunistic scenario, where conditions were designed to reflect an
optimistic continuation of the current conditions, the FLMMA network will achieve a good
portion of the national objectives, but will fall considerably short of the 2020 objectives. The
systematic planning scenario achieved a much higher proportion of objectives, which suggests
that systematic assessments could be useful to coordinate the FLMMA approach to help guide
development of the marine protected area network in Fiji.
TAKE HOME MESSAGES
Although the FLMMA network is designed to help communities achieve local
marine management objectives, it is also contributing a significant amount
towards achieving the Fiji Government commitment to protect 30% of inshore
areas by 2020. Thus, FLMMA should continue its good work and expand as
resources permit.
However, under business as usual, if Fiji Government solely relies on the FLMMA
network, it will not achieve its 2020 objectives. Therefore, Fiji should identify
approaches to incorporate a regional perspective into local conservation decisions
and coordinate individual LMMAs to fill existing habitat representation gaps.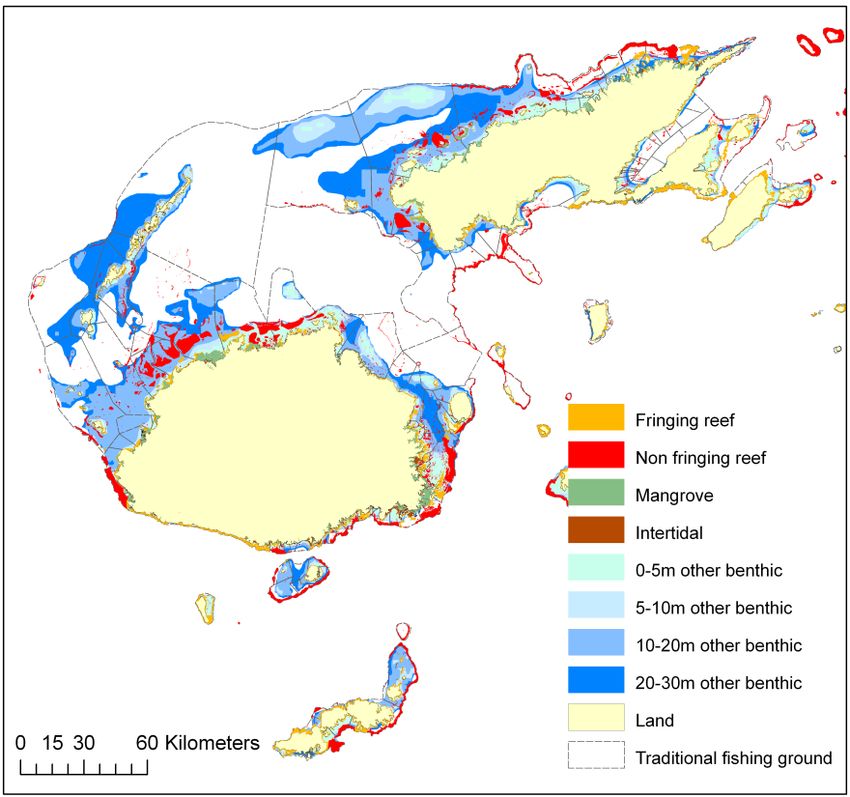
2
Nai Kau Ni Tukutuku
Na bose a vakayacori mai Mauritius ena 2005 e ya mai vakatututaka kina na matanitu e Viti
mena qarava ka vakailavotaka e rauta ni 30% nai qolioqoli ni bera na 2020. E dina ga ni ra
vakaitavi ena kena qaravi nai tuvatuva ni qoliqoli nai soqosoqo ka vakarurugi ena Fiji Locally
Managed Marine Area network (FLMMA), e ya mai vakayacori na vakadidike oqo me dikevi kina
na kena rawa ni sotava na veiqaravi ni FLMMA na vakatutu oqo ni bera na 2020. E mai
vakacavari na cakacaka oqo enai ka tolu ni wasese ni yabaki 2011 ena veiqaravi ni National
Biodiversity Strategy and Action Plan (NBSAP) Implementation Plan 2010‐2014 me baleta nai
qoliqoli e Viti.
Keitou a bulia e dua nai vakaraitaki ni kena vakalevutaki se vakatetei na veiqaravi ni FLMMA me
yacova na 2020. Ena gauna saraga oqo sa vakasokumuni kina eso nai tukutuku mai vei ira na
veiliutaki ena veikoro me laurai kina na veika e vakavuna tiko na kena tauyavutaki na vakatabui
ni dua nai qoliqoli e Viti. Keitou a vakatauvatana na veika oqo kei na macala ni vakadidike ka
rawa mai na “systematic conservation planning techniques” kina dua nai walewale ni
tataqomaki mena vakalailaitaka nai sau vakailavo ni kena cakacakataki nai tuvatuva ni veiqaravi
oqo. E laurai ni sa daumaka tiko na veiqaravi ni FLMMA ena gauna oqo, ka sotava e levu sara na
gagadre e vinakata na matanitu, ia na ririko ga e koto ni na sega ni sotavi na vakatutu ni 2020.
Nai tuvatuva ni veiqaravi oqo e sotava sara vakalevu na veivakatutu eso ka nanumi kina, ni,
kevaka erau na okati vata nai tuvatuva ni veqaravi oqo kei na walewale ni veiqaravi ni FLMMA
ena vukea na torocake ni vanua vakatabui se maroroi e Viti.
TUKUTUKU MO KAUTA LESU
E dina ga ni a yavutaki na FLMMA me vukei ira na veikoro ena kena rawati nai
naki ni kena qaravi vakavinaka nai qoliqoli, e sa veivuke tale tikoga ena nona
rawata na matanitu na vakatutu ni kena taqomaki e 30% ni nodai qoliqoli ni
bera na 2020. Sa dodonu me na tomana tikoga na FLMMA na cakacaka vinaka
oqo ka me vakalevutaki yani kevaka e levu tiko nai lavo, liganiveiqaravi kei na
gauna mena vakayacori kina na cakacaka oqo.
Ia kevaka e vakararavi tikoga na matanitu kina veiqaravi ni FLMMA, ena sega
ni rawata rawa na vakatutu ni kena taqomaki na 30% ni qoliqoli ni bera na
2020. Sa dodonu kina vua na matanitu me okati ira na veisoqosoqo tale eso me
vaka na otela kei na so tale nai tuvatuva ni veiqaravi me vukea na kena
vakalevutaka na veiqaravi ka veiganiti ki nai tuvatuva ni veikoro ka vakakina
na kena rawati nai tuvatuva ni matanitu.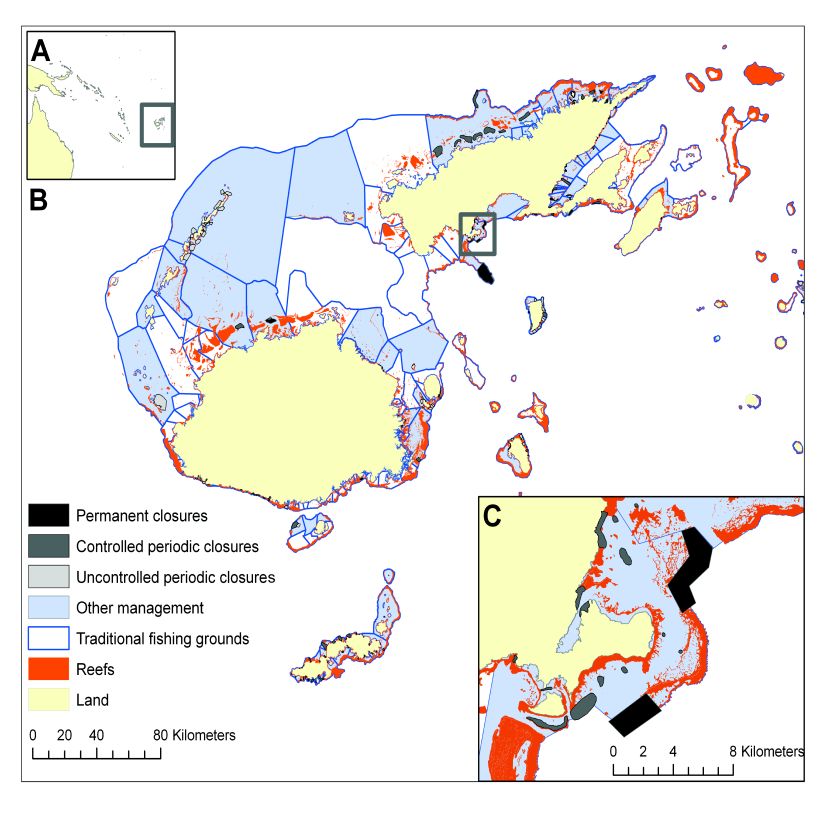
3

Introduction

         The Fiji Locally Managed Marine Area (FLMMA) network is a group of resource
management and conservation practitioners who focus on lessons learned about the benefits
and shortcomings of marine management actions in Fiji. The FLMMA network works to achieve
local objectives, integrates local knowledge and customs, and involves local resource users in
developing strategies and actions to sustainably manage fisheries resources and biodiversity for
the future (FLMMA 2010). These management strategies and actions may consist of permanent
closures, rotational closures, gear restrictions, seasonal/species bans, sacred sites, catch size
limits, and licensing controls (Jupiter et al. 2010). When any of these management actions are
applied within one of Fiji's 410 traditional fisheries management areas (qoliqoli), the entire area
within the qoliqoli is considered a locally managed marine area (LMMA). Currently, over 10,000
km2 of inshore marine waters are included within a network of LMMAs in Fiji, which has
expanded rapidly from 1 in 1997 to over 150 by 2009 (Govan et al. 2009).

        The establishment of LMMAs has mostly taken advantage of opportunities where
communities are interested in engaging in marine management and have been planned based
on local values and costs. There are clear advantages to this opportunistic approach because
the communities are engaged from the outset and have interest and ownership over the
management process (Clarke and Jupiter 2010). Theoretically, LMMAs can coalesce into
ecologically and socially functional networks of marine protected areas (MPAs) that achieve
national, as well as local conservation objectives. However, from a top‐down perspective, areas
that contribute little to national conservation objectives may not represent the optimal
allocation of resources (Pressey and Tully 1994).

        The Fiji Government made a commitment at the Barbados Plan of Action in Mauritius in
2005 to effectively manage and finance at least 30% of Fiji's inshore marine areas (Jupiter et al.
2010). Between 2009 and 2010, the Fiji National Protected Area Committee, in collaboration
with researchers at the ARC Centre of Excellence for Coral Reef Studies at James Cook
University (Australia), conducted a gap analysis to determine how much of Fiji's inshore marine
area was then effectively protected by the current management strategies in the LMMA
network. They used an innovative approach that considered the relative effectiveness of each
management strategy for different species groups across the main habitats for which national
data were available, including fringing reefs, non‐fringing reefs, mangroves, intertidal mudflats,
and other benthic areas (Figures 1 and 2) (Jupiter et al. 2010; Mills et al. in press). The results
indicated that Fiji will require approximately an additional 10‐20% effective coverage across
fringing reefs, non fringing reefs, mangroves and intertidal habitats to successfully achieve the
30% objective by 2020.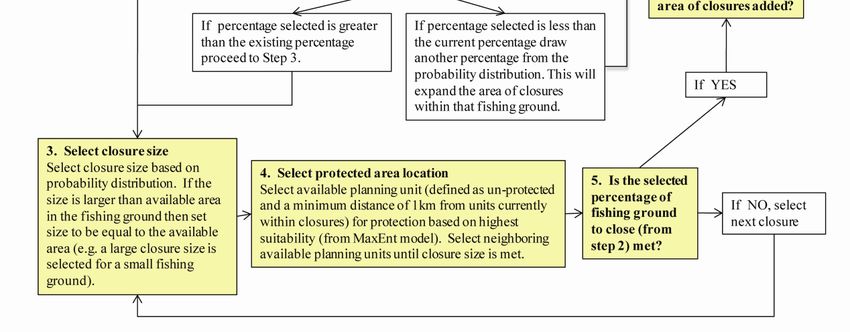
4

Figure 1. Management actions established by communities with the Fiji Locally Managed
Marine Area network. (Reprinted from Mills et al. 2011)

Figure 2. Map of habitats for which national data were available to complete a preliminary gap
analysis for Fiji. (Reprinted from Jupiter et al. 2010)
5

        Consequently, this study was undertaken to evaluate whether the expansion through
the FLMMA network could achieve national conservation objectives by 2020 given current
trends in the establishment of new LMMAs in Fiji. We report on a model simulating expansion
of the FLMMA network to 2020 using data collected from key informant interviews to identify
factors that influence opportunities for and constraints on implementing closures in Fiji. We
additionally compare this model to results obtained through systematic conservation planning
techniques. Systematic conservation planning is an approach to designing networks of
conservation areas to achieve specific objectives, such as protecting a defined amount of
biodiversity features, while minimizing costs to stakeholders characterized (Margules and
Pressey 2000). Intuitively, this more systematic approach should allocate conservation actions
most efficiently to achieve objectives. We compared the opportunistic approach currently
employed by FLMMA with a systematic approach to choosing sites for closures and determined
whether either approach would achieve national conservation objectives by 2020.

Planning Region and Data

        The study region covered Fiji’s inshore marine waters, extending across ~30,000 km2
from the high water mark to the outer barrier reef, within the 410 legally‐demarcated qoliqoli.
We used all available national‐scale data on the spatial distribution of the following marine
ecosystems: fringing reefs, non‐fringing reefs, mangroves, intertidal mudflats and other benthic
substrata. The latter included soft‐bottomed lagoons and seagrass, and was divided into four
depth classes (0‐5 m, 5‐10 m, 10‐20 m, 20‐30 m; Mills et al. in press). The habitat‐specific
conservation objectives were set by participants of the marine working group of the National
Protected Area committee during a workshop in 2010, based on the government’s 30% goal.
The objectives were 10% representation of other benthic substrata in all depth classes and 30%
for other habitats. At the same workshop in 2010, participants scored the ecological
effectiveness of the different management actions for major species groups found in each
habitat. A score of 1 represented the maximum level of protection from fishing and associated
damage (e.g. one would expect local fish populations to return to non‐exploited levels if the
population has not fallen below critical thresholds) and 0 represented no benefit from
management. No‐take closures, all given a value of 1, were assumed to be fully ecologically
effective although it was recognized that they might in fact have varying management
effectiveness (e.g. compliance with rules, enforcement capacity). Additional details on
definition of objectives, methods used for scoring and the effectiveness weightings for all
species groups across all target habitats can be found in Mills et al (in press).

       As progress toward Fiji's 2020 commitment has mostly been through opportunistic
implementation of community‐based LMMAs, we considered management actions currently
undertaken within the FLMMA network, for which data are available nationwide. LMMAs can
have multiple, simultaneously operating forms of management. Among these are permanent
closures where resource extraction is prohibited permanently. Conditional closures are divided
into two categories: those with controlled harvesting (harvesting allowed once per year or less
as dictated by a management plan or community decision) and those with uncontrolled
harvesting. Areas outside closures under “other management” have a suite of management
6

forms including bans on fishing gear, species bans and seasonal prohibitions. After one or more
closures are implemented within a qoliqoli, other management is applied across the remainder
of that qoliqoli (Figure 3) (Mills et al. 2011).

Figure 3. Schematic diagram of types of community‐based management actions that may be
implemented within a locally managed marine area (LMMA). (Reprinted from Mills et al. 2011)

Determining Suitability of Locations for New Fisheries Closures

        Our models required us to determine the suitability of each planning unit to be selected
as a fisheries closure. To understand drivers of the presence and location of closures, we
identified 24 potential key informants were identified using snowball sampling (Bernard 1994).
All had a minimum of 2 years of experience in establishing LMMAs and were members of
partner organizations within the FLMMA network. All were contacted and 11 replied and were
available for interviews (Table 1). We conducted semi‐structured interviews with these
informants to identify factors that influence where communities establish closures. In addition,
we also identified spatial predictors of existing closures (Table 2).
7
Table 1. Background information on key informants interviewed to assess drivers of the
presence and location of fisheries closures.
# years # LMMAs
Fijian or
Interviewee Organization working helped
Expatriate staff
with LMMAs establish
1 Wetlands International Expatriate 5‐10 >10
2 Wildlife Conservation Society Fijian 5‐10 10 10 >10
Institute of Applied Sciences ‐
6 University of South Pacific Fijian >10 >10
7 Wildlife Conservation Society Fijian >10 >10
Institute of Applied Sciences ‐
8 University of South Pacific Fijian 2‐58
in values of the six predictors within the Fijian seascape (Elith et al. 2011). A random selection
of background points across all fishing grounds would have identified fishing grounds engaged
with the Fiji LMMA network themselves as an important influence on suitability for closures.
This would have incorrectly obscured the signal from our six predictors in fishing grounds where
communities have not begun to collaborate with the Fiji LMMA network. We tested model
performance using the area under the receiver operator curve (AUC), where 1 indicates that
the model reflects the current distribution of closures perfectly and 0.5 indicates a model no
better than random at predicting the distribution of closures (Phillips et al. 2006).
Developing Opportunistic Scenarios for Expansion of FLMMA Network
To examine whether national objectives could be met by 2020 through the
opportunistic expansion of community‐based MPAs, we simulated the possible future
expansion of closures in Fiji in a way that reflected past decisions. Rules established for the
simulation were based on the approach by the FLMMA Network and on Maxent modelling of
suitability for closures. The simulation steps (detailed in Figure 4) were repeated iteratively
within each yearly time step until an average of 90 km2 were placed in closures, reflecting the
average annual area closed when the expansion of locally managed marine areas was peaking
(between 2002‐2004). This rate gave the most optimistic picture of achievement of
conservation objectives by opportunistic expansion. We ran the simulation 100 times to
produce 100 different configurations of opportunistically established closures. Each simulation
extended over 10 yearly time steps from 2011 to 2020.
In designing the simulation, we made a series of assumptions. First, we assumed that
once a qoliqoli had 30% or more of its area in fisheries closures, the FLMMA network would not
approach additional villages with resource use rights in that qoliqoli for further expansion of
closures. This was based on the FLMMA’s stated commitment to help the government achieve
its objective of 30% representation of inshore waters under protection (Jupiter et al. 2010),
while aiming to distribute costs and benefits of conservation equitably among villages. We
therefore restricted our simulation to eligible qoliqoli, defined as those with less than 30%
closed, and split these qoliqoli into two groups. The first group was Empty, meaning that there
were currently no closures within that qoliqoli. The second group was Locally Managed Marine
Area (LMMA), meaning that the qoliqoli was an existing LMMA and already contained some
closures. In our simulation, LMMA qoliqoli were only engaged once more over the 10 year
period, with closures added before they were removed from the list of eligible qoliqoli. Empty
qoliqoli followed the same engagement rule: if after their first engagement they had less than
30% closed, they were engaged at most once more in our simulation. Second, we assumed that
Empty and eligible LMMA qoliqoli would be engaged by the FLMMA network equally often.9
Table 2. Factors that influence where Fijian communities in the FLMMA network establish
fisheries closures, as determined by key informant interviews.
Factors Spatial Data Used in Rationale provided by key informants and
Model literature
Benefits of being N/A Community members are attracted to conservation
associated with an projects by direct benefits (e.g. employment
international opportunities) or indirect benefits (e.g. help with
conservation NGO leveraging funds from other organizations) (Foale 2001)
Establishment of closures Distance from nearest After a village joins the FLMMA network, local
by adjacent villages other closure within any managers present work at provincial meetings (LMMA
qoliqoli 2003), initiating interest from other villages in the same
province.
Perception of resource N/A on national scale Local managers will undertake management actions
decline when they see their natural resources as threatened or
in decline (Johannes 2002)
Need for access to Proportion of qoliqoli10
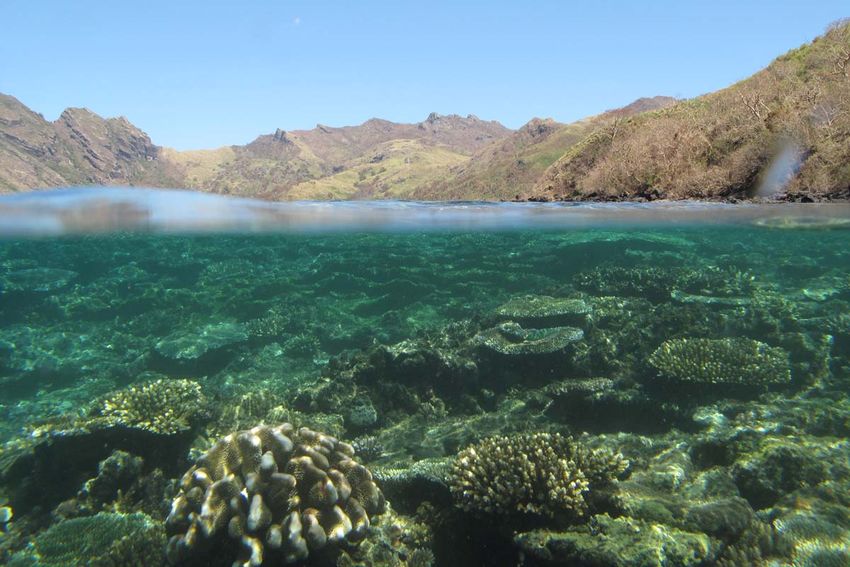
Figure 4. Flow diagram simulating the current process taken to identify sites for new LMMAs.
Yellow boxes represent steps. White boxes represent alternative routes within those steps. The
steps were applied multiple times within each year until an annual average area of 90 km2 was
placed in closures. For additional information see Mills et al. (in review).
We needed to relate the results of the Maxent models, applied at 1 ha resolution, to
planning units that were the building blocks of the simulations. We assigned each of the 0.5
km2 planning units the average suitability value of its 1 ha cells based on the Maxent model of
suitability for establishment of a new closure. At the start of the simulation, we coded planning
units as protected if they were already closures and planning units as available for
establishment of closures if they were open and at least 1 km away from other closures. During
the simulation, if a planning unit was selected by the model to be designated a closure, we
assigned it to one of the three types of closures (permanent, controlled or uncontrolled) based
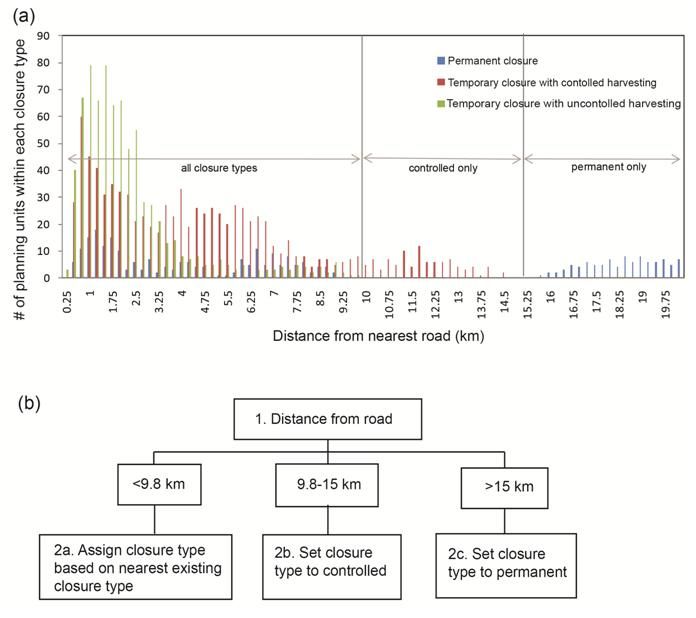
on the unit’s distance from the nearest road and type of nearest existing closure (Figure 5). We
selected distance to nearest road because it was the most important Maxent predictor of the
locations of the three types of closures within individual qoliqoli. To inform the simulation
about how much area to close within each qoliqoli and the size of each new closure, we used
data on existing closures to develop frequency distributions of percentage of qoliqoli closed
and size of closures. The size of new closures added to the network during the simulation
therefore reflected these probabilities: for example, if 50% of existing closures are smaller than
1 km2, then 50% of the time the model would select new closures of sizes below 1 km2.
Similarly, the final distribution of percentage of qoliqoli closed resulting from the simulation11
would reflect the current distribution of qoliqoli closed for all current LMMA sites. . After
closures had been allocated to qoliqoli, all other planning units within qoliqoli that had closures
were classified as “other management”, reflecting practices by the FLMMA network (Mills et al.
2011).
Figure 5. TOP: Observed distances of three closure types from the nearest road for all existing
closures in the FLMMA network. BOTTOM: Rules for assigning closure types in the opportunistic
simulation. Assignment rules proceeded in two steps: (1) assign permanent and conditional
controlled closures based on distance from nearest road and, if the distance from nearest road
is less than 9.8 km, then (2) assign the closure to the type of the nearest existing closure.
Developing Systematic Scenarios for Expansion of FLMMA Network
We used the decision support software Marxan with Zones (Watts et al. 2009) to
systematically identify closure configurations that achieved national biodiversity objectives,
which were set to 30% objectives for all habitats because the 10% objective has already been
achieved for other benthic areas under the existing FLMMA network. Marxan with Zones12
allocates planning units to different forms of management (in this case, permanent no‐take or
controlled harvest areas) to optimize the amount of habitat area protected to achieve
conservation objectives with the least amount of cost. In this instance, the measure of cost was
the planning unit suitability calculated by Maxent. Each “run” of the software produces a single
zoning plan that achieved our objective. Given that this objective could be achieved with many
different designs, we ran Marxan 100 times to generate different solutions.
We began the selection process with existing closures locked into their current
configuration. Planning units outside existing closures could be assigned to one of three zones:
permanent, controlled or no management. Uncontrolled closures were not considered because
accrued benefits can be rapidly reversed during intensive harvests (Foale and Manele 2004).
We made objectives proportional across qoliqoli so, for example, 30% of the mangroves within
each qoliqoli selected as an LMMA had to be represented. We adjusted the weightings of the
costs of the forms of management so that selected permanent and controlled closures were in
the same ratio (1:4) as existing ones. We ran the analyses to maximize achievement of national
objectives, within the constraint of adding an average of 90 km2 of closures per year, the same
as in the opportunistic scenario. Selected closures were attributed to individual years between
2011 and 2020, assuming that closures with highest suitability would be added first. As with the
opportunistic scenario, after closures had been allocated to qoliqoli, all other planning units
within qoliqoli that had closures were classified as “other management”.
Comparing the Opportunistic and Systematic Scenarios
To calculate the achievement of future conservation efforts against the national
objectives, we used these effectiveness weightings in both the opportunistic and systematic
scenarios. For each action, we chose the most common minimum effectiveness to focal species
groups across habitats as the most conservative measure of the effectiveness of the overall
system. After the different forms of management were allocated to qoliqoli in the opportunistic
and systematic scenarios, we averaged the percentage achievement of each habitat’s objective
across the 100 simulations (opportunistic) or 100 repeat runs (systematic) for each annual time
step over the 10 years. We also averaged yearly achievement of objectives across the 100
replicates and across all ecosystems to give a single parameter for comparing opportunistic and
systematic scenarios over time.
Results
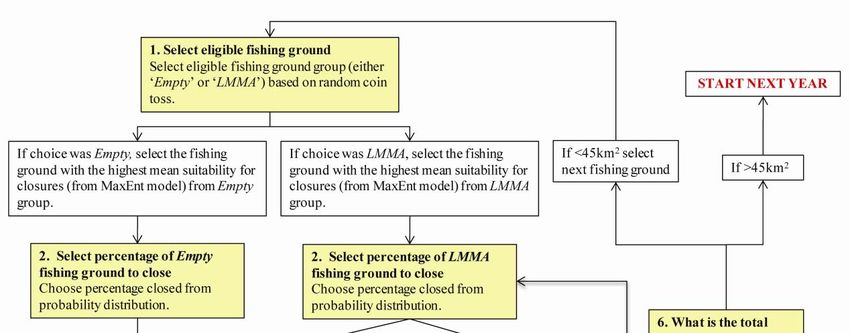
The simulations showed that neither the opportunistic nor systematic scenario achieved
all national conservation objectives by 2020, although the systematic approach came closer to
achieving this objective (Figure 6). In the opportunistic scenario, fringing and non‐fringing reefs,
mangroves and intertidal ecosystems missed their objective of 30% effective protection by at
least 12‐17%, while the 10% effective protection objectives for habitats of other benthic
substrata were exceeded (Figure 6a,c). In the systematic scenario, non‐fringing reefs and
mangroves missed their objectives by 2‐5%, but all other objectives were met (Figure 6b,d). The
overall achievement of objectives by the opportunistic and systematic scenarios, averaged13 across 100 selection processes and across all ecosystems, was similar for the first four years (Figure 6e). After 2013, achievement of objectives by the systematic scenario rose much more quickly. Figure 6. Achievement of national 2020 objectives by the opportunistic and systematic scenarios. (a) Percent representation of each habitat by 2020 in the simulated FLMMA network under the opportunistic scenario. Horizontal lines indicate national objectives. (b) Percent representation of each habitat by 2020 of all MPAs in the modeled systematic scenario. Horizontal lines indicate national objectives. (c) For the opportunistic scenario, the per‐year increase in representation of each habitat over the ten years to 2020, averaged across 100 simulations. (d) For the systematic scenario, the per‐year increase in representation of each habitat over the ten years to 2020, averaged across 100 runs. (e) Achievement of national overall objective over the ten years to 2020 in the opportunistic and systematic scenarios, averaged across 100 selection processes and across all habitats.
14

Discussion and Management Implications

         Given limited government resources in Fiji for coastal management (Lane 2008), much
of the planning for inshore marine management is undertaken by partners of the FLMMA
network. There are thus both high hopes and high stakes for the community‐based
management measures established under FLMMA to serve the dual purposed of achieving local
and national objectives. The main outcome of this work was that under our opportunistic
scenario, where conditions were designed to reflect an optimistic continuation of the business
as usual conditions by which new sites are added to the FLMMA network, the network will
achieve a good portion of the national objectives, but will fall considerably short of the 2020
objectives. Furthermore, given the current weak status of the global economy, it may not be
realistic to assume that donor investment to the FLMMA network and FLMMA partners will be
at the same level when expansion peaked in 2002‐2004. Therefore, these simulations may
under‐represent what can actually be achieved should funding be reduced over the next 10
years.

        Although a systematic approach came closer to achieving the national 2020 objectives,
we do not recommend abandoning the FLMMA approach in favour of systematic conservation
planning. However, systematic assessments can be useful in Fiji to help scale up where FLMMA
partners and government could additionally allocate resources to fill important gaps to achieve
national objectives. This is already being done in several parts of Fiji such as Kubulau and
Kadavu. As an example, a community may want to establish a small, periodically harvested
marine closure with the local aim of increasing fisheries resources so that they are available for
an annual feast. Systematic assessments may help identify mangrove and mudflat areas that
will help achieve local fisheries objectives and that are of high importance for meeting national
representation objectives for mangrove and mudflat protection. With the guidance of
systematic assessments, FLMMA partners and other government organizations may be able to
provide incentives to the community to expand the boundaries of its tabu so that it will
contribute to both local and national objectives. Such incentives could include both financial
and/or non‐monetary benefits (e.g. payment of school fees, national public recognition), which
may be a necessary step as we recognize that local communities are unlikely to be willing to
take on the cost burden of contributing to national objectives for free.

        While our models offer important lessons in terms of additional benefits that can be
gained from coordinating local management, we recognize that there are many limitations to
this study. For example, the likelihood of implementing management rests on additional factors
not considered here. Policies, markets, characteristics and spatial distribution of resource users,
cultural values, and governance will additionally influence where management regulations can
be applied and whether individuals and communities will support those regulations (Aswani
2005; Berkes 2007; Govan et al. 2009). Furthermore, we recognize that this study did not
consider contributions to national objectives from marine protected areas managed by the
private sector, which include MPAs established by hotels and owners of private islands, as we
15
did not have spatial data on their distribution. Therefore, a revised gap analysis with this data
could show that Fiji is further towards meeting national objectives than previously anticipated.
Acknowledgements
The authors gratefully acknowledge the Fiji Locally Managed Marine Area network and
the national Protected Area Committee for releasing data on marine protected area boundaries
and habitat distributions in order to carry out this work. We additionally thank all of the
volunteers who participated in the key informant interviews for providing critical information
into the development of the suitability layer. We thank A. Reside, S. Januchowki‐Hartley and J.
VanDerWal for their assistance with the Maxent model. We thank Preetika Singh for
undertaking some of the interviews. MM, RLP and NCB (DP1096453) acknowledge support from
the Australian Research Council. SDJ acknowledges, on behalf of WCS, support from the John D.
and Catherine T. MacArthur Foundation (10‐94985‐000‐GSS).
References
Abernathy KE, Allison EH, Molloy PP, Cote IM (2007) Why do fishers fish where they fish? Using
the ideal free distribution to understand the behaviour of artisanal reef fishers.
Canadian Journal of Fisheries and Aquatic Sciences 64:1595‐1604
Adams VM, Mills M, Jupiter SD, Pressey RL (2011) Improving social acceptability of marine
protected area networks: a method for estimating opportunity costs to multiple gear
types in both fished and currently unfished areas. Biological Conservation 144:350‐361
Aswani S (2005) Customary sea tenure in Oceania as a case of rights‐based fishery
management: Does it work? Reviews in Fish Biology and Fisheries 15:285‐307
Aswani S, Hamilton R (2004) The value of many small vs. few large marine protected areas in
the Western Solomon Islands. SPC Traditional Marine Resource Management and
Knowledge Information Bulletin 16:3‐14
Berkes F (2007) Community‐based conservation in a globalized world. Proceedings of the
National Academy of Sciences 104:15188‐15193
Bernard H (1994) Research methods in anthropology: Qualitative and quantitative approaches
AltaMira Press, Walnut Creek, CA, USA
Clarke P, Jupiter SD (2010) Principles and practice of ecosystem based management: A guide for
conservation practitioners in the tropical Western Pacific. Wildlife Conservation Society,
Bronx, USA 80 pp
Elith J, Phillips SJ, Hastie T, Dudik M, Chee YE, Yates CJ (2011). A statistical explanation of
Maxent for ecologists. Divers. Distrib. 17:43‐57.
FLMMA (2010) 2010 Annual Report. Fiji Locally Managed Marine Area Network, Suva, Fiji.
Foale S (2001) Where's our development. The Asia Pacific Journal of Anthropology 2:44‐67
Foale S, Manele B (2004) Social and political barriers to the use of Marine Protected Areas for
conservation and fishery management in Melanesia. Asia Pacific Viewpoint 45:373‐386
Govan H, Tawake A, Tabunakawai K, Jenkins A, Lasgorceix A, Schwarz A‐M, Aalbersberg B,
Manele B, Vieux C, Notere D, Afzal D, Techera E, Rasalato ET, Sykes H, Walton H, Tafea
H, Korovulavula I, Comley J, Kinch J, Feehely J, Petit J, Heaps L, Anderson P, Cohen P,16
Ifopo P, Vave R, Hills R, Tawakelevu S, Alefaio S, Meo S, Troniak S, Malimali S, Kukuian S,
George S, Tauaefa T, Obed T (2009) Status and potential of locally‐managed marine
areas in the South Pacific: meeting nature conservation and sustainable livelihood
targets through wide‐spread implementation of LMMAs. SPREP/WWF/WorldFish‐
Reefbase/CRISP, Suva, Fiji 95 pp + 95 pp annexes
Johannes RE (2002) The renaissance of community‐based marine resource management in
Oceania. Annual Review of Ecology and Systematics 33:317‐340
Jupiter S, Mills M, Comley J, Batibasaga A, Jenkins A (2010) Fiji marine ecological gap
assessment: interim progress report. Wildlife Conservation Society, Suva, Fiji 26 pp
Lane MB (2008) Strategic coastal governance issues in Fiji: The challenges of integration.
Marine Policy 32:856‐866
LMMA (2003) Learning framework for the Locally Managed Marine Area Network. LMMA
Network, Suva, Fiji http://www.reefbase.org/pacific/pub_A0000003395.aspx
Margules CR, Pressey RL (2000) Systematic conservation planning. Nature 405:243‐253
Mills M, Jupiter SD, Pressey RL, Ban NC, Comley J (2011) Incorporating effectiveness of
community‐based management strategies in a national marine gap analysis for Fiji.
Conservation Biology
Mills M, Adams VM, Pressey RL, Ban NC, Jupiter SD (in review) Where do national and local
conservation actions meet? Simulating the expansion of opportunistic and systematic
approaches to conservation into the future. Conservation Letters
Phillips S, Anderson R, Schapire R (2006) Maximum entropy modeling of species geographic
distributions. Ecological Modelling 190:231‐259
Pressey RL, Tully SL (1994) The cost of ad hoc reservation: a case study in western New South
Wales Australian Journal of Ecology 19:375‐384
Tawake A (2007) Scaling‐up networks of Locally Managed Marine Areas (LMMAs) to island wide
ecosystem management while decentralizing the effort of Fiji LMMA network and its
implementation from national to provincial levels. University of the South Pacific, Suva,
Fiji
Watts ME, Ball IR, Stewart RS, Klein CJ, Wilson K, Steinback C, Lourival R, Kircher L, Possingham
HP (2009) Marxan with Zones: Software for optimal conservation based land‐ and sea‐
use zoning. Environmental Modelling and Software 24:1513‐1521You can also read