CANCER MEDICINES: VALUE IN CONTEXT - MAY 2019 - PHRMA
←
→
Page content transcription
If your browser does not render page correctly, please read the page content below

Cancer Medicines:
Value in Context
May 2019
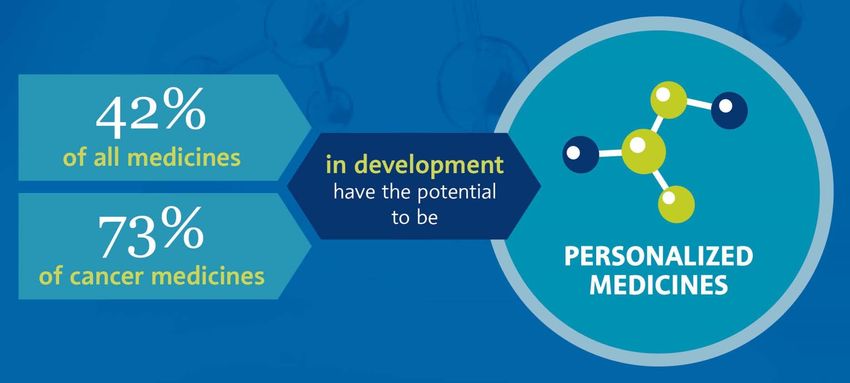
Table of Contents
Key Takeaways                                             3

Chapter 1: Advances in Cancer Treatment                   4

Chapter 2: Innovation in the Cancer Medicine Pipeline     15

Chapter 3: Cancer Patient Spending and Financial Burden   23

Chapter 4: Cancer Costs in Context                        29

Chapter 5: Evolving Cancer Market Dynamics                38

Chapter 6: US System in Context                           49

Chapter 7: Solutions For Advancing Value in Cancer Care   55
                                                               2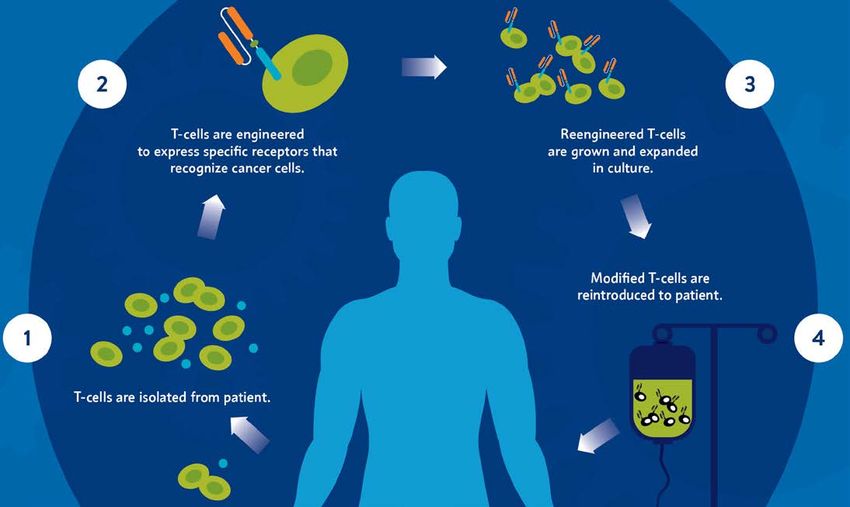
Key Takeaways
• We have made remarkable progress in the fight against the more than 200
  diseases we call cancer and current research holds enormous promise to
  address the great unmet need.

• Too many cancer patients face financial burdens, and these come from a variety
  of sources including treatment costs, non-medical costs, and insurance benefit
  design.

• The cost of cancer treatment comes from a range of sources including
  medicines, hospital and ED visits, diagnostics, and physician services.

• The oncology market is working to control spending on cancer medicines and
  overall treatment costs.

• Reforms are needed to accelerate the development path for cancer medicines
  and promote a delivery system that is increasingly patient-centered and value-
  based.
                                                                                   3
1. Advances in Cancer Treatment

                                  4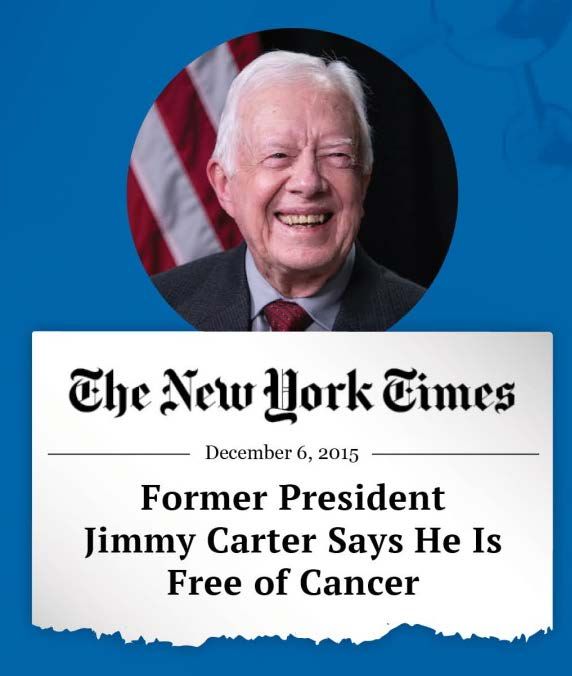
Since Peaking in the Early 1990s,
                        Cancer Death Rates Have Declined 27%
    Increases in cancer survival are estimated to translate to the avoidance of nearly
    2.6 million cancer deaths.

                                            U.S. Death Rates from Cancer Decline Over Time
      Cancer Death Rate (Number of Deaths

                                                                                           -27%
          Due to Cancer per 100,000)

                                                   215
                                                                                                                                        156

                                                   1991                                                                                 2016
                                                                                                                                                                                   5
Source: American Cancer Society, “Cancer Facts & Figures 2019,” https://www.cancer.org/research/cancer-facts-statistics/all-cancer-facts-figures/cancer-facts-figures-2019.html.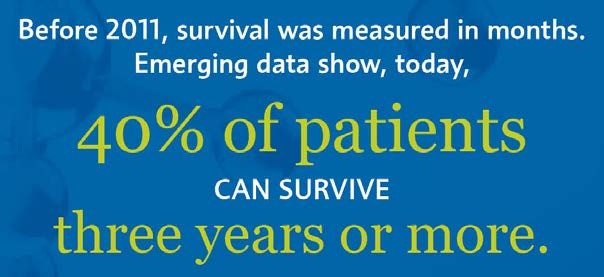
Five-Year Survival is Increasing for Many
                       Types of Cancer
      Since 1975, the chances that a cancer patient will live 5 years or more have
      increased by 41% across cancers.1

                   5-Year Survival Rates Among the Most Common
                                Cancers, 1975-20141
      100%
                                                                                                          1975
                                                                                                                                             73% of recent
        80%                                                                                                                                  survival gains in
                                                                                                          2014
        60%
                                                                                                                                             cancer are attributable
                                                                                                                                             to treatment advances
        40%                                                                                                                                  including new
                                                                                                                                             medicines.2
        20%

          0%
                    Breast Cancer           Prostate Cancer             Colon/Rectum             Lung/Bronchus

Sources: 1) American Cancer Society, “Cancer Facts & Figures 2019,” https://www.cancer.org/content/dam/cancer-org/research/cancer-facts-and-statistics/annual-cancer-facts-and-       6
figures/2019/cancer-facts-and-figures-2019.pdf. 2) S. Seabury, “Quantifying Gains in the War on Cancer Due to Improved Treatment and Earlier Detection,” Forum for Health Economics
and Policy 2016; 19(1): 141–156.
The Number of Cancer Survivors is
Steadily Rising
The continued increase in survival rates is in large part attributable to earlier
detection and better treatments.1
U.S Cancer Survivors Over Time (millions)1,2,3
26.1
21.7
16.9
9.8
3
1971 2001 2019 2029 (Projected) 2040 (Projected)
Sources: 1) American Cancer Society, “Cancer Treatment and Survivorship Facts & Figures, 2016-2017,”
http://www.cancer.org/acs/groups/content/@research/documents/document/acspc-048074.pdf. 2) Centers for Disease Control and Prevention, “Cancer Survivors-United States, 2007,” 7
10 March 2011, http://www.cdc.gov/cancer/survivorship/what_cdc_is_doing/research/survivors_article.htm. 3) National Institutes of Health, National Cancer Institute, Office of Cancer
Survivorship Statistics, https://cancercontrol.cancer.gov/ocs/statistics/statistics.html#ref1 (accessed May 2019).CAR-T Therapy Driving Breakthroughs
for Cancer Patients
Engineered immune T-cells can recognize, zero in on and kill cancer cells.
8Immunotherapy is Revolutionizing the Treatment of
Many Advanced Cancers: Metastatic Melanoma
Note: Data from KEYNOTE-001 pembrolizumab clinical study
“No recent cancer advance has been more
transformative than immunotherapy.”
- Dr. Julie M. Vose, former President of the American Society
of Clinical Oncology3
Sources: 1) ASCO, “PD-1 Inhibitor Pembrolizumab Provides Long-Term Survival Benefit for Patients With Advanced Melanoma,” May 18, 2016, https://www.asco.org/about-asco/press-
center/news-releases/pd-1-inhibitor-pembrolizumab-provides-long-term-survival; 2) The ASCO Post. “ASCO Names Advance of the Year, Highlights Major Top Research Trends.” 9
February 10 2016. http://www.ascopost.com/issues/february-10-2016/asco-names-advance-of-the-year-highlights-major-top-research-trends/; 3)Southall, A. “Former President Jimmy
Carter Says He is Free of Cancer.” http://www.nytimes.com/2015/12/07/us/jimmy-carter-cancer.html. Dec. 6, 2015.Cervical Cancer: Reduced Incidence of
Cancer-Causing HPV Infections
Among teenage girls, widespread use of the quadrivalent human papilloma virus
(HPV) vaccine has driven down infection rates by nearly two-thirds.
10
Source: Markowitz, L, et al. “Prevalence of HPV After Introduction of the Vaccination Program in the United States.” Pediatrics. March 2016.
http://pediatrics.aappublications.org/content/early/2016/02/19/peds.2015-1968.Transformation in Cancer Diagnosis Has Led
to More Precise Treatment
A greater understanding of the molecular basis of disease has transformed what
was once known collectively as “disease of the blood,” into multiple subtypes of
leukemias and lymphomas, opening up new treatment approaches.
60 YEARS AGO 50 YEARS AGO 40 YEARS AGO TODAY
Chronic
Leukemia
~ 40 Unique 5 year survival
Leukemia Acute rates have
Leukemia grown to
Leukemia
types 70%
identified
“Disease of Pre-
the Blood” leukemia There are nearly
~ 50 Unique 340
Indolent Lymphoma medicines
Lymphoma types in development
Lymphoma for blood
identified cancers
Aggressive
Lymphoma
Source: M Aspinal, former President Genzyme Genetics (http://www.comtecmed.com/biomarker/2014/Uploads/Editor/PDF/ppt/Edward%20Abrahams_Key%20Note%20Lecture.pdf)l; 11
National Cancer Institute,; SEER Cancer Statistics Review, 1975-2011, http://seer.cancer.gov/csr/1975_2011 /, based on November 2013 SEER data submission, posted to the SEER
web site, April 2014; PhRMA, Medicines in Development for Cancer, May 2018.Targeted Therapies Drive Survival Gains
in Chronic Leukemias
Since the approval of the first tyrosine kinase inhibitor (TKI) for chronic myeloid
leukemia (CML), survival rates have improved dramatically and patients are living
close to normal life spans.1
• Imatinib—the first TKI—was approved in 2001
5-Year Survival Rates for CML Patients
to treat CML. The transformative impact of
Nearly Triple After Introduction of Imatinib2
this class of medicines had not been
completely realized.
• After initial approval, continued research
89%
revealed that imatinib had a greater impact
when initiated earlier in the progression of the
disease.
• Further research also revealed that imatinib
was effective in combating other types of
cancer.
31%
• Additional TKIs have since been approved for
CML and offer alternatives to imatinib.
Prior to Introduction of Imatinib After Introduction of Imatinib
12
Sources: 1) PhRMA, “A Decade of Innovation in Cancer: 2006‐2016,” http://phrma-docs.phrma.org/sites/default/files/pdf/decade-of-innovation-cancer.pdf, 2016; 2) BJ Druker, et al.,
“Five‐year follow‐up of patients receiving imatinib for chronic myeloid leukemia,” N Engl J Med. 2006; 355(23):2408‐17.The Role of Personalized Medicines
Is Rapidly Growing
Personalized medicines provide effective and efficient care by targeting the right
medicine to the right patient.
Oncology Treatment Modalities in Top Pharmaceutical Markets,
Share of Sales, 2003-2013
2003 2013
11%
24%
46%
Targeted
48% 26% Therapies
10%
15% 20%
Targeted Cytotoxics Supportive Care Hormonals
(Chemo)
13
Source: IMS Institute for Healthcare Informatics, “Innovation in Cancer Care and Implications for Health Systems: Global Oncology Trend Report,” May 2014.Cancer Treatment Advances Result in
Substantial Gains to Society
Between 1988 and 2000:
23 million $1.9 trillion
years of life saved due to value of improved cancer
cancer treatment advances treatment to society based on
improved productivity, extended
life and other factors
14
Source: DN Lakdawala , et al., “An economic evaluation of the war on cancer,” Journal of Health Economics. May 2010. 29(3):333-346.2. Innovation in the Cancer
Medicine Pipeline
15Promise in the Pipeline: More than 1,100 Medicines
in Development for Various Cancers
Medicines and Vaccines in Development for Cancer by
Tissue of Origin (Selected) – May 2018
Bladder “These are exciting times…
Brain the pace of discovery and
Breast application of new knowledge
Colorectal
to patient care is rapidly
Gastric
Head and Neck
accelerating.”
Hematologic Malignancies
Kidney — Dr. Jose Baselga,
Leukemia Physician-in-Chief,
Liver Memorial Sloan Kettering Cancer
Lung Center
Lymphoma
Multiple Myeloma
Ovarian Phase I
Pancreatic Phase II
Prostate
Phase III
Sarcoma
Application Submitted
Skin
*Some medicines may be in more than one therapeutic category.
16
Sources: PhRMA, Medicines in Development for Cancer, May 2018; American Association for Cancer Research. “Jose Baselga, MD, PhD”
http://cancerprogressreport.org/2015/Pages/baselga.aspx .Promise in the Pipeline: More than 200
Immuno-oncology Medicines in Development
Number of Medicines in Development in the United
States, May 2017, Selected Classes of Immunotherapy
“In the past 5 years,
Adoptive Cell Therapies 40
immunotherapy has emerged
as one of the most exciting
Bispecific Antibodies 30 new approaches to cancer
treatment that has ever
entered the clinic.”
Checkpoint Modulators 45
- American Association for
Cancer Research
Cytokines 23 Phase I
Phase II
Phase III
Oncolytic Cell Therapies 14
Application Submitted
Vaccines 96
17
Sources: PhRMA, “Medicines in Development for Immuno-oncology,” June 2017, https://www.phrma.org/medicines-in-development-immuno-oncology; American Association for Cancer
Research. “Jose Baselga, MD, PhD” http://cancerprogressreport.org/2015/Pages/baselga.aspx .New Approaches to Treating Cancers Represent the
Majority of Medicines in the Oncology Pipeline
Researchers are using novel approaches to attack cancer at the molecular level.
An average of 85% of drugs in the oncology pipeline, including 79% in the clinical
research phase, have the potential to be first-in-class medicines.
Percentage of Projects in Development that are Potentially Novel
Approaches in Selected Cancer Areas, 2016
Cancer, general 85%
Bladder cancer 71%
Blood cancers 83%
Breast cancer 80%
Colorectal cancer 78%
Lung cancer 88%
Melanoma 92%
Prostate cancer 84%
0% 10% 20% 30% 40% 50% 60% 70% 80% 90% 100%
18
Source: Long, G. “The Biopharmaceutical Pipeline: Innovative Therapies in Clinical Development” Analysis Group. June 2017.Biopharmaceutical Companies are
Researching New Targeted Cancer Therapies
19
Sources: Tufts Center for the Study of Drug Development (CSDD). Personalized medicine gains traction but still faces multiple challenges. Tufts CSDD Impact Rep. 2015.Major Scientific Advances in Cancer
Treatment Pipeline Give Patients Hope
The cancer pipeline is ripe with innovative therapeutic options. Emerging
combinations of medicines hold particular promise for controlling and killing
cancer cells.
Oncolytic viral therapies PARP inhibitors interrupt “We are in the midst of a sea
zero in on cancer cells, cancer’s hyperactive DNA change in how we are treating
replicate, and cause them repair systems, thus cancer. We’re really seeing the
to rupture. allowing tumors to be fruits of many years of research
crippled and die. into what drives cancer and how
it interacts with the immune
system to defeat it and survive.”
CRISPR/Cas9 gene Immunotherapies help
editing allows target and kill cancer - Dr. Louis Weiner, director of the
researchers to manipulate cells by unleashing the Georgetown Lombardi Comprehensive
Cancer Center
cancer cell function. immune system. (e.g.
CAR-T)
Sources: World Medical Innovation Forum: Cancer. “Disruptive Dozen 2016.” http://worldmedicalinnovation.org/wp-content/uploads/2016/04/Partners-FORUM-2016-BROCHURE-D12-
Cancer-160422_0942-FREV1-WEB-X3-SM-SPREADS.pdf; McGinley, L. “The list of cancers that can be treated by immunotherapy keeps growing.” The Washington Post. 20
https://www.washingtonpost.com/news/to-your-health/wp/2016/04/19/breakthrough-cancer-therapy-shows-growing-promise/; M. Eisenstein, “Top 40 Drugs in the Pipeline – 2016,”
C&EN Supplement, September 2016, http://cen.acs.org/content/dam/cen/supplements/09435-cens-web.pdf (Accessed 14 March 2017).Cancer Researchers Build on Knowledge Gained
from Setbacks to Inform Advances
Developing a new cancer medicine is a complex process, fraught with setbacks,
but these so called “failures” are not wasted efforts. Researchers learn from
them to inform future study.
MELANOMA BRAIN CANCER LUNG CANCER
• 96 unsuccessful • 75 unsuccessful • 167 unsuccessful
attempts attempts attempts
• 7 new medicines • 3 new medicines • 10 new medicines
*Setbacks and advances from 1998 to 2014
21
Source: PhRMA, “Researching Cancer Medicines: Setbacks and Stepping Stones,” http://www.phrma.org/sites/default/files/pdf/2014-cancer-setbacks-report.pdf, 2014.Lung-MAP: Innovative Clinical Trial Takes New
Approach to Cancer Drug Development
Lung-MAP (Lung Cancer Master Protocol) matches patients to specific
investigational medicines based on genomic screening. Shared infrastructure
accelerates drug development and increases efficiency.
HOW IT WORKS:
Patients undergo genomic profiling THE PARTNERS:
to identify mutations that may cause
non-small cell lung cancer Lung-MAP is a unique public-private
partnership between:
Patients are directed to a treatment • Patient and disease advocacy
arm based on their genomic profile groups
• Biopharmaceutical companies
• National Cancer Institute
• Foundation for the National
Institutes of Health
Patients receive highly targeted
therapies and researchers collect data to
advance the study of new medicines
22
Source: Lung Cancer Master Protocol, http://www.lung-map.org/ (accessed May 2019).3. Cancer Patient Spending
and Financial Burden
23Multiple Factors Contribute to the Financial
Burden Faced by Cancer Patients
Top Patient Financial Concerns
Non-Medical Medical
Gasoline Diagnostic Tests or Scans
49% 53%
Food (Groceries or Dining Out) Prescription Medicines
48% 43%
Over-the-Counter Medicines Physician Office Visits
42% 39%
Outpatient Treatments
Special Clothing and/or Wigs (Incl. Radiation)
38% 37%
Car Repairs Surgery
23% 36%
24
Source: Financial Hardship Associated with Cancer. CancerCare, 2017.A Cancer Diagnosis Impacts Productivity and
Employment for Patients and Caregivers
Patients Caregivers
More than
67%
of patients who were employed
25%
of caregivers made
full-time when diagnosed either extended employment
stopped working or reduced changes
their work hours
Sources: Financial Hardship Associated with Cancer. CancerCare, 2017.; Yabroff et al. Financial Hardship Associated with Cancer in the United States: Findings from a Population-
Based Sample of Adult Cancer Survivors (2016), deMoor et al. 2016. Employment implications of informal cancer caregiving; Yabroff & Kim. 2009. Time costs associated with 25
informal caregiving for cancer survivors.Out-of-Pocket Costs Are Not Driven by Cancer
Medicines
At 6 months post-diagnosis, 60-70% of out-of-pocket costs are driven by physician and
facility care for commercially insured patients with breast, lung and colorectal cancer on
average.
Breast Cancer Patient Out-of-pocket Costs Cancer
Related Radiation
At 6 Months Following Diagnosis Drugs Therapy
41% 21%
22%
Professional Non-Cancer 8% 5% 4%
Facility Services
Services Drugs
Hospital
Inpatient
26
Source: G. Dieguez, et al, Milliman Research Report: “A Multi-Year Look at the Cost Burden of Cancer Care,” 11 April 2017Benefit Design Hinders Access to Cancer
Medicines in Some New Classes
Some plans place treatments for certain high-cost conditions on the highest drug
formulary cost sharing tier.
Percentage of Silver Plans Placing All Drugs per Class on
Specialty Tier, 2016
Molecular Target Inhibitors* 23%
Antiangiogenics* 50%
*There are no generic drugs available in this class. All products are single-source.
27
Source: Avalere Health PlanScape ®, a proprietary analysis of exchange plan features, April 2016. This analysis is based on data collected by Managed Markets Insight &
Technology, LLC.High Cost Sharing Leads to Abandonment
or Delays in Cancer Treatment
Patients with highest co-pay were 5 times more likely to abandon treatment than
the lowest co-pay group
Oral Oncolytic Abandonment Rate by Patient
Out-of-Pocket Amount
49%
41%
32%
14%
10% 11%
$2000
28
Source: Doshi JA, Li P, Huo H, Pettit AR, Armstrong KA. Association of Patient Out-of-Pocket Costs With Prescription Abandonment and Delay in Fills of Novel Oral Anticancer
Agents. Journal of Clinical Oncology. 2017 Dec 20:JCO-2017. Available online at: http://ascopubs.org/doi/pdf/10.1200/JCO.2017.74.50914. Cancer Costs in Context
29Spending on Cancer Medicines Represents Less
than 2% of Overall Health Care Spending
Cancer Medicines as a Portion of
Total U.S. Health Care Spending, 2018*
Cancer Medicines
$58.4 Billion1**
$3.65 Trillion2*
Remaining Health Care
Spending
* 2018 CMS total National Health Expenditures is a projection
** Cancer drug invoice spending and does not include discounts
Sources: 1) IQVIA Institute. Medicine Use and Spending in the U.S. A Review of 2018 and Outlook to 2023. https://www.iqvia.com/institute/reports/medicine-use-and-spending-in-the -us-a-review-
of-2018-and-outlook-to-2023. Published May 2019. 2) Centers for Medicare & Medicaid Services (CMS) data. National health expenditures (NHE) table 2 Amounts and Annual Percent Change30
by Type of Expenditure. https://www.cms.gov/Research-Statistics-Data-and-Systems/Statistics-Trends-and-Reports/NationalHealthExpendData/NationalHealthAccountsProjected.html.
Accessed April 2019.Cancer Medicines Represent About 20% of
Cancer Spending
Medicare, Actively Treated Commercially Insured, Actively
Cancer Population, 2014 Treated Cancer Population, 2014
18% 20%
Cancer Drugs 20%
Cancer Drugs
34%
5%
4%
13%
21%
11% 28% 10%
3% 8% 4%
Hospital Inpatient Cancer Surgeries Radiology Radiation Oncology
Other Out Pt Services Professional Services Cancer Drugs
31
Source: K. Fitch, et al. Milliman, “Cost Drivers of Cancer Care: A Retrospective Analysis of Medicare and Commercially Insured Population Claim Data 2004-2014,” April 2016,
http://www.milliman.com/uploadedFiles/insight/2016/trends-in-cancer-care.pdf.Overall Drug Spending Growth Expected to
be Moderate as Cancer Progress Continues
500 Projected Cancer Drug Spending as a
Portion of Total Drug Spending, US$ Billions
400
300
$344 Billion
Projected Net Total Drug Spending Growth = 3-6% per year
200
100
$56.7 Billion
0
2018 2019 2020 2021 2022 2023
Cancer Drugs All Drugs
32
Sources: IQVIA Institute. Global Oncology Trends 2019: Therapeutics, Clinical Development and Health System Implications. Published May 2019 and IQVIA Institute. “Medicine
Use and Spending in the U.S.: A Review of 2018 and Outlook to 2023” Published May 2019.Prices of Cancer Medicines in Medicare
Part B Growing Slowly
The volume-weighted Average Sales Price (ASP) for cancer drugs administered
through Medicare Part B has been growing in line with medical inflation.
Weighted ASP (Oncology Drugs vs. All Other Drugs) vs
Consumer Price Index – Medical (CPI-M)
33
Source: The Moran Company. Trends in Weighted Average Sales Prices for Prescription Drugs in Medicare Part B, 2006-2017. December 2017.Cancer Treatments Face Growing
Competition from Generics and Biosimilars
Global Oncology Sales at Risk of Reduction Due to Estimated Loss of
Exclusivity
(Billions of US Dollars)*
11.3
4.4 4.2
2.1 2.2
2019 2020 2021 2022 2023
$25.5 Billion
*Pre-Expiry spending is the actual and estimated spending in the 12 months prior to loss of exclusivity (LOE) and is shown for developed markets only. Estimates are based on patent
expiry dates or expected generic/biosimilar availability, and historic analogues where available. Biologics and small molecules are modeled separately. Biologic brand sales at risk are
based on any non-original biologic competitor, regardless of approval type.
34
Sources: IQVIA Market Prognosis, National Sales Perspectives, QuintilesIMS Institute, May 2019. Includes small and large molecules.Market Drives Rapid Switch to Generic Medicines:
Example - Injectable Cancer Medicine Docetaxel
LOSS OF EXCLUSIVITY
35
Sources: Bates White Economic Consulting, “Oncology Product Sales and Patent Expiration: A Policy Brief,” May 2017.Market Drives Rapid Switch to Generic Medicines:
Example - Injectable Cancer Medicine Gemcitabine
LOSS OF EXCLUSIVITY
36
Sources: Bates White Economic Consulting, “Oncology Product Sales and Patent Expiration: A Policy Brief,” May 2017.Better Use of Cancer Medicines Can
Reduce Health Care Costs
Advanced melanoma patients who were adherent to immunotherapy experienced
10% lower health care costs.
Difference in total healthcare costs by adherence status for
advanced melanoma patients
$51,991
$48,263
$41,830
$37,549
Low Adherence
High Adherence
All-Cause Costs Melanoma-Related Costs
Source: Gupte-Singh K, Lin J, Lingohr-Smith M, Menges BL, Rao S. Adherence to cancer therapies and the impact on healthcare costs among patients with advanced melanoma in
the USA. Proceedings of the 22nd Annual International Meeting International Society of Pharmacoeconomics and Outcomes Research; 2017 May; Boston, MA. Abstract available 37
at: https://www.ispor.org/ScientificPresentationsDatabase/Presentation/70971?pdfid=49558.5. Evolving Cancer
Market Dynamics
38Health Plans Make Extensive Use of Prior
Authorization in Oncology
Health Plans’ Use of Prior Authorization in Oncology
Oral 76%
Office Administered 82%
39
Source: Health Strategies Group. Cost Containment in the Market for Branded Pharmaceuticals. August 2018. https://www.healthstrategies.com/executive-briefs.Health Plans Deploy a Range of Tools to
Manage Cancer Drug Spending
Current and Anticipated Payer Measures
to Manage Oncology Costs (Q1 2017)
Utilizing one or more value frameworks* in
determining reimbursement 31%
Using clinical pathways to determine treatment
regimens 35%
Contracting for preferred first-line therapies 59%
*Value Frameworks: NCCN Evidence Blocks, ASCO Value Framework, etc.
40
Source: Zitter Health Insights , Managed Care Oncology Index, 2016.Plans and Providers Rapidly Adopting
Clinical Pathways
Non-small cell lung cancer patients treated according to a clinical pathway
incurred lower drug and total costs.
12-Month Savings with Lung Cancer Clinical
Pathway*
5%
-18%
-22% -23%
-28% -28%
OVERALL Chemotherapy, Radiology Radiation Non-chemo Diagnostics
biologics Therapy infusions,
transfusions
*Clinical pathways are care plans that provide specific guidance on the sequencing of care steps and the timeline of interventions. They often consider evidence on the benefits and harms of alternativ
care options and take the cost therapy into account.
41
Source: DM Jackman et al “Cost and Survival Analysis Before and After Implementation of Dana-Farber Clinical Pathways for Patients with Stage IV Non-Small Cell Lung Cancer, “
Journal of Oncology Practice, April 2017, http://ascopubs.org/doi/abs/10.1200/JOP.2017.021741Plans Realize Savings via New Payment
Models
Early results from oncology medical homes, bundled payment and specialty
Accountable Care Organizations (ACOs) show potential for reducing total cancer
costs.
Patient-centered medical homes Pilot reduced total costs 35% annually
Episode- or bundled payment Pilot reduced total costs of care 34%
Specialty ACOs Reduce drug spending 5%, total
spending 2% +
"Notably, all those interviewed suggested that the use of clinical pathways was a driver
of financial savings, either through reduced drug spending or indirectly through more
appropriate patient treatment.”
- Sonal Shah, PharmD, and Greg Reh, American Journal of Managed Care
42
Source: S. Shah, G. Reh, “Value-Based Payment Models in Oncology: Will They Help or Hinder Patient Access to New Treatments?” AJMC, 18 April 2017,
http://www.ajmc.com/journals/evidence-based-oncology/2017/april-2017/value-based-payment-models-in-oncology-will-they-help-or-hinder-patient-access-to-new-treatmentsMarket Shift to New Payment Models:
CMS’ Oncology Care Model
Nearly 200 oncology practices are participating in the Oncology Care Model
(OCM) to improve quality an reduce the cost of cancer care in Medicare Part B.
OCM* Practice Results – Performance Period One
Achieving a performance-based payment 25%
Achieving significant savings 60%
Implementing Guidelines-Based Care 100%
*The Oncology Care Model (OCM) aims to provide higher quality, more highly coordinated oncology care at the same or lower cost to Medicare. Under OCM, physician practices have
entered into payment arrangements that include financial and performance accountability for episodes of care surrounding chemotherapy administration to cancer patients. The
practices participating in OCM have committed to providing enhanced services to Medicare beneficiaries such as care coordination, navigation, and national treatment guidelines for
care. CMS is also partnering with commercial payers in the model.
43
Source: Journal of Clinical Pathways. “Early Data Show Positive Trend in OCM Cost Savings” March 27, 2018.Manufacturers and Insurers Pursuing
Outcomes-Based Contracts in Oncology
Shared risk or outcomes-based contracts (OBCs) between health insurers and
manufacturers are becoming more common across diseases, including oncology.
Number of Private Sector Risk-Sharing
Contracts Publicly Announced
70 More than 40% of the 65
60 outcomes-based contracts
50 projected between 2018-2022
40
are expected to be in
oncology.
30
20
10
0
2013-2017 2018-2022
44
Source: IQVIA. 2018 and Beyond: Outlook and Turning Points. March 2018. Available online at: https://www.iqvia.com/institute/reports/2018-and-beyond-outlook-and-turning-pointsSite of Care Shifts Drive Higher Cancer Costs
The rate of commercially insured patients receiving infused chemotherapy in
hospitals increased from 6% of transfusions in 2004 to 43% in 2014.
2004 2014
2% 2%
6%
Physician Office
Hospital Outpatient Department
43%
55% Other
92%
45
Source: Winn AN, Keating NL, Trogdon JG, Basch EM, Dusetzina SB. Spending by Commercial Insurers on Chemotherapy Based on Site of Care, 2004-2014. JAMA oncology. 2018 Apr
1;4(4):580-1. Available online at: https://jamanetwork.com/journals/jamaoncology/fullarticle/2673075.Site of Care Shifts Drive Higher Cancer Costs
Commercial spending on chemotherapy infusions and oncology 6-month treatment episodes are
twice as high in the hospital outpatient department compared to the physician office setting.
Average Drug-Level Spending on Infused
Chemotherapy (2004-2014)
$4,000
$3,500 $3,799
$3,000
$2,500
$2,000
$1,500
$1,466
$1,000
$500
$0
Physician Office Hospital Outpatient Department
46
Source: Winn AN, Keating NL, Trogdon JG, Basch EM, Dusetzina SB. Spending by Commercial Insurers on Chemotherapy Based on Site of Care, 2004-2014. JAMA oncology. 2018 Apr
1;4(4):580-1. Available online at: https://jamanetwork.com/journals/jamaoncology/fullarticle/2673075.Hospital Consolidation Associated with Increases in
Cancer Spending
Spending increases associated with just a 1% increase in the proportion of
medical providers affiliated with hospitals and/or health systems.
34%
23%
Per Person Per-Person
Price of Treatment Annual Spending
47
Source: Conti RM, Landrum MB, and Jacobson M. The impact of provider consolidation on outpatient prescription drug-based cancer care spending. 2016.340B Creates Incentives to Shift Delivery of Physician-
Administered Cancer Medicines to More Expensive
Hospital Settings
Site of Care for Breast Cancer Drug Therapies
Reimbursed in Medicare Part B
2008 2009 2010 2011 2012 2013 2014 2015 2016 2017
11% 13% 15% 19% 24% 28% 32% 33%
17% 35% 38%
18% 340B
18% Hospitals
17%
18%
19% Non-340B
19% 18% 17%
16% Hospitals
Physician
73% 70% Offices
67% 64%
58%
53% 50% 49% 48% 46%
48
Source: Berkeley Research Group, Site of Care Shift for Physician-Administered Drug Therapies, March 2019.6. US System in Context
49US Patients Have Access to Cancer Medicines on
Average Two Years Earlier Than Patients in Other
Developed Countries
Other developed countries use centralized government price setting and coverage
decisions to manage drug spending, resulting in significantly slower access to
medicines than in the US.
Average Time Delay Compared to the US in the Approval and
Reimbursement of Oncology Medicines from 2010 to 2014
Germany 10 4 Delay Between US Approval and
France 10 7
Country-Specific Approval
Delay Between Country Approval
UK 10 13
and Reimbursement
Italy 10 15
Spain 10 17
Australia 15 17
Taiwan 22 21
0 10 20 30 40
Months
50
Source: PhRMA analysis of IMS Consulting Group “Patient Access to Innovative Oncology Medicines Across Developed Markets”. June 2016More Cancer Medicines are Available to US Patients
Availability of Oncology Medicines within One Year of Global Launch,
2011-2018
80
77
70
60
50
46
40 44
30
30
20
18
16 16
10
9
6 6
0
US Germany UK Canada France Italy Japan Australia Spain South
Korea
51
Source: PhRMA analysis of IQVIA Analytics Link and FDA, European Medicines Agency (EMA) and Japan’s Pharmaceuticals and Medical Devices Agency (PMDA) data on oncology
new active substances first launched globally from 2011 to 2018, June 2019.US Patients Have Better Outcomes in Cancer
Cancer death rates are lower in the US where patients have access to cancer
medicines about 2 years earlier than in other developed countries
Age-Standardized Cancer Death Rates, 2013*
128.9
Deaths per 100,000
122.8
120.5
119.7
115.2
USA Italy France Germany UK
*2013 is the latest year for which data are available for all listed countries.
52
Source: PhRMA analysis of WHO Mortality Database, May 2019. Note: 2013 data was used because some countries lack newer data.In Other Countries, Governments Restrict
Access to Cancer Medicines
Health technology assessment (HTA) recommendations across countries show little
consistency, highlighting the effect of cultural factors on HTA design and implementation,
and that a “one-size-fits-all” approach is not realistic in determining access to needed
medicines.
Outcome of Health Technology Assessments for Cancer Treatments
(2013 - 2017)
22
16
In the U.K. only 7
8
government
17
assessments
recommended
70
70 6 without restrictions.
20 55
15
7
United Kingdom Canada Germany (IQWiG/G- France (HAS)
(NICE) (CADTH/pCODR) BA)
Recommended Recommended with Restriction Not Recommended Outcomes were classified as “Recommended with Restrictions” if
there were limitations that may impact access.
53
Source: Data provided by Avalere Health (citation forthcoming).Lung Cancer Patients Experience Better Survival Under the
Market Access Policies in the United States
Americans diagnosed late-stage non-small cell lung cancer gained an estimated 201,700 life years from
2006 to 2017 due to innovative medicines being made available with little to no delay after regulatory
approval. Patients would have lost half of these survival gains if the United States had adopted HTA
frameworks like those used by foreign governments to determine access to care.
54
Source; IHS Markit. Comparing Health Outcome Differences Due to Drug Access: A Model in Non-Small Cell Lung Cancer. December 2018. https://ihsmarkit.com/research-
analysis/population-health-outcomes-american-patients.html7. Solutions For Advancing
Value in Cancer Care
55Advancing the Path for Development of
New Cancer Medicines
Advances in regulatory science are creating efficiencies and enhancing the tools
needed to drive innovative cancer drug discovery, development and approval.
Solutions For Accelerating Cancer Progress
Increasing
Accelerating Advancing Use of
Integrating Patient Acceptance of
Qualification & Use Real-World
Perspective Novel Clinical Trial
of Biomarkers Evidence
Designs
Incorporate patient Increase acceptance of Enable use of both Enhance use of
input & increase novel outcome safety & efficacy data adaptive & other
patient engagement. measures in regulatory decision flexible study designs
making.
56Biopharmaceutical Companies Advancing
Patient-Centered Solutions for Better Value
Expand Value-
Based
Contracts
SOLUTIONS
Improve Use of
Medicines FOR Strengthen
Decision
BETTER Support Tools
CANCER
CARE
Increase
Develop Quality Availability of
Measures Evidence on
Value
57Enabling the Cancer Drug Market’s Move to Value
Value Based Contracts Value Frameworks Quality Measures
Expand value-based Develop better data and Close gaps in clinical
contracts by tools to support informed and patient-focused
modernizing outdated decision-making by quality measures.
regulations. patients, physicians and
payers.
“[R]egulatory reforms can “[E]merging approaches for “All phases of the cancer
address these concerns assessing drug value are care continuum…need new
and encourage more welcome….The frameworks measures.”
robust competition within will require refinement,
the drug market.” however, before they're - National Academy of Medicine
ready to be broadly applied.”
- Scott Gottlieb &
Kavita Patel - Peter Neumann &
Joshua Cohen
58
Sources: S Gottlieb, K. Patel, “A Fair Plan for Fairer Drug Prices,” Health Affairs, 11 July 2016; Institute of Medicine, “Delivering High-Quality Cancer Care: P. Neumann, J. Cohen,
“Measuring the Value of Prescription Drugs,” NEJM, December 2015; Institute of Medicine, “Delivering High-Quality Cancer Care: Charting a New Course for a System in Crisis,” 2013.You can also read