Canfor Corporation CIBC Marketing June 2020
←
→
Page content transcription
If your browser does not render page correctly, please read the page content below
Canfor Corporation
CIBC Marketing
June 2020

                     1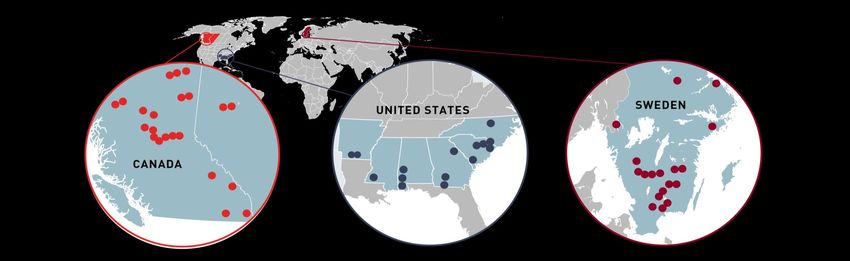
CIBC Marketing

Alan Nicholl            Pat Elliott
CFO and Executive VP, SVP, Finance and Sustainability
Finance and Canfor Pulp

The presentation and answers to questions today contain forward-looking
statements which involve known and unknown risks, uncertainties and other
factors that may cause actual results to be materially different from any future
results, performance or achievements expressed or implied by such statements.
Factors that could have a material impact on any future oriented statements
made herein include, but are not limited to: general economic, market and
business conditions, product selling prices, raw material and operating costs,
foreign exchange rates, interest rates, changes in law and public policy, the
outcome of trade disputes, and opportunities available to or pursued by the
Company.

For further details on these factors and our assumptions and applicable risks
and uncertainties, please refer to Canfor Corporation’s Annual Report for the
year ended December 31, 2019 available at www.canfor.com or www.sedar.com.

                                                      2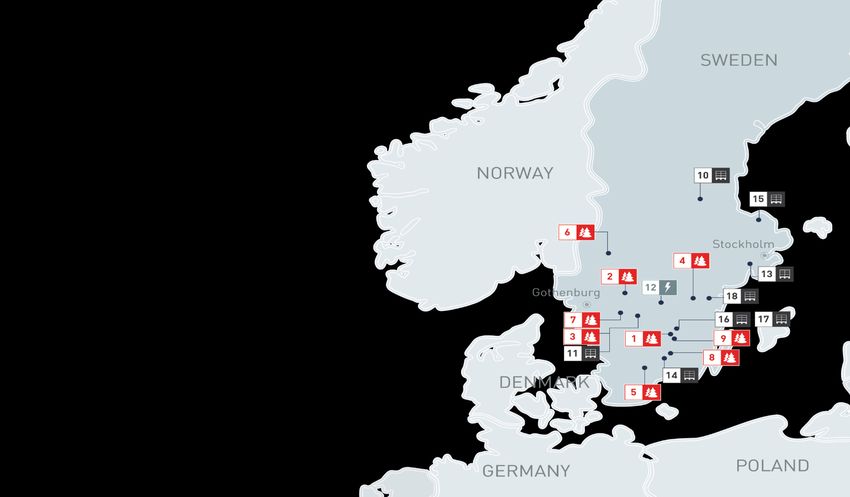
Lumber
Supply & Demand

                  3
LUMBER MARKETS – US Supply and Demand

2020 – US Softwood Lumber Supply & Demand
U.S. Lumber Supply                                                           U.S. Lumber Demand

                                                                                                                            2020
Supply (Bfbm)                       2018 Est.   2019 Est.   2020 Fct.        Segments (Bfbm)        2018 Est.   2019 Est.
                                                                                                                            Fct.

U.S. PRODUCTION                         34.9      35.1        34.2            New Home1               15.8        16.2      14.8

 Imports – Canada                       13.6      13.2        11.1            Repair & Remodeling     17.5        17.5       19

 Imports – EU & Other                    1.4       1.5         1.6            Industrial              12.0        12.1      9.7

 U.S. Exports (minus)                    1.7       1.4         1.1            Non-Residential          2.5           2.6    2.3

Total Supply                           48.2       48.4        45.8           Total Demand             47.8        48.4      45.8

Source: WWPA, Statistics Canada, FEA, Canfor                                                                     4
                                                                                                                                   4
US Housing Starts
•         Q2 housing starts continue to track 25-30% below Q4 2019 levels
•         Moderate improvement continues in Q3 and returning back to 2019 levels in Q4 2020
•         Single family starts to hold a higher percentage of total starts post COVID-19, supported by suburbanization
•         Lack of existing homes for sale and declining new home premium will improve starts

                                                                                                                   Analysts’ Forecast – April 2020
1,600

1,400                                                                                                  1,320     Housing Starts     2020        2021
                                                                                       1,290                           (SAAR)
                                                                               1,250
                                                         1,174     1,200
1,200                                                                                          1,150
                                            1,112
                                  1,004                                                                                RBC           1.16       1.25
1,000                    925

               780
                                                                                                                       NAHB          1.08       1.33
    800
                                                                                                                       CIBC          1.22       1.37
    600
                                                                                                                    Fannie Mae       1.17       1.26
    400

                                                                                                                       MBA           1.20       1.38
    200

                                                                                                                       FEA           1.06       1.32
     -
              2012      2013      2014      2015         2016      2017        2018    2019    2020    2021
                                                                                                               Industry Average      1.15       1.32
                                              Single Family      Multifamily

         Source: U.S. Census Bureau, Canfor, CIBC, APA                                                                                      5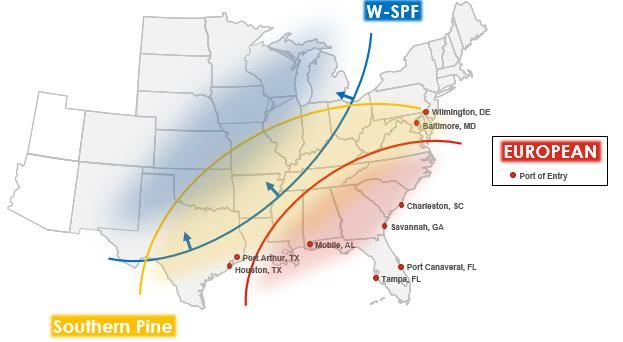
R&R Spending – US Housing Stock Currently Oldest In History
•   High sales of existing homes in 2019 supports high potential for R&R in 2020
•   Currently experiencing increased levels of home center demand; home improvement spending was up 6.5% YoY in April
•   Homeowner equity trending at high levels, allowing homeowners to access these funds for large scale improvements

                Share of Homes Built by Year                                                                                                               Homeowner Equity
                                                                                                21,000

                                                                                                19,000

                                    4%                                                          17,000

                                               16%                          2010 >
                                                                                                15,000
             38%                                                            2000 - 2009
                                                                                                13,000
                                                        15%                 1990 - 1999
                                                                                                11,000
                                                                            1980 - 1989
                        14%                  13%
                                                                            1970 - 1979          9,000
W-SPF Declines While US South and EU Imports Gain Market Share
                                    • As W-SPF production declines, diversified species and global
                                      operations allow us to support our US customers

                                    • Softwood imports from EU will remain heavily dependent on housing
                                      starts

                                    • German, Austrian, and Swedish manufacturers hold largest share of
                                      EU imports in North America

                                    • We expect an annual increase of 28% pushing US imports of EU
                                      lumber to 1.3 BBF

                                                     US Import Volume from EU (BBF)
                                    2.5

                                      2

                                    1.5

                                      1

                                    0.5

                                      0

                                                                                 7
EU Markets: Post COVID-19
• Initial production cuts throughout Northern Europe began in early April in response to COVID-19 related demand declines
• UK demand remains the largest intra-Europe outlet for European SPF production
• UK residential property transactions fell sharply in April, indications of sharp rebound in May supported by re-opening
• UK demand will dictate level of increased EU shipments to US
UK Residential Property Transactions
160,000
140,000
Property Transactions (SAAR)
120,000
100,000
80,000
60,000
40,000
20,000
0
Sep
Sep
Sep
Sep
Sep
Sep
Sep
Sep
Sep
Sep
Sep
Sep
Sep
Sep
May
May
May
May
May
May
May
May
May
May
May
May
May
May
Jan
Jan
Jan
Jan
Jan
Jan
Jan
Jan
Jan
Jan
Jan
Jan
Jan
Jan
Jan
2006 2007 2008 2009 2010 2011 2012 2013 2014 2015 2016 2017 2018 2019 2020
Source: Zoopla 8
EU Beetle Kill: Production & Trade Outlook
• EU softwood lumber production is poised to remain level over 2020 and 2021 as investments currently under way will not provide additional production in the
  near term

• We expect EU exports of logs to continue increasing despite COVID-19 as EU producers work to harvest beetle kill timber; reaching ~10 million m3 in 2021

• With fewer foreign workers in Russia and disrupted trade lanes due to COVID-19, we expect Russian log exports to China to remain below average for Q3

                                                                                                                                 EU Softwood Lumber Production
                                                                                                    60

                                                                                                                                                                                               48     48     49
                                                                                                    50                                                                          46       47
                                                                                                                                                                         45

                                                                          Production Volume (BBF)
                                                                                                                                 42                     43        43
                                                                                                          41              42            41       41
                                                                                                                 38
                                                                                                    40

                                                                                                    30

                                                                                                    20

                                                                                                    10

                                                                                                    0
                                                                                                         2008   2009     2010   2011   2012     2013   2014     2015    2016   2017   2018    2019   2020   2021

                                                                                                                      Austria          Czechia                Finland           France
                                                                                                                      Germany          Latvia                 Poland            Romania
                                                                                                                      Sweden           United Kingdom         Other

Source: FEA, Eurostat                                                                                                                                                            9
China: Markets & Supply
Markets:
     •      Chinese index for new export orders continues below growth levels, we expect consumption to remain low
     •      Recent announcements around increased infrastructure spending may improve demand in Q3
     •      Chinese exporters are pivoting capacity to meet domestic demand but they have run into difficulties, this is slowing consumption
Supply:
     •      Russian government has banned Chinese workers to control COVD-19, this has resulted in Chinese run lumber mills shutting
     •      Opportunities for additional supply from Canada and EU will improve with decline in shipments ex Russia
     •      Recent special issue exemptions from the Chinese government on US SYP log imports will push up SYP log imports

 Source: FEA, IHS Markit                                                                                                             10
Commodity Lumber Prices (US$/Mfbm)
2017 BC Forest Fires 2018 Severe Winter Curtailment Curtailment Curtailment
1.2 M ha. (July - Sept) Railcar shortage Announcements Announcements Announcements
650
600
550
500
450
400
350
300
250
JanFeb Mar Apr May Jun Jul Aug Sep Oct Nov Dec Jan Feb Mar Apr May Jun Jul Aug Sep Oct Nov Dec Jan Feb Mar Apr May Jun Jul Aug Sep Oct Nov Dec Jan Feb Mar Apr May June
2017 2018 2019 2020
WSPF 2x4 2&Btr 310 375 359 407 388 368 403 395 419 446 484 457 493 523 524 552 634 609 564 468 414 323 337 320 335 406 371 328 312 360 356 340 373 361 385 385 396 433 367 317 361 378
SYP E 2x6 #2 332 361 380 401 368 343 342 360 392 422 414 411 391 415 399 411 521 552 477 383 354 307 336 341 318 349 326 314 283 265 320 314 340 306 305 283 305 301 317 301 447 482
Current pricing (June 26, 2020)
20.26% CVD • WSPF 2x4: $432
Duty (April – Aug 2017) 7.28% ADD 20.52% CVD / ADD • SYP 2x6: $480
Rate (July – Dec 2017) (Jan 2018 – Oct 2020)
Source: Random Length Publications, Inc., Canfor
11Operations
12Canfor
Operations
Lumber Regional Lumber Capacity Other Operations
4%
• 34 Sawmills with annual operating capacity of 6,700 MMfbm • 9 value-added facilities (packing, housing, energy) – Sweden
• 10 Western Canada - 3,200 MMfbm • 3 Pellet Plants – BC
22%
• 12 US South - 2,000 MMfbm • 2 Glulam Plants – US South
• 12 Sweden - 1,500 MMfbm* • Finger Joint Plant – US South
43%
• Green Energy Plant – BC
• Trucking Fleet – US South
Pulp and Paper
• 4 Mills in British Columbia
• 1.1 million tonnes of Northern Softwood Kraft
31%
• 230k tonnes BCTMP
• 140k tonnes Kraft Paper BC US South Europe Alberta
*Lumber capacity includes planned acquisition of Bergs Timber
13Western Canada
• Significant action taken over the past 18 months in response to challenging market conditions and elevated log costs in British Columbia
• Approx. 2.2 billion board feet of permanent industry rationalization to-date
• Estimated ~1.0 billion board feet of additional rationalization required to balance demand with long-term fibre supply
• Industry wide production curtailments in response to COVID-19 have reduced production by approx. 600 million board feet to-date in Western Canada
• Company has taken a number of short and long term measures to mitigate fibre cost escalation and support improved market pricing
• Anticipating modest reduction in log costs in 2020 reflecting impact of rationalization and lower market pricing in 2019
• Sales realizations anticipated to benefit from a ~15% reduction of duty rates effective October 2020
$100 Lumber Price vs. BCTS Bidding $1,000
2019 MPS
$90 Update $900
CVD / ADD Cash Deposit Rates
Lumber Price ($Cdn/Mfbm)
$80 $800
Company Current Rate New Rate* Change % Change
Bid Price ($/m3)
2020 MPS
$70 2018 MPS $700
Update
Update Canfor 20.5% 4.6% -15.9% -77.4%
$60 $600
West Fraser 23.6% 9.1% -14.5% -61.5%
$50 $500 Resolute 17.9% 15.8% -2.1% -11.5%
$40 $400 Tolko 22.1% 8.2% -13.9% -62.8%
$30 $300 J.D. Irving 9.4% 4.3% -5.1% -53.9%
$20 $200 All Others 20.2% 8.2% -12.0% -59.4%
*Preliminary rate effective October 2020
BCTS Avg Bid ($/m3) 2x4 RL 2&Btr ($/Mfbm)
14US South
• Currently benefitting from unprecedented demand
from home centers and lumber treaters
• Total lumber capacity of 2.0 billion board feet with full
run-rate achieved in 2021
• Over 300% growth since 2013, including 2019
acquisition of Elliott Lumber Company (210 MMfbm)
• 300 MMfbm organic program (US$125 million) to be
completed in 2020
• Strong fibre supply region, high performing
operations Fulton Planer mill; CDK;
infrastructure
( Completed 2019)
• Focus on high-value products and market
diversification supporting sales realizations and
strong operating margins
Camden – Full Mill Upgrade
(Finishing 2020)
15Customer Channels – Aligned for the Future
SPF CUSTOMER CHANNELS
WHOLESALE DISTRIBUTION • SPF customer channels heavily aligned with key pro-dealer
accounts able to respond to housing demand
PRO DEALER
• Strong alignment with Home Centers continues as we support
programs with Euro supply
HOME
• Key industrial accounts allow for diversification (e.g. Universal
CENTER Forest Products)
OFFSHORE
• Continued exposure to offshore markets allowing for global
INDUSTRIAL
diversification
SYP CUSTOMER CHANNELS
• Continued growth with Home Center accounts has allowed SYP to
WHOLESALE DISTRIBUTION capture a key DIY demand segment
HOME CENTER
• High value products aligned with key treater accounts continue to
provide return and increased exposure to R&R sector
• Focus on the pro-dealer segment provides diversified demand
TREATER INDUSTRIAL
channel aligned well with housing starts
• Strategic accounts in offshore markets aid in diversification and
exposure to more high value accounts
OFFSHORE
PRO DEALER
16Diversified Customers and Markets
• Currently experiencing strong R&R and Home Center demand in North
America (segment represents approx. 20% of WSPF production)
• Notwithstanding solid R&R activity, overall lumber demand anticipated to
decline moderately in 2020 as a result of reduced US housing construction
activity
• Company’s high-value product mix and diversification efforts supporting sales
realizations despite market uncertainty
• Steady takeaway in key offshore markets supporting pricing in North America
• Shipments to China approx. 20% of WSPF production with ability to
increase based on current demand
Canfor WSPF Sales by Country -2007 Canfor WSPF Sales by Country - 2019
USA Canada China Japan Other USA Canada China Japan Other
17Canfor High Value Product Diversification
Products that unlock incremental value with stabilized pricing
J grade & Square Edge Dimension
Appearance Boards, Pattern, Fascia, Clear
Visual appearance is primary purchase variable
SYP Long Length 22’/24’/26’
Application SPF & Spruce Metric Sizes
Matching sizes to end-user requirements
MSR Dimension
Lamina Blanks
Strength SYP Glulam Beams
Leverage fibre strength to match demand
18VIDA
• Vida’s 9 sawmills currently operating at full capacity (annualized rate of 1.2 billion board feet)
• Production primarily focused on structural timber, majority of which is exported to markets other than North
America
• Vida’s largest market is the UK, comprising approx. 30-35% of volume
• Other key markets include Asia, Australia, North Africa and the Middle East
• Geographic and product diversification contributing to more steady pricing despite current global economic
challenges
• Access to significant supply of high quality spruce and pine fibre in close proximity to sawmills
• Fibre costs tightly correlated to market pricing supporting more stable earnings
VIDA Sales by Country - 2019
• Canfor and VIDA are well positioned to capitalize on joint global market opportunities with significantly enhanced
market and geographic diversification; currently on track to achieve targeted synergies
• Recently announced acquisition of 3 sawmills from Bergs Timber (expected to close in Q3 2020)
• Purchase price of ~C$43 million, plus working capital
• Current production of 215 million board feet; targeting 300 million board feet capacity with modest capital
investment
• Strong strategic alignment with Vida’s existing sawmills
UK Other Europe Sweden USA Asia/Australia Other
• Proforma European lumber capacity of 1.5 billion board feet
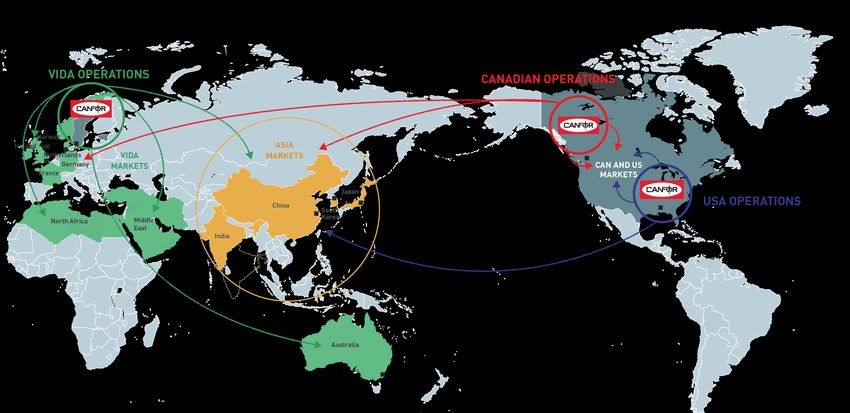
19VIDA Acquisition Enhancing Market & Product Diversification
SALES OFFICES
20Liquidity Update - Canfor
Available Liquidity Scheduled Maturities*
(Canfor Excl. Canfor Pulp) (Canfor Excl. Vida and Canfor Pulp)
$700 $600
$600 $500
$500
$400
($ millions)
($ millions)
$400
$300
$300
$200
$200
$100 $100
$- $-
2015 2016 2017 2018 2019 Q1 2020 2020 2021 2022 2023 2024 Beyond
Operating Loan Facility Cash Term Debt Operating Loan Facility Revolver (Undrawn)
Canfor (excluding Canfor Pulp) had available liquidity of approximately $400 million at end of Q1 2020
A number of initiatives underway to preserve balance sheet strength in light of COVID-19 uncertainty:
$20 million reduction of planned capital expenditures (excluding Canfor Pulp). Currently anticipating lumber segment capital spend of $90 million in 2020, of which
approximately $25 million relates to European operations (total lumber segment capital spend reduced by approximately $110 million from 2019)
Accelerated filing of tax returns supporting early receipt of tax refunds (~$115 million anticipated by end of 2020)
Significant focus on reducing working capital, with liquidity in the second quarter benefiting from a seasonal unwind of inventory
Suspension of all non-essential overhead, disciplined cash management and government programs supporting liquidity
$200M revolving credit facility undrawn and set to expire mid 2021; no scheduled debt maturities until late 2023
Solid earnings supporting Vida’s planned acquisition; Vida anticipated to retain strong liquidity position through balance of 2020; operating lines renewed annually
The Company remains in full compliance with all covenants relating to operating loan facilities and long-term debt and expects to remain so for the foreseeable future
*US dollar denominated term debt translated at an assumed CAD to USD foreign exchange rate of $1.30
21Canfor Pulp
22Pulp Market Outlook
Supply Demand
• Softwood capacity projected to drop in 2020 after conversions to • Global tissue demand up 3.3% in Q1 2020 reflecting increased “At
dissolving pulp at Stora Enso Enocell in Sweden and Arauco Home” demand, offset in part by lower “Away From Home” usage
Valdivia in Chile
• Global tissue demand estimated to growth at ~3% 2020 - 2024
• COVID-19 providing some challenges with respect to sawmill
• Global Printing & Writing Paper decline accelerating due to COVID
residual fibre availability, major maintenance and project schedules
(down 12% for Q1 2020) with Western Europe seeing significant
• PPPC projects Softwood Market Pulp Capacity in 2024 to be weakness (down 15% for Q1 2020)
400,000 tonnes lower than 2019
• PPPC projects a 4.3% decrease in global demand for Market Pulp in
• PPPC forecasts global pulp demand/capacity balance for softwood 2020 and 5.6% decrease in Softwood demand
market pulp at 89% in 2020, rebounding to 92% in 2021 and
• PPPC estimates Chemical Market Pulp Demand to rebound by 4.4%
gradually increasing to 94% to 2024
in 2021 and increase by an average of 1.5% annually between 2022-
• Capacity increase through 2024 will concentrate on Hardwood 2024
market pulp in South America leading to hardwood pulp
demand/capacity balance in the 87% to 90% range
232008-2020 Global Market Pulp Demand
China is the largest consumer of pulp
Europe Asia N.America Other
40,000
35,000
30,000
Million Tonnes
25,000
20,000
15,000
10,000
5,000
0
2008 2009 2010 2011 2012 2013 2014 2015 2016 2017 2018 2019 2020
Source: PPPC 24Liquidity Update – Canfor Pulp
Available Liquidity Scheduled Maturities
Canfor Pulp Canfor Pulp
$200 $120
$100
$160
$80
($ millions)
($ millions)
$120
$60
$80
$40
$40
$20
$- $-
2015 2016 2017 2018 2019 Q1 2020 2020 2021 2022 2023 2024 Beyond
Operating Loan Facility Cash Term Loan Operating Loan Facility
Canfor Pulp had available liquidity of approximately $100 million at end of Q1 2020
Significantly reduced capital spend in 2020 supporting balance sheet strength with planned capital expenditures reduced by $15 million in response to COVID-19
Suspension of all non-essential overhead, disciplined cash management and payment deferral programs supporting liquidity
Suspension of quarterly dividend for the foreseeable future recognizing the unprecedented challenges facing the global economy and the Company’s cash preservation efforts
Previously announced $40 million cost reduction initiative underway, with full benefits achieved by end of 2021
$50 million term debt matures in late 2022, with available operating line providing adequate liquidity for the foreseeable future
The Company remains in full compliance with all covenants relating to operating loan facilities and long-term debt and expects to remain so for the foreseeable future
25Canfor / Canfor Pulp – Value Proposition
High Quality Products Sustainable, High-Quality Well Capitalized Top Performing Balance Sheet
& Customers Fibre Supply Mills Pulp, Lumber Business Liquidity
26Investor Contacts
Pat Elliott Alan Nicholl
SVP, Finance and Sustainability CFO and Executive Vice President, Finance and Canfor Pulp
patrick.elliott@canfor.com 604-661-5441 alan.nicholl@canfor.com 604-661-5370
27You can also read