El Nino, Pineapple Express or Climate Change
←
→
Page content transcription
If your browser does not render page correctly, please read the page content below
El Nino, Pineapple Express or
Climate Change
                             What Happened to Our
                            Water Supplies this Year?

IWUA Summer Water Law &                Teton National Park
Resource Issues Seminar              Thanksgiving Nov 2013
June 24, 2014 Sun Valley, Idaho
Ron Abramovich
Water Supply Specialist
USDA NRCS Snow Survey Boise, Idaho
Topics:
• Review of Climate Indices
     • Pacific Decadal Oscillation (PDO) - Past cycles & trends
     • ENSO Correlations– El Nino – Neutral - La Nina

•   Fall Winter Forecasts for Winter of 2013/2014
     • 6 Different Forecasts & Several Different Opinions
     • Rule #1 - Don’t believe the 1st forecast you hear
     • Which Forecasts Worked, and Why

•   Past Research - Should we expect more of the same climate variability in the future?
          Or is this Climate Change?
     • Streamflow forecast accuracy & increase in Spring precipitation variability
     • Recent examples of climate variability & current research

•   Winter 2013-2014 - What happened & when did we learn what we now know?
    • Surf’s Up – January’s change in weather pattern

•   El Nino Watch for Summer 2014
•   Early Winter Outlooks for 2014-2015 – could the Winter of 2013/2014 be just another El
    Nino year or could it be setting up similar to the Winter of 2013/2014?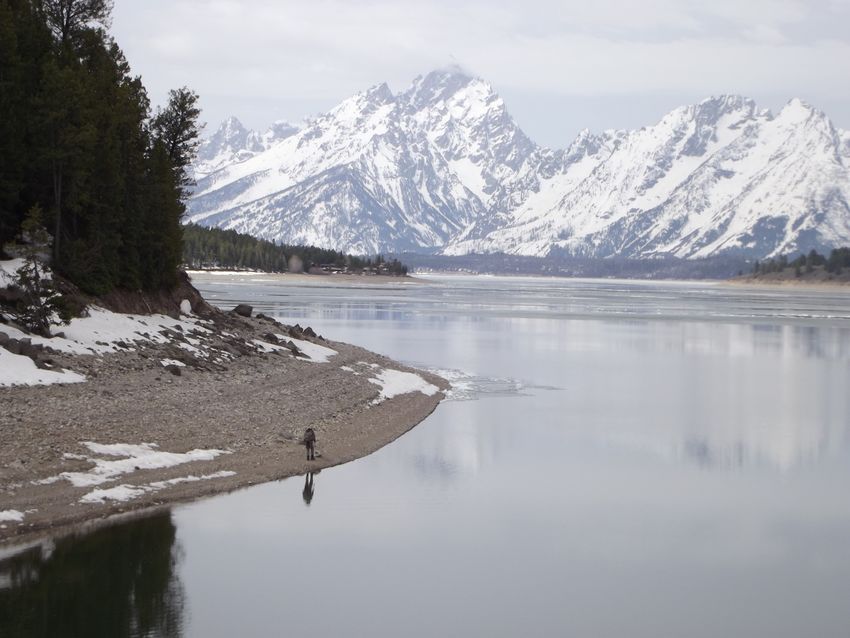
Andrew’s -- Preliminary 2014-2015 Winter Forecast                     Summary
 Posted: 14 Jun 2014 03:26 PM PDT
 "Another Cold Winter May Be Brewing..."                                  First
       Temperature                                         Precipitation
                                     Analog Years
                                     Dec-Feb
                                     1986-1987
                                     2009-2010
                                     1981-1982
                                     1983-1984

The Forecast      What Can We Expect This Winter?
It's too early to make maps for this upcoming winter, but we have an abundance of
hints we can use for some early forecasting.

For the Pacific Northwest: A warmer than normal winter with around
average precipitation is currently favored, due to the state of the
Pacific Ocean and choice analog year. Snowfall is projected to be
slightly above normal.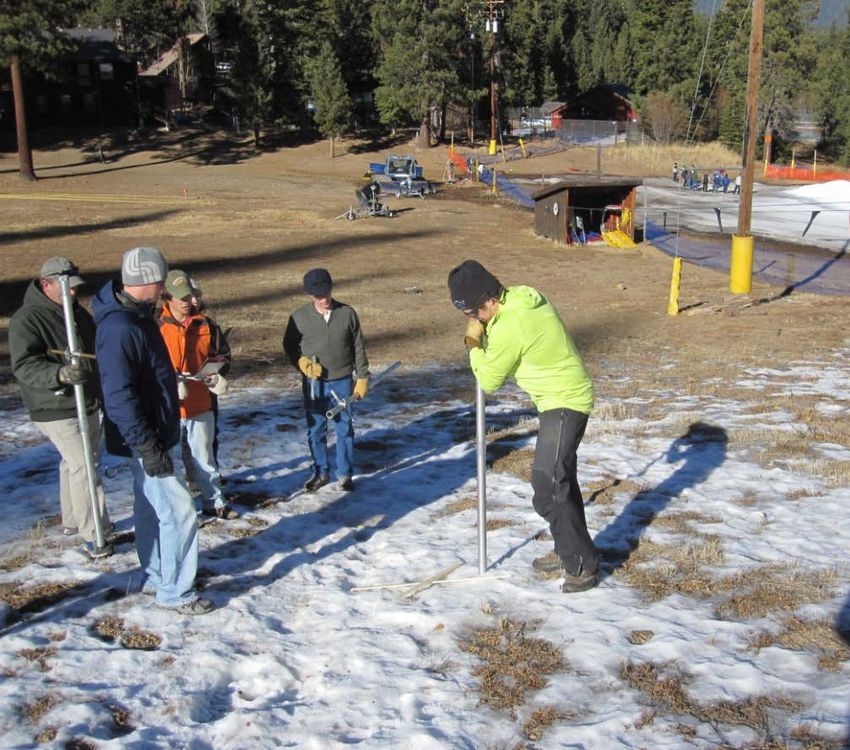
Summary
First

Putting these two correlation comparisons together mean a
positive PDO & El Nino may result in some very cold
weather in the South & East US, with warmer temperatures
stretched out across the North & West US.

The PDO and El Nino are not the only two indices in the
atmosphere, which may mean other factors may lessen this
potential cold winter foreshadowing. We will get a better
handle on this situation this summer and fall. Andrew
Teleconnections – climatic indexes               - key is understanding their
correlations and influence on current weather (and snow, flow & more).

Primary Ones:
    PDO           Pacific Decadal Oscillation – larger cycle
    ENSO          El Nino Southern Oscillation – short cycle
                  El Nino Neutral La Nina measure of Sea Surface Temperature SST
    SOI           Southern Oscillation Index measure of barometric pressure
                  difference between Darwin & Tahiti

AMO       Atlantic Multidecadal Oscillation
          Key to past winter – went negative for handful of months…
                   in May it was declared back + phase

Additional Climate Indices:
   NAO           North Atlantic Oscillation
   AO            Artic Oscillation
   SSW           Sudden Stratospheric Warming
   Sun Spots, Solar Activity, Polar Vortex, and more…..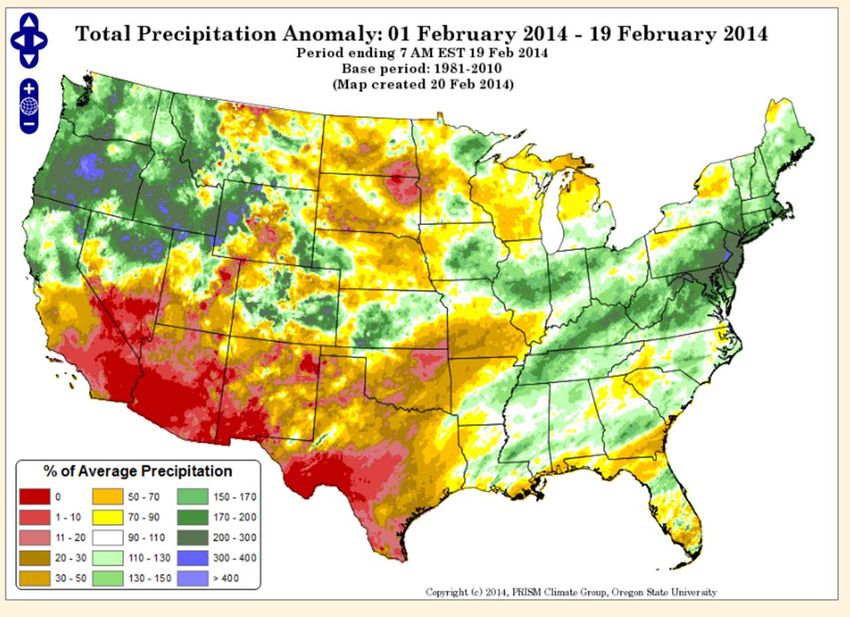
Cool Phase

Cool Phase   Warm Phase
Warm Phase   Cool Phase   Warm Phase

90%
Correlation Map of the
Southern Oscillation Index
  (SOI) with spring and
   summer streamflow

                              Dry El Nino

Winter 2013-2014              Wet La Nina

• ENSO Signal:               No / Little
Neutral & SOI                Correlation

• Pacific Decadal
Oscillation (PDO) in
cool phase since at
least 2008 or 1997             Wet El Nino
                               Dry La Nina
Nov 2010 – Strong La Nina Nov 2011 – Weak La Nina
November 2012 ----- Neutral Years ----- November 2013
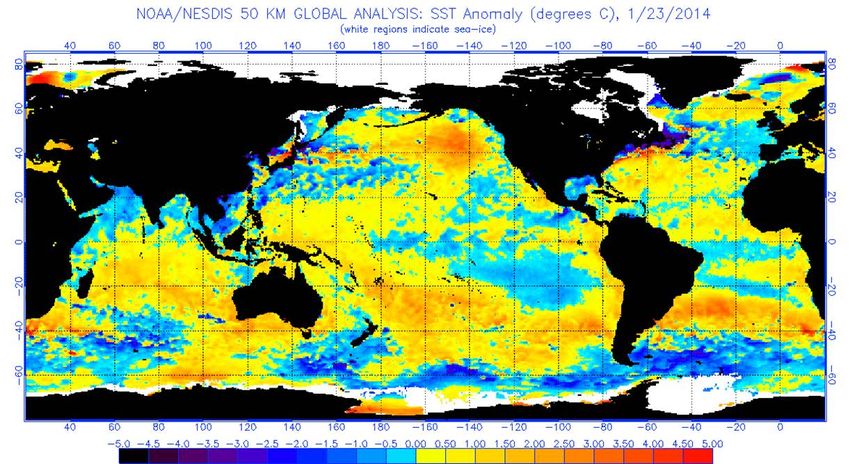
11January 23, 2014 – warm water in northern Pacific increasing
June 16, 2014 – El Nino BrewingEl Nino Watch for Summer 2014 75% Chance El Nino will develop by Summer or Fall
El Nino Watch for Summer 2014
75% Chance El Nino will develop
by Summer or Fall
Winter 2010-2011 Strong La Nina

Year 1                Year 2               Year 3
Fall 2014 - hints at early fall,
• Cold temperatures are building up over Artic,
  Sept snow & rain put forest fires out

Our Crystal Ball isn’t always round…
Fall Forecasts for Winter
         2013-2014
Weather      Streamflow
Forecasts    Forecast       Combo
 XXXX           X            X

6 Different Sources of Forecasts

Several Different Results
Rule #1 • Don’t believe the 1st forecast you hear • Wait until you hear the Same or Similar forecast from two or more of your unrelated sources
NOAA Forecast from
                               Oct 17, 2013
                             for Nov, Dec, Jan
Nov, Dec, Jan Temperature       Nov, Dec, Jan Precipitation
Pete Parsons Nov. 2013 – Jan. 2014 Forecasts
Temperatures Precipitation
- A stormy but relatively mild Nov and early Dec should give way
to much colder weather in late December and/or January.
- Precipitation should be well above average, with episodes of
“extreme” weather likely (i.e. windstorms, floods, valley snow,
Arctic air).ENSO Indices
SOI* Values For the Top "Analog Years"
and the Current 2-Year Period (2012-13)
(1967-68; 1980-81; 2006-07)
2.0
La Niña
1.5
1.0
2012-13
0.5 1967-68
SOI
1980-81
0.0 2006-07
-0.5
Neutral
-1.0
El Niño
-1.5
J F M A M J J A S O N D J F M A M J J A S O N D
Month
*For SOI explanation see: http://oregon.gov/ODA/NRD/docs/pdf/forecast_method.pdfNRCS - Jan Curtis - Applied Climatologist retired after 41 years with several agencies. Jan always had a wealth of info to share about current weather & future outlook that might affect snowfall, snow accumulation, snowmelt rates, peak flows, and fall weather patterns hinting at first frost. Position is vacant - not sure when this NRCS Meteorologist / Applied Climatologist will be filled. He looks at a number of climate indices including solar activity – General forecast - with neutral conditions, precip could be near normal for West but bumpy road to reach normal levels by April 2014.
The abnormally low sunspot numbers will likely have some
sort of effect on the Earth … take home message is that we
are more prone to a chilly winter with sunspots projected to
drop than a warm one. Andrew 6-14-14

                                              Sept 9, 2013 - the
                                             sun, which should
                                             be at SOLAR MAX,
                                                is sporting a
                                               measly 24
                                                sunspot
                                             number (150 is
                                             more typical):

           Years 2000 to 2018
Current Research
2014 Fall Reservoir Carryover Storage
Oct 1, 2013 Storage: 8 Upper Snake Reservoirs 23% full, 50% of average
Jan 1, 2014 Storage: 8 Upper Snake Reservoirs 36% full, 63% of average
864
KAF
2
0
1
4
Palisades Reservoir & Jackson Lake Combined
Storage and rank from low to high since 1958
Year   oct     nov     dec     jan     feb     mar
2004   362.0   451.0   542.0   621.0   686.0   793.0   Oct Nov Dec
2002   436.0   510.0   576.0   635.0   681.0   743.0   5th lowest since 1958
1989   401.0   515.0   602.0   689.0   761.0   889.0
1993   463.0   515.0   570.0   622.0   663.0   735.0   Jan Feb Mar
2005   414.0   520.0   616.0   704.0   774.0   864.0   4th lowest since 1958
2014   491.8   564.9   621.2   683.0   760.4   864.4

1978   527.0   594.0   695.0   773.0   829.0   813.0
2003   545.0   620.0   689.0   763.0   829.0   924.0
2008   525.0   638.0   734.0   822.0   902.0   989.0
Ranking of Jan 1, 2014 Reservoir Storage since 1955:

      Little Wood        2nd lowest (since 1956)
             Owyhee      4th lowest
Palisades & Jackson      4th lowest (since 1958)
      Salmon Falls       8th lowest
      Boise System      15th lowest
             Magic      20th lowest
             Mackay     21st lowest
             Oakley     29th lowest
Past Research & Examples of
Recent Climate Variability
By Tom Pagano who was at
USDA NRCS NWCC in PDX
Long-term Trends in
Water Supply Forecast Skill
Are there any long-term trends
in April 1st water supply forecast skill?
If so, where, when and why?Average skill for all forecasts over 20-yr moving
window for the West, as a whole.
April 1 forecast skill peaked around 1985 then
slumped afterwards
Good
BadWhere is spring
1961-80 1981-00 precipitation
more irregular?
Now, especially in
PNW & Southwest,
whereas before it
was very calm
This matches
Calm Typical Extreme decline
in forecast skill20-year moving
window
Spring precipitation
Westwide average of 29 basins “irregularity”
>1
Extreme
more extreme
than usualThe question is: Will trend
continue?
Yellowstone & or
Lowman Fires
return to normal?
Based on data since
mid 2000s, seems
like trend is
continuing……Recent Climate Variability – normal monthly precipitation
Nov - Mar
precipitation normally
accounts for 57-67% of
annual precipitation2010 Apr-Jun Precipitation ~ 20 stations received record high amounts Nov-Mar Precipitation ~90 of 115 sites were 1st-5th driest
2011: Snow Water Equivalent Two Ocean Plateau
SNOTEL in Yellowstone NP, Elevation 9,240 feet

              1974 was last strong La Nina
              deposited a snowpack that
              was 184% of median in
              Salmon River basin
              Each event sets up
              different
NRCS Snow School Lake Tahoe Jan 13, 2012 A week later major storms came into the West…
Jan 2012 Owyhee Basin 7 Station Snow Index were Record Low

                                                 Tim Link UofI
                                                 research that
                                                more of winter
                                               annual moisture
                                                  is coming in
                                               fewer but bigger
                                                     storms
Climate Variability --- Spring 2012 Idaho Water Supply Reports:
March 2012
Snowmelt started melting two weeks earlier than normal this March at some
SNOTEL sites. …. warm storms producing new March precipitation records at 25
SNOTEL sites. Rain produced snowmelt at mid-elevation stations across the state.
April 2012
Record April temperatures reaching 90 F in the valleys and 70 F in the mountains…
1-2 inches of rain on April 26 increased streams to record high levels for this time of
year. Using long term valley weather station data as a gauge, this heat wave was
likely the hottest in April since 1875.
Water Year 2012
Streamflow Boise River
near Twin Springs2013 WOOD and LOST RIVER BASINS
Oct - Dec precipitation was 2nd wettest in the last 30 years at three
SNOTEL sites making it one of the best starts on record.
January 1 snowpacks were 130-160%.
BUT gave way to record low Jan-Apr SWE increases
Thanksgiving at
Galena Summit2013 Precip
Jan-Mar
California had it’s
driest start to a
calendar year since
at least 1895.
Dry record extends
up the coast range
of Oregon and
eastern slopes of
the Cascades.
From
John Abatzoglou
University of Idaho, April
7, 2013 email3rd Annual Pacific Northwest
Climate Science Conference,
1-2 October 2012
Boise, Idaho
3-day Max Temp
Climate Variability
Climate variability of the PNW
Nick Bond, UofW JISAO
Need to look at when event
occurs: 3-day Min Temp
• If outside snowmelt season -
- becomes a non-event
• If during snowmelt season 200 = July 18
- what are impacts?Troy Magney paper – Spatial and Seasonal Changes in Idaho’s
Max Daily Prec Events: Implications for Ag
• Observed warming
has led to an
intensification of the
largest precipitation
events, primarily in
spring/summer₂
More
Recent
ResearchFeb 2014 wind pattern In contrast to the January blocking ridge, a very strong jet stream allowed for the parade of weather systems to impact the PNW.
Setting the Stage for Winter 2013-2014   Natural Cycles – rate of
                                         change might be key to
                                          better understand…

                                                  New Volcanic Island
                                                 near Japan Nov 2013
2014
1981 - 2010 Avg
2013
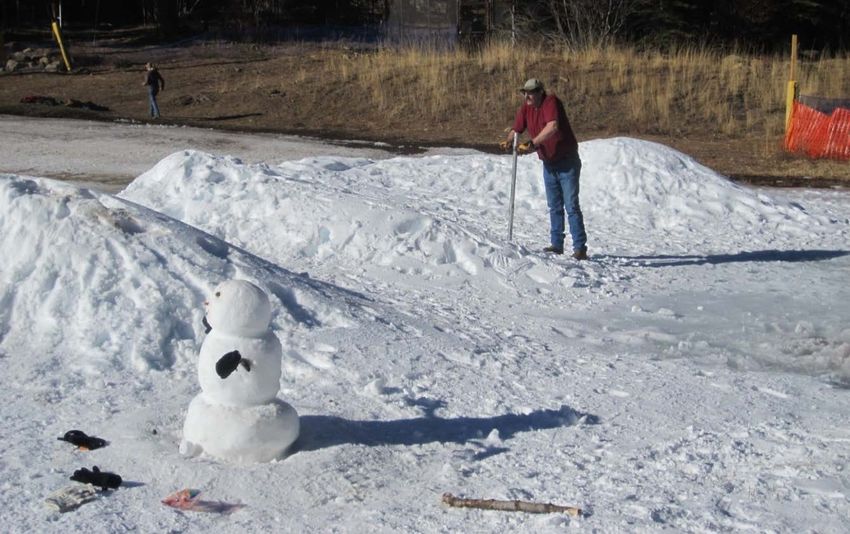
2012Winter 2013-2014 What Happened?
Think Snow!!
Boulder Mountains near Sun Valley , looking SE from Hwy
93 South of Galena Lodge after Major Snow, Rain & Wind
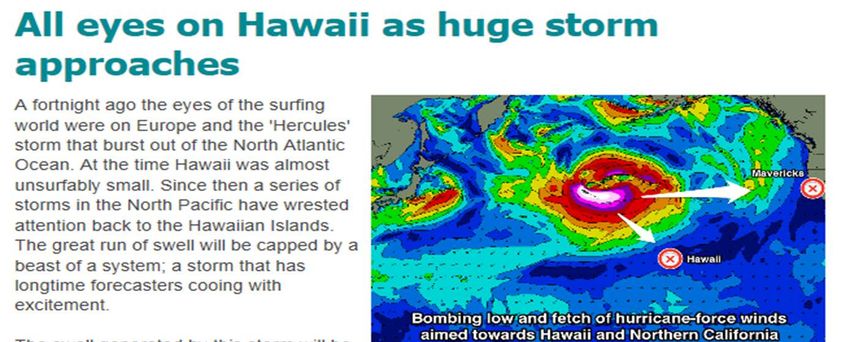
Event January 11-14, 2014Surf’s Up
Jan 22, 2014
30-40 (60-80) foot
waves & erratic winds
cancel Hawaii Surfing
EventAnother Signal of What Might be Expected Soon: Jan 14 2014 daily SOI (Southern Oscillation Index) value was above 50, and the pressure at Darwin was at 998mb for 2nd consecutive day. A reading of a 50 does not occur often, based on 23 years of record. Here are FEW times the SOI daily number has been in the mid 40’s or above and events that followed: • Jan 14/15 2014: (44.17, 50.71)... ??? Abundant Moisture Feb/Mar 2014 • Dec 25 2011: (49.20) ..... Snowstorm/Arctic Blast Jan 14, 2012 • Jan 17/18 2011: (50.87, 55.43)..... Snow/Arctic Blast Feb 24, 2011 • Dec 22/23 2003: (44.34, 44.34).... Snow/Arctic Blast Jan 2, 2004 • Dec 4/5 2000: (49.61, 47.14)..... Modified Arctic air Dec 10-15, 2000 • Dec 11/12 1998: (51.02, 49.60)….. Major Arctic Blast Dec 19, 1998 It’s no fool proof method, but is now showing agreement with models
The PNA is getting interestingly negative:

Pacific North American Index is one parameter
(index) that helps for moisture in the PAC NW
   but there are others that are needed too.
February SWE Increase:

Lewis Lake Divide
SNOTEL had 5th highest
February increase since
records start in 1919
Another annual winter cycle each season….
The gist of the LRC involves a cycling weather pattern that develops in
October and November of each year; no pattern is the same from year to
year.

Around mid November, the LRC begins to repeat, meaning we start to see
a similar weather pattern in mid November that we saw in early October.

This means that the cycling pattern has begun, and it will continue to
cycle on a regular, somewhat-unchanging 40-60 day interval for the next
~10 months before it dissipates over the following summer.

This season, the length of the LRC has been pegged at 57 days. If we take
the January 6th date and move ahead ~57 days, we arrive in the
timeframe of late February, a couple of days within the very cold weather
the GFS Ensembles showed…

- See more at:
  http://theweathercentre.blogspot.com/#sthash.esb9EIRD.dpuf
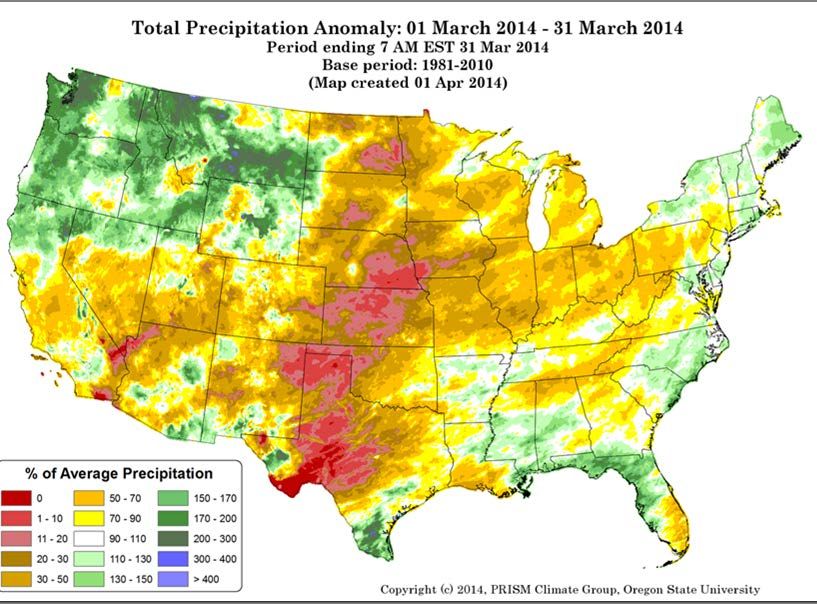
Precipitation in 1st half of March was still above average –
       people were asking how long can this last….
From March 19, 2014 talk • Long range and short range forecasts are not showing strong signals, the confidence in the forecasts are low…. • Persistence is still best forecast and wins in these types of weather patterns and what you see in your area is what you will continue to have until a different weather pattern sets in.
May 25, 2014 Oregon
Andrew’s -- Preliminary 2014-2015 Winter Forecast                     Summary
 Posted: 14 Jun 2014 03:26 PM PDT
 "Another Cold Winter May Be Brewing..."                                  First
       Temperature                                         Precipitation
                                     Analog Years
                                     Dec-Feb
                                     1986-1987
                                     2009-2010
                                     1981-1982
                                     1983-1984

The Forecast      What Can We Expect This Winter?
It's too early to make maps for this upcoming winter, but we have an abundance of
hints we can use for some early forecasting.

For the Pacific Northwest: A warmer than normal winter with around
average precipitation is currently favored, due to the state of the
Pacific Ocean and choice analog year. Snowfall is projected to be
slightly above normal.
There are four specific items I want to review that are pointing towards this cold winter idea. 1. El Nino It's been discussed countless times already by countless weather agencies and enthusiasts, but we'll discuss it again here. The anomalously warm waters appearing west of Ecuador, nicknamed the El Nino phenomenon, look to be a crucial piece to this puzzle indicating a chilly winter ahead. In typical El Nino situations, we tend to see warm weather confined to the North and West US regions, while cool anomalies prevail in the South and East. Considering the El Nino retains the highest confidence for still being present in the coming winter, confidence in a cooler than normal winter for the aforementioned regions rises in response. 2. Cooler than Normal West Pacific This factor doesn't constitute an oscillation or index, per se, but will likely play into what we see happen this winter. The past cold season, I based the majority of my long range posts off of storms I was seeing hit Japan, based on the Typhoon Rule popularized by Joe Renken. It only takes a simple understanding of the relationship between high/low pressure patterns and sea surface anomalies to recognize what this means. The presence of below normal water temperatures extending eastward from Japan could very well mean that we see a stormy pattern over Japan this winter. Translating that through the Typhoon Rule, it means that the prospects of a stormy (and consequentially cooler) winter are enhanced. 3. Positive Water Temperature Anomalies in the Gulf of Alaska In addition to the waters off Ecuador, the Gulf of Alaska is also experiencing above normal water temperatures. However, the placement of this particular body of warm water is key. Last winter, well above normal water temperature anomalies in the Northeast Pacific resulted in consistent high pressure along the West Coast, which provoked the polar vortex and incredibly cold air to push south, affecting much of the United States in the process. Barring any significant changes this summer and fall, a similar situation could unfold this next cold season. Andrew
4. AMO
The Atlantic Multidecadal Oscillation (AMO) is the wild card this
winter.

In recent months, it has reversed from its positive phase, which
appears as warm waters along the coast of Greenland and into the
Arctic Circle, into its negative phase, which features cold water
temperatures in those same areas.

If warm water holds out, we can expect increased probabilities of high
pressure being sustained over Greenland, which would buckle the jet
stream to the south and allow for cold air to penetrate deep into the
Eastern US.

Again, however, this is the wild card, and we likely won't know if this
will happen for another handful of months.

Andrew
Our weather is
                                  always changing to
                                   form our climate.

                                  Key is figuring it out
                                  to better understand
Questions/Comments/ Corrections    the driving forces &
                                     relationships to
                                        make better
                                  decisions to mitigate
                                       impacts from
                                    climate variability
                                         increase.
Think Snow!!
You can also read