February 2021 ILLINOIS WATER AND CLIMATE SUMMARY - the Illinois State Water Survey
←
→
Page content transcription
If your browser does not render page correctly, please read the page content below
February 2021
ILLINOIS WATER AND CLIMATE SU MMARY

                                              FEBRUARY 2021 OVERVIEW
                                              Temperatures and precipitation were below the long-term average in
                                              Illinois in February. Aggregate statistics of mean streamflow statewide
                                              were not available for this month. Shallow groundwater levels were
                                              above the long-term depths.

                                                 Air temperatures statewide averaged 20.7°F in February, 10.2° below the
                                              long-term average (Figure 1). The southeast crop reporting district (CRD) was
                                              the warmest with an average of 27.7°F. The lowest regional average temperature
                                              was 13.8°F, reported by the northwest CRD. Departures from average ranged
                                              from 8.6° below average in the southeast CRD to 12.4° below average in the
                                              northwest CRD.
                                                 Precipitation statewide averaged 1.59 inches, 0.47 inches below the long-
                                              term average (Figure 1). The southeast CRD was the wettest with an average of
                                              3.01 inches. The driest was the northeast CRD with an average of 0.88 inches.
                                              Departures from average ranged from near average in the east-southeast CRD
                                              to 0.85 inches below average in the southwest CRD.
                                                 Monthly mean provisional streamflows were estimated to range from below
                                              normal to above normal for February. Aggregate statistics of mean provisional
                                              flow statewide were not available for February 2021 due to persistent frozen
                                              conditions at many streamgage stations.
                                                 Water surface levels at the end of February were below the full pool or
                                              target level at 6 of 25 reporting reservoirs. At the end of February, Lake
                                              Shelbyville was 1.6 feet above the winter target level, Carlyle Lake was 1.5 feet
                                              above the winter target level, and Rend Lake was 4.5 feet above the spillway
                                              level. Lake Michigan’s mean level was above its long-term mean for the month.
                                                 Shallow groundwater levels statewide were above the long-term average
                                              this month with an average departure of 0.37 feet above the period of record
                                              (Figure 1). Levels averaged 1.11 feet above January 2021 and 1.48 feet below
                                              February 2020 levels.

Figure 1. Statewide departures from normal.

W AT E R A N D AT M O S P H E R I C R E S O U R C E S M O N I T O R I N G P R O G R A M                  Contact Kevin Grady
                                                                                                              (217) 300 -8342
 W W W. I S WS . I L L I N O I S . E D U/ WA R M
                                                                                                        kagrady2@illinois.edu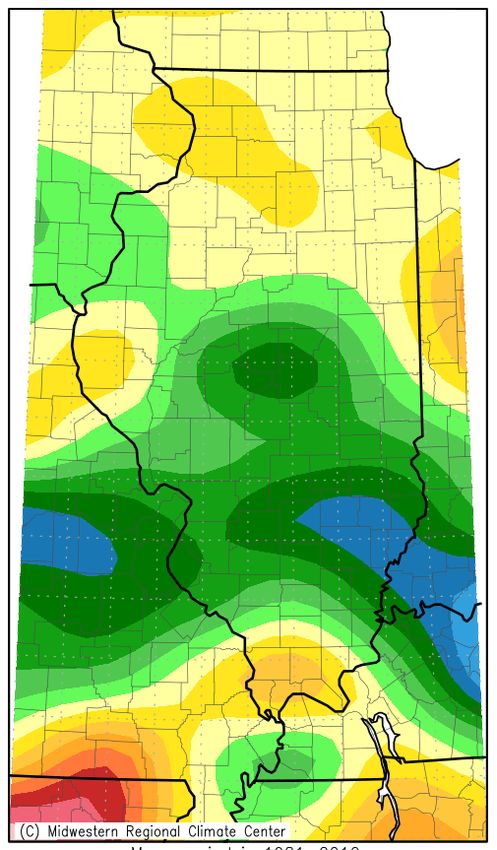
Weather/Climate Information AVERAGE TEMPERATURE (°F)
Feb 1, 2021 to Feb 28, 2021 Departure from average
— K E VI N G R ADY
The following description of temperatures,
precipitation, snow, severe weather, and drought
comes from data compiled by networks that report to
the National Oceanic and Atmospheric Administration
(NOAA). These data are provisional and may change
slightly over time.
February in Illinois was much colder and drier than
average across most of the state.
Temperatures averaged 20.7°F, 10.2° below the long-term
average (Table 1a, Figure 2), making February 2021 the 11th
coldest February on record in Illinois back to 1895. The most
recent years with February temperatures this low in Illinois were ACCUMULATED PRECIPITATION (IN)
2014 and 2015, both of which had statewide average February Feb 1, 2021 to Feb 28, 2021 Departure from average
temperatures of 19.4°F (11.5° below average). February 2021
also breaks a streak of three months in a row with well-above
average temperatures in Illinois, as statewide averages in
November, December, and January were each at least 3° above
average. Monthly average temperatures in February 2021
ranged from the lower teens in northern Illinois to the upper
20s in southern Illinois. Departures from average ranged from
around 8° below average in parts of southeastern Illinois to over
12° below average in northwestern Illinois.
Temperatures the first week of February were relatively
close to average across most of Illinois after a generally close-
to-average end of January. However, temperatures plummeted
statewide around the first weekend of the month and remained
well below average for the next two weeks. During the two-
week period on February 7–20, temperatures ranged from 18°
below average in eastern Illinois to around 25° below average
in western Illinois. Temperatures averaged in the single digits
in northern Illinois and in the teens in southern Illinois during ACCUMULATED SNOW (IN)
this time. All stations in Illinois recorded their monthly minimum Feb 1, 2021 to Feb 28, 2021 Departure from average
temperatures during this period, ranging from around -20°
in northwestern Illinois to around 0° in southern Illinois. The
coldest reading of the month, -21°F, was recorded at a station
near Mount Carroll (Carroll County) on February 7 and a station
near Altona (Knox County) on February 8.
After this bitterly cold period, temperatures then warmed
up for the last week of the month. On February 22–28,
temperatures were generally 3–7° above average across most
of Illinois, helping to offset some of the earlier extreme cold in
the monthly statistics. Nearly all stations recorded their monthly
maximum temperatures during this week, many on February
28, generally ranging from the mid-40s in northern Illinois to
the mid-60s in southern Illinois. The warmest reading of the
month, 69°F, was recorded at a station in Alexander County on
February 24.
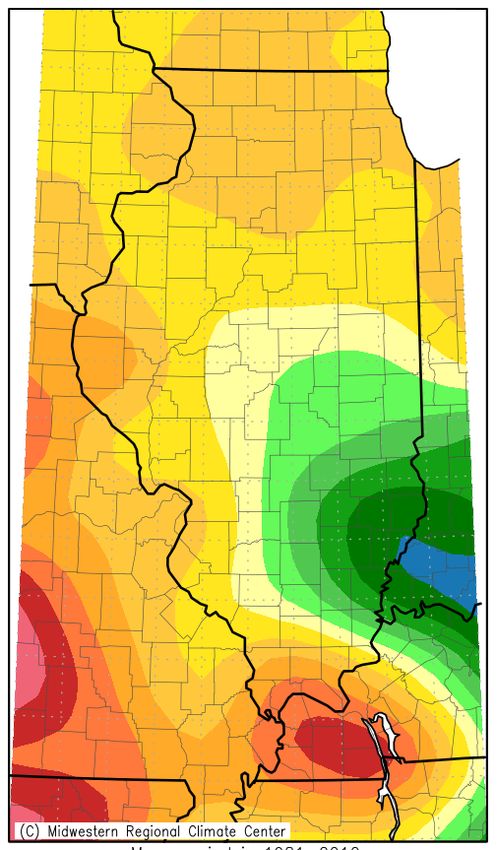
Precipitation averaged 1.59 inches in February, 0.47 inches
below the long-term average (Table 1a, Figure 2). Monthly
Figure 2. Illinois temperature, precipitation, snow and their
totals generally ranged from less than an inch in parts of
departures from average for February 2021. Source: cli-MATE,
northern Illinois to over 3 inches in parts of southeastern
Midwestern Regional Climate Center. https://mrcc.illinois.edu/
Illinois. Due to the cold temperatures, much of the precipitation
CLIMATE. Information accessed on March 8, 2021.
— PAG E 2 —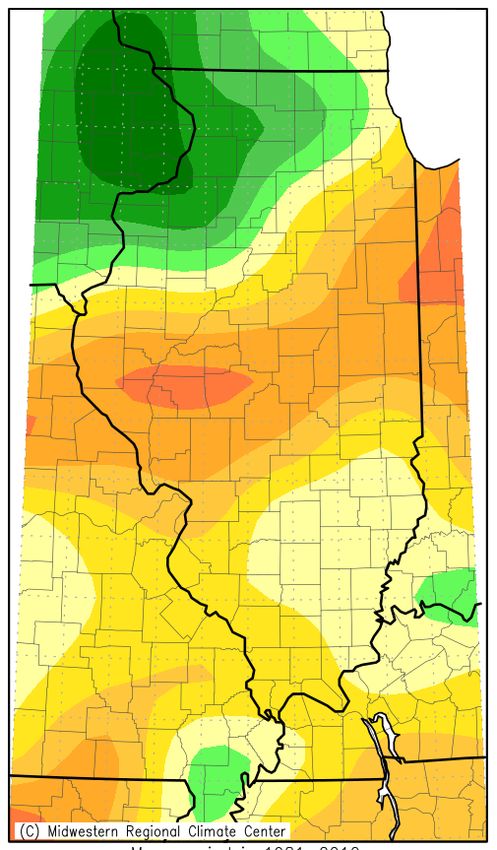
that fell in February in Illinois was snow. However, a notable      Table 1a. Temperature and Precipitation for February 2021
rain event occurred the last weekend of February across
much of central and southern Illinois, with most areas along                                             Departure                      Departure
                                                                                                         from long-                     from long-
and to the south of I-72 receiving at least half an inch of rain
                                                                                                  Temp. term avg.           Precip.      term avg.
and areas generally along and to the east of I-57 in this area                                     (°F) (1981–2010)           (in)     (1981–2010)
receiving an inch or more. This event helped an area centered
                                                                     Illinois                      20.7       ‑10.2           1.59        ‑0.47
around the I-64 corridor in the eastern part of the state to
                                                                     CRD 1 (northwest)             13.8       ‑12.4           0.92        ‑0.62
finish February with above average precipitation by up to an
                                                                     CRD 2 (northeast)             16.9       ‑10.2           0.88        ‑0.73
inch, especially near the Indiana border. Most of the rest of
                                                                     CRD 3 (west)                  18.6       ‑11.0           1.10        ‑0.67
Illinois received near or below average precipitation generally
                                                                     CRD 4 (central)               19.5       ‑10.0           1.39        ‑0.42
up to half an inch or more below average in February,
                                                                     CRD 5 (east)                  19.3       ‑10.0           1.30        ‑0.53
especially in northern, west central, and far southern Illinois.
                                                                     CRD 6 (west southwest)        22.3       ‑10.5           1.62        ‑0.44
A station near New Burnside (Johnson County) had the
                                                                     CRD 7 (east southeast)        23.6         ‑9.3          2.35          0.00
highest monthly total of 5.24 inches.
                                                                     CRD 8 (southwest)             26.8         ‑9.6          1.95        ‑0.85
     Snow: In February, nearly every part of Illinois received at    CRD 9 (southeast)             27.7         ‑8.6          3.01        ‑0.08
least 10 inches of snow for the month (Figure 2). The heaviest
totals were around Chicago and the area to its south, where
monthly totals of around 18 inches were common with higher
                                                                    Table 1b. Temperature and Precipitation for Winter (Dec-Feb) 2020/2021
amounts possible locally. There were many stations around
Cook County that recorded over 2 feet of snow for February,                                              Departure                      Departure
with the highest monthly total of 33.7 inches recorded at a                                              from long-                     from long-
station near Oak Park (Cook County). Another one of the                                           Temp. term avg.           Precip.      term avg.
                                                                                                   (°F) (1981–2010)           (in)     (1981–2010)
snowiest areas was in southeastern Illinois around the I-64
corridor near the Indiana border, where totals of around             Illinois                      27.7         ‑1.3          5.74        ‑1.08
16 inches were common. Every part of the state was much              CRD 1 (northwest)             22.6         ‑1.7          4.77        ‑0.23
snowier than average, with most of Illinois receiving more           CRD 2 (northeast)             24.7         ‑0.7          4.47        ‑1.01
than half a foot of snow above average in February. The              CRD 3 (west)                  26.0         ‑1.7          4.82        ‑0.81
highest departures were in eastern Illinois with some areas          CRD 4 (central)               26.6         ‑1.0          5.25        ‑0.89
of northeastern and southeastern Illinois receiving closer to a      CRD 5 (east)                  26.6         ‑0.9          4.88        ‑1.40
foot above average.                                                  CRD 6 (west southwest)        29.0         ‑1.7          5.60        ‑1.20
     These large totals were the result of snow falling              CRD 7 (east southeast)        29.9         ‑1.2          6.83        ‑1.05
frequently across the entire state the first three weeks of          CRD 8 (southwest)             32.6         ‑1.7          7.11        ‑1.96
February. The position of the winter storm track across              CRD 9 (southeast)             33.1         ‑1.3          8.51        ‑1.51
Illinois brought multiple heavy snow events to the state as         Data from NOAA’s National Centers for Environmental Information, accessed 3/8/2021.

temperatures fell much below average. One of the largest
events occurred February 14–16 when most areas to the
east of the Illinois River received 5–10 inches of snow. Some        of the Illinois River. This included a corridor of moderate
stations in Cook County recorded around a foot or more of            drought (D1) along and to the north of the I-72 corridor from
snow from this event. A significant warm-up occurred during          Sangamon and Logan counties east-northeast to Iroquois
the last week of the month, so only northernmost Illinois            and Vermilion Counties, covering about 7% of the state.
received measurable snow that week.                                       Winter (December-February) was colder than average
     Severe weather reports: The NOAA Storm Prediction               across most of Illinois. Seasonal temperatures averaged
Center (SPC) did not record any severe weather reports for           27.7°F statewide, 1.3° below the long-term average (Table
February in Illinois. Thus, there were no severe weather reports     1b), ranging from the lower 20s in northwestern Illinois to
in Illinois for the entire winter season (December–February).        the mid-30s in southern Illinois. For most of the state this
     Drought: Drought and abnormally dry conditions                  was about 1–2° below average. Winter started much warmer
persisted in some areas of central Illinois throughout               than average in Illinois, with both the December and January
February. However, the month began with improvements in              statewide average temperatures around 3° above average.
conditions in the area following late January storms. In their       However, the extreme cold in the middle of February that
first couple of maps for February, the United States Drought         was 18–25° below average more than offset these earlier
Monitor reduced the areas of abnormal dryness (D0) and               warmer temperatures, resulting in winter overall being colder
moderate drought (D1) in central Illinois in response to these       than average across Illinois. Nearly all stations recorded their
improving conditions. This also included the removal of an           seasonal lows during this February period, ranging from
area of severe drought (D2) centered in Logan County that            around -20° in northwestern Illinois to around 0° in southern
had persisted since mid-November. The cold and snow led              Illinois, as February ended as the 11th coldest February on
to few changes in drought conditions later in the month,             record in Illinois.
resulting in no changes to the later February drought maps                Winter precipitation averaged 5.74 inches statewide,
from the earlier ones. On the February 23 United States              1.08 inches below average (Table 1b, Figure 3). Seasonal
Drought Monitor Map (Figure 4), about 26% of Illinois was            precipitation totals ranged from around 4 inches in
classified as D0 or worse, mostly in central Illinois east           northwestern Illinois to around 10 inches in far southern

                                                             — PAG E 3 —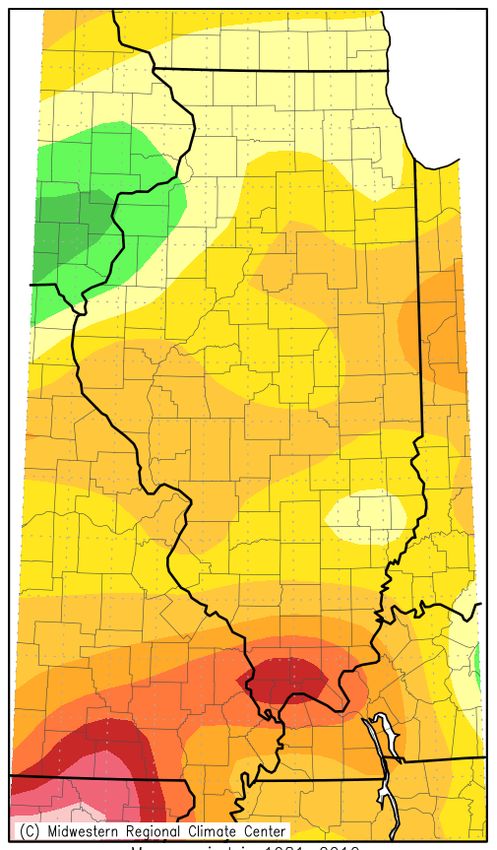
Illinois. The highest seasonal total was 10.98 inches at a                Winter snowfall totals ranged from around a foot in
station near New Burnside (Johnson County). These totals             southern Illinois and near St. Louis to over 3 feet in northern
were below average across most of the state, including               Illinois (Figure 3). Even higher local amounts were common
central Illinois where totals were often an inch below               around Chicago, with the largest seasonal total of 57.2
average. An area of moderate drought (D1) persisted                  inches recorded at a station near Oak Park (Cook County).
in central Illinois along the I-72 corridor throughout the           These totals were above average across most of the state,
winter, including an area of severe drought (D2) centered            with the highest departures in northern Illinois and parts
in southern Logan County through the end of January. Far             of southeastern Illinois, where totals were around a foot
southern Illinois was also drier than average for the season         above average for the season. Departures in central Illinois
by 2–3 inches in some areas. Northern Illinois was closer            were generally up to around half a foot above average.
to average, with a small area near the Quad Cities slightly          December snow totals were well below average outside of
wetter than average. December and February were both                 northwestern Illinois. January totals were well above average
drier than average across most of the state. January was             in far northern Illinois while more moderate to below average
largely drier than average too until a series of storms near         farther south. However, a very snowy February across the
the end of the month helped push monthly totals slightly             entire state helped push seasonal totals well above average
above average across most of Illinois.                               across most of Illinois.

         ACCUMULATED PRECIPITATION (IN)                                         ACCUMULATED PRECIPITATION (IN)
Dec 1, 2020 to Feb 28, 2021     Departure from average                Sep 1, 2020 to Feb 28, 2021      Departure from average

         ACCUMULATED PRECIPITATION (IN)                                              ACCUMULATED SNOW (IN)
Jan 1, 2021 to Feb 28, 2021     Departure from average                Dec 1, 2020 to Feb 28, 2021      Departure from average

Figure 3. Illinois precipitation and precipitation departure from average for last 3 months (top left), last 6 months (top right),
year-to-date (bottom left), and snow and snow departure from average for the last 3 months (bottom right) Source: cli-MATE, Midwestern
Regional Climate Center. https://mrcc.illinois.edu/CLIMATE. Information accessed on March 8, 2021.

                                                           — PAG E 4 —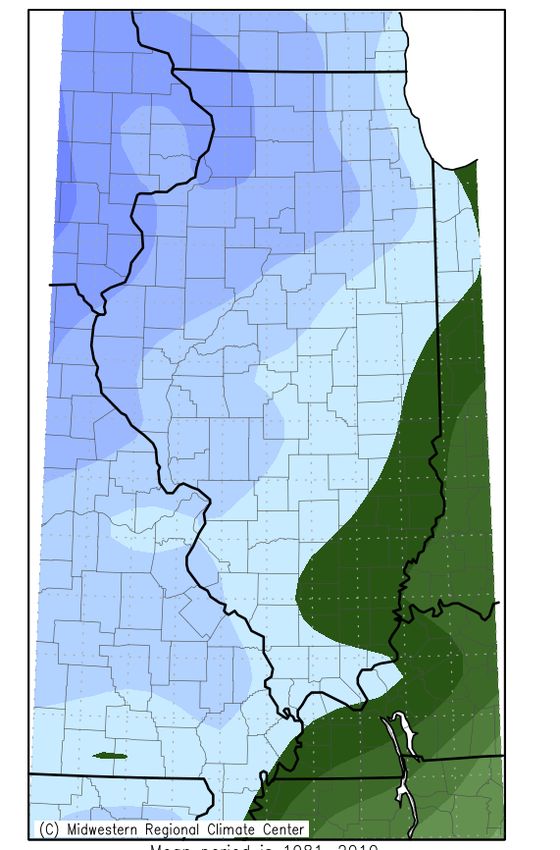
Illinois
(Released Thursday, Feb. 25, 2021)
Valid 7 a.m. EST
Drought Conditions (Percent Area)
None D0 D1 D2 D3 D4
Illinois Climate Network (ICN)
Current 74.32 18.31 7.37 0.00 0.00 0.00
U.S. Drought Monitor March 26,
— J2019
E N NLast
I EWeekA T 74.32
K I N18.31
S
Illinois
7.37 0.00 0.00 0.00
(Released Thursday, Mar. 28, 2019)
02-16-2021
Valid 8 a.m. EDT 3 Months Ago
49.78 37.68 10.86 1.68 0.00 0.00
11-24-2020
The Illinois Climate Network (ICN) collects hourly
Drought Conditions (Percent
Start of Area)
Calendar Year 54.89 28.75 14.34 2.02 0.00 0.00
None D0-D4 D1-D4 D2-D4 D3-D4
12-29-2020 D4
weather Start
and of soil information from 19 stations across
Current 83.87 16.13 2.06 Water 0.00
0.00 Year 42.28
0.00 54.03 3.69 0.00 0.00 0.00
09-29-2020
Last Week
the state. ICN data for February are presented in
One Year Ago
80.73 19.27 2.06 0.00 0.00 100.00
0.00 0.00 0.00 0.00 0.00 0.00
02-25-2020
06-19-2018
Table 2.
3 Months Ago
99.40 0.60 0.00
Intensity:
0.00 0.00 0.00
03-27-2018
None D2 Severe Drought
March 26, 2019
Start of
Calendar Year 51.40 48.60
Wind speeds
16.19 1.18 D00.00
increased
Abnormally
0.00 Dry
in D3 Extreme Drought
01-02-2018
Start of
February toD1aModerate monthly Droughtaverage D4ofExceptional Drought
(Released Thursday, Mar. 28, 2019) Water Year
09-26-2017
7.7 mph,The0.8
7.40 92.60 12.84 0.00 mph
0.00
Drought higher
0.00
Monitor focuses on than
broad-scale conditions.
Local conditions may vary. For more information on the
Valid 8 a.m. EDT One Year Ago in January
86.53 13.47 0.00 0.00
but
Drought
0.00
0.6go mph
Monitor, to https://droughtmonitor.unl.edu/About.aspx
0.00
06-27-2017
less than the network’s
Author:
Drought Conditions (Percent Intensity: Area) long-term Davidaverage.
Miskus ICN
NOAA/NWS/NCEP/CPC
D0 Abnormally Dry Stelle was the Drought
D3 Extreme windiest
None D0-D4 D1-D4 D2-D4 D3-D4 D1D4 stationD4of
Moderate Drought Exceptional Drought
the month
D2 Severe Drought
with both the highest
The Drought Monitor focuses on broad-scale conditions.
Current 83.87 16.13 2.06 0.00 0.00 0.00 may vary. See
Local conditions average at text
accompanying 11.5summary
mph
for forecast statements. droughtmonitor.unl.edu
Last Week
February 23, 2021 and the highest
reported wind gust of
80.73 Thursday,
19.27 2.06 Author:0.00
(Released Feb. 25,0.00
2021) 0.00
06-19-2018 Richard Heim 49.4 mph on February 4.
Valid 7 a.m. EST NCEI/NOAA
Air temperatures
3 Months Ago
99.40Drought 0.00 (Percent
0.60Conditions 0.00 Area)0.00 0.00 fell 8°F from January to a
03-27-2018
None D0 D1 D2 D3 D4 monthly average of 22°F, 10°
Start of below the long-term average.
Current 51.40
Calendar Year 74.32 48.60 16.190.001.18
18.31 7.37 0.00 0.00
0.00 0.00
http://droughtmonitor.unl.edu/
01-02-2018
All stations reported minimum
temperatures below 0° as cold
Start of
Last Week
74.32 18.31 7.37 0.00 0.00 0.00
Water Year02-16-2021
7.40 92.60 12.84 0.00 0.00 0.00 weather blanketed the state in the
09-26-2017
3 Months Ago middle of the month. The network’s
49.78 37.68 10.86 1.68 0.00 0.00
One Year Ago
11-24-2020 lowest recorded temperature was
Start of 86.53 13.47 0.00 0.00 0.00 0.00 -18.5°F, reported at ICN Freeport on
06-27-2017
Calendar Year 54.89 28.75 14.34 2.02 0.00 0.00
12-29-2020 February 7. Warmer weather moved into the state at the end of
Start of
the month, leading to highs from the 40s to the 60s. ICN Dixon
Intensity: Water Year 42.28 54.03 3.69 0.00 0.00 0.00
09-29-2020 Springs reported a daily maximum of 67°F on February 28, the
D0 Abnormally
One Year Ago Dry D3 Extreme Drought month’s highest.
100.00 0.00 0.00 0.00 0.00 0.00
02-25-2020
D1 Moderate Drought D4 Exceptional Drought Soil temperatures declined up to 2°F in February to
Intensity: averages in the mid-30s, 1° below the long-term average.
D2 Severe Drought Temperatures below freezing were reported at all depths, but
None D2 Severe Drought
The Drought Monitor focuses
D0 Abnormally Dry on broad-scale
D3 Extreme conditions.
Drought
the snow cover helped to keep soils warmer. Under bare soil,
Local conditions may vary. See accompanying text summary temperatures ranged from 25 to 66°F at the 2-inch depths and
D1 Moderate Drought D4 Exceptional Drought
for forecast statements. 26 to 56°F at 4 inches. Temperatures under sod ranged from 24
The Drought Monitor focuses on broad-scale conditions. to 53°F at 4 inches and 31 to 57°F at 8 inches.
Local conditions may vary. For more information on the
Drought Monitor, go to https://droughtmonitor.unl.edu/About.aspx Precipitation averaged 2.05 inches in February, 0.12 inches
Author:
above the long-term average. Southern Illinois had the highest
RichardAuthor:
Heim totals with a regional average of 3.33 inches, 1.42 inches of which
David Miskus
NCEI/NOAA fell on February 28. ICN Dixon Springs reported 4.66 inches, the
NOAA/NWS/NCEP/CPC
highest for the month.
Soil moisture data will return to the IWCS in Spring 2021.
droughtmonitor.unl.edu
http://droughtmonitor.unl.edu/
Figure 4. U.S. Drought Monitor report for Illinois. Source:
U.S. Drought Monitor. Author: David Miskus,
NOAA/NWS/NCEP/CPC
https://droughtmonitor.unl.edu, accessed on March 8, 2021.
— PAG E 5 —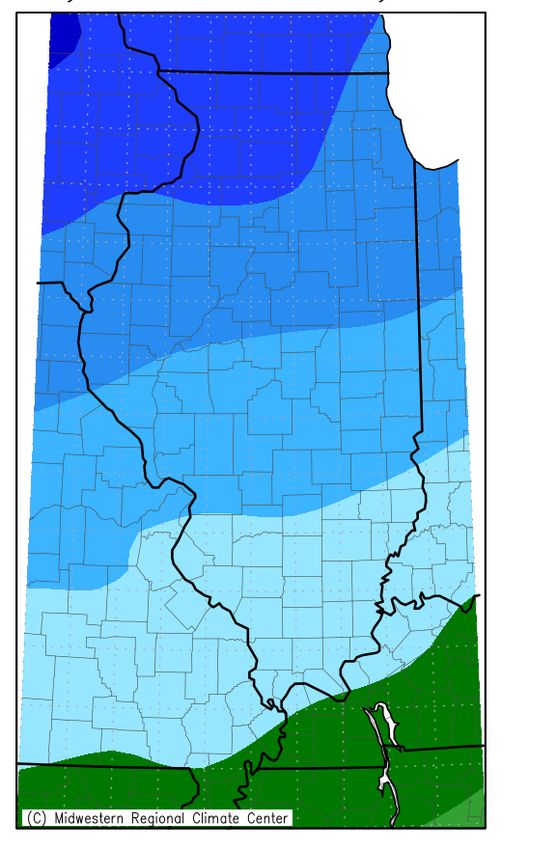
Table 2. Data from the Illinois Climate Network (ICN), February 2021
Wind Air Temperature (°F)
Total Solar
Station Avg. Speed (mph) Avg. Direction (°) Max. Gust (mph) Max. Min. Avg. Radiation (MJ/m2)
Belleville 9.1 192.8 35.8 61.8 –5.4 25.6 320..8
Big Bend 7.1 232.7 32.3 46.3 –16.6 14.5 320.0
Bondville 12.8 205.1 49.5 58.9 –10.1 20.5 337.0
Brownstown 8.6 183.7 38.2 59.8 –3.8 24.9 315.4
Carbondale 7.5 211.4 33.8 66.2 –4.6M 28.3 296.2
Champaign 6.1 207.2 34.2 59.4 –8.6 21.1 322.2
DeKalb 9.0 238.6 36.1 47.4 –15.1 13.5 373.6
Dixon Springs 5.4 182.2 30.1 66.9 –1.5 29.5 249.5
Fairfield 8.3 177.4 32.9 64.2 –2.4 26.9 334.0
Freeport 5.6 247.4 27.2 43.0 –18.5 13.3 306.4
Monmouth 10.9 222.7 39.8 55.9 –14.5 16.1 358.8
Olney 6.2 154.1 31.7 63.1 –7.1 26.7 328.9
Peoria 7.4 232.9 35.3 57.9 –10.3 18.8 321.3
Perry 6.6 222.5 33.0 59.4M –11.3 20.7 296.2
Rend Lake 5.7 197.0 29.0 66.5 –4.2 27.9 308.0
Snicarte 9.8 210.4 45.8 59.2 –13.2 20.6 318.9
Springfield 7.2 201.6 30.3 58.2 –5.8 21.8 306.2
St. Charles 6.5 225.8 39.7 49.1 –16.4 16.0 314.3
Stelle 11.5 246.6 49.4 54.4 –15.6 16.7 360.0
Table 2. continued
Average Soil Temperature (°F) at
Average
Relative Total Average Dew Total Potential 4" under 8" under 4" under 2" under
Station Humidity (%) Precip. (in) Point (°F) Evapotranspiration (in) Sod Sod Bare Soil Bare Soil
Belleville 73.9 1.72 18.1 1.50 35.0 35.6 35.5 35.0
Big Bend 80.4 1.08 9.4 0.99 32.1 31.9 33.3 31.8
Bondville 84.2 1.81 16.4 1.13 29.8 33.6 32.0 31.8
Brownstown 75.7 2.38 18.1 1.40 37.3 36.0 35.2 35.1
Carbondale 80.2 3.44 22.4 1.44 37.7 36.5 36.0 35.6
Champaign 82.1 2.21 16.3 1.22 33.3 34.2 33.9 33.7
DeKalb 82.4 0.62 9.1 1.07 33.1 32.0 33.7 32.6
Dixon Springs 77.3 4.66 22.7 1.27 36.3 37.5 35.4 37.1
Fairfield 78.9 3.16 20.9 1.45 37.3 37.7 37.5 38.3
Freeport 79.6 0.82 8.0 0.96 34.2 34.1 33.3 33.1
Monmouth 82.5 1.02 11.6 1.08 30.5 31.0 31.5 30.0
Olney 76.2 4.13 19.9 1.47 36.0 36.9M 37.6 37.3
Peoria 76.7 1.03 12.5 1.20 33.3 32.9 32.4 32.2
Perry 75.2 1.55 13.8 1.26 34.2 34.6 34.2 34.4
Rend Lake 74.2 3.80 20.3 1.51 36.4 37.4 39.2 37.0
Snicarte 78.3 1.31 14.7 1.24 32.9 33.5 32.6 32.8
Springfield 77.0 1.44 15.4 1.26 33.9 33.4 33.5 33.3
St. Charles 78.2 1.33 10.2 1.09 32.6 33.0 33.8 32.4
Stelle 83.1 0.95 12.4 1.07 32.6 32.7 31.9 31.3
M = Missing data.
— PAG E 6 —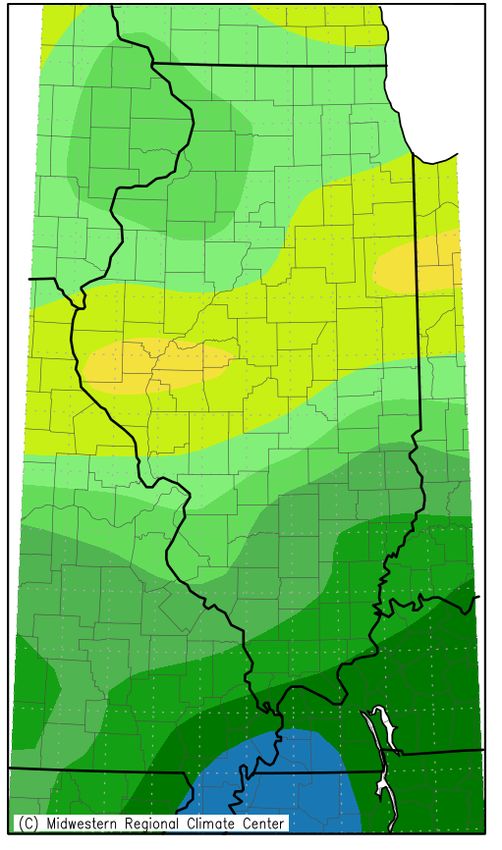
Surface Water Information                                                Compared to end-of-January water levels at 24 reservoirs for
                                                                     which levels were reported last month and this month, reported
— B I L L S AY L O R                                                 end-of-February water levels were lower at 4 reservoirs, higher
                                                                     at 16 reservoirs, and about the same as at the end of January at 4
    River and stream discharge and stage data are obtained           reservoirs. For the 25 reservoirs with measurements reported at
from gaging stations operated by the U.S. Geological Survey          the end of February, water levels were below normal target pool or
(USGS) or the U.S. Army Corps of Engineers (USACE). The              spillway level at 6 reservoirs, above normal target pool or spillway
USGS gaging station network is supported, in part, by the Illinois   level at 14 reservoirs, and at about full pool level at 5 reservoirs.
Department of Natural Resources Office of Water Resources,               Major Reservoirs. Compared to water levels at the end
the Illinois State Water Survey (ISWS), and the USACE.               of January, at the end of February the water level at Lake
Provisional discharge data are obtained from the USGS.               Shelbyville was 0.6 feet higher, Carlyle Lake was 0.3 feet higher,
    Table 3 lists the provisional peak stage for the current month   and Rend Lake was 1.2 feet higher. At the end of February, Lake
compared to flood stage at selected streamgaging stations            Shelbyville was 1.6 feet above the winter target level, Carlyle
located on the Illinois, Mississippi, and Ohio Rivers. Peak stage    Lake was 1.5 feet above the winter target level, and Rend Lake
is represented here by morning readings posted daily by the          was 4.5 feet above the spillway level.
USACE or the National Weather Service. Flood stage is defined            Great Lakes. Current month mean and end-of-month values
locally for each gage location.                                      are provisional and are relative to International Great Lakes
    Provisional monthly mean flows for this month for 26             Datum 1985. The February 2021 mean level for Lake Michigan
streamgaging stations located throughout Illinois are shown          was 580.7 feet. The monthly mean level one year ago (February
in Table 4, compared to statistics of past record of monthly         2020) was 581.5 feet. The long-term average lake level for
mean flows at those stations for the same month. Both                February is 578.4 feet, based on 1918-2020 data. In this period
recent and long-term data are retrieved from USGS online             of record, the lowest mean level for Lake Michigan for February
data services following the end of the month. Years of record        occurred in 1964 at 576.1 feet, and the highest mean level for
values in Table 4 represent the number of past monthly               February occurred in 2020 at 581.5 feet. The month-end level
values included in the Table 4 statistics; at some stations, the     of Lake Michigan was 580.6 feet. All values are provided by the
available record may not be continuous. Additional source            U.S. Army Corps of Engineers Detroit District.
data may be available from USGS.
    The statewide percent of historical mean flow and percent
of historical median flow are calculated by dividing the sum
of the average flows this month at stations in Table 4 by the
sum of the historical mean and median flows calculated for
the month, respectively, at the same stations. This method is
intended to weight individual observations proportionately in
the aggregate comparison. (The Illinois River and Rock River
stations are excluded from the statewide calculation because
other rivers listed in Table 4 contribute to their flow.)
                                                                     Table 3. Peak Stages for Major Rivers during February 2021
    Aggregate statistics of monthly mean provisional
streamflow statewide were not available for February 2021                                                          Flood          Peak
due to persistent frozen conditions at many streamgage                                                  River      stage          stage
stations, limiting the availability of reliable data (including      River            Station           mile*     (feet)*       (feet)**       Date
possibly at some Table 4 stations for which values are               Illinois         Morris            263.1        16            8.7             28
presented this month). From posted and estimated data,                                La Salle          224.7        20           16.2             28
monthly mean discharge values appeared to range from                                  Peoria            164.6        18           12.3             26
below normal to above normal for February.                                            Havana            119.6        14           11.2             28
    Water-Supply Lakes and Major Reservoirs. Table 5 lists                            Beardstown         88.6        14           10.0             24
reservoirs in Illinois, their normal pool or target water surface                     Hardin             21.5        25           20.9         25-28
elevation, and other data related to observed variations in          Mississippi      Dubuque           579.9        17            8.9         05-06
water surface elevations. Reservoir levels are obtained from a                        Keokuk            364.2        16            6.2             28
network of cooperating reservoir operators who are contacted                          Quincy            327.9        17           12.3             28
each month by ISWS staff for the current water levels. Reservoir                      Grafton           218.0        18           16.4             25
levels are reported in terms of their difference from normal                          St. Louis         180.0        30           13.2             01
pool (or target level). The average of the month-end readings                         Chester           109.9        27           17.6             02
for the period of record is reported in terms of the difference                       Thebes             43.7        33           22.2         02-03
from normal pool or target level (column 6 of Table 5), and          Ohio             Cairo                2.0       40           33.9             28
the number of years of record for each reservoir also is given
                                                                     Notes:
(column 7). Most reservoirs serve as public water supplies, with     * River mile and flood stage from River Stages in Illinois: Flood and Damage Data,
                                                                       Illinois Department of Natural Resources, Office of Water Resources, August 2004
the exceptions noted in the last column.                               (and Addendum, February 2007).
                                                                     **Peak stage based on daily a.m. readings, not instantaneous peak. Stage data
                                                                       obtained from U.S. Army Corps of Engineers.

                                                             — PAG E 7 —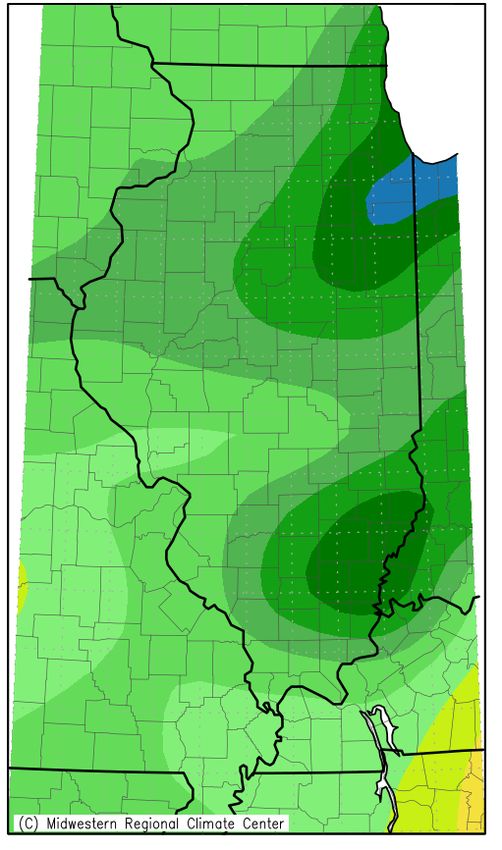
Table 4. Provisional Mean Flows, February 2021

                                                                                            Long-term flows*
                                               Drainage                      2021                                                           Percent     Days of
                                                 area       Years of        mean           Mean        Median                              chance of   data this
 Station                                        (sq mi)     record*       flow (cfs)       (cfs)        (cfs)         Flow condition      exceedence    month

 Rock River at Rockton                            6,363         81            5,389        4,221        3,533                   normal        33          28
 Rock River near Joslin                           9,549         81            8,733        7,045        5,877                   normal        33          28
 Pecatonica River at Freeport                     1,326        105             N/A         1,159          904                      N/A       N/A          N/A
 Green River near Geneseo                         1,003         84              711          804          711                   normal        50          24
 Edwards River near New Boston                      445         86             N/A           383          312                      N/A       N/A          N/A
 Kankakee River at Momence                        2,294        106             N/A         2,631        2,548                      N/A       N/A          N/A
 Iroquois River near Chebanse                     2,091         96             N/A         2,633        2,133                      N/A       N/A          N/A
 Fox River at Dayton                              2,642        106             N/A         2,184        1,940                   normal       N/A          N/A
 Vermilion River at Pontiac                         579         78              241          550          402                   normal        63          23
 Spoon River at Seville                           1,636        106            1,056        1,474        1,336                   normal        58          28
 LaMoine River at Ripley                          1,293         99              836        1,044          745                   normal        47          28
 Bear Creek near Marceline                          349         76             N/A           268          169                      N/A       N/A          N/A
 Mackinaw River near Congerville                    767         76            >600           683          535                   normal       N/A          23
 Salt Creek near Greenview                        1,804         79              624        1,745        1,352              below normal       73          28
 Sangamon River at Monticello                       550        109               99          604          444              below normal       86          28
 South Fork Sangamon near Rochester                 867         71            ~ 250          883          602                   normal        67          25
 Illinois River at Valley City                  26,743          82          13,236        25,615       24,400              below normal       73          28
 Macoupin Creek near Kane                           868         92             N/A           754          490                      N/A       N/A          N/A
 Vermilion River near Danville                    1,290         99             N/A         1,523        1,081                      N/A       N/A          N/A
 Kaskaskia River at Vandalia                      1,940         51             N/A         2,815        2,398                      N/A       N/A          N/A
 Shoal Creek near Breese                            735         78              910          902          588                   normal        41          28
 Embarras River at Ste. Marie                     1,516        109          < 1,900        1,960        1,609                   normal       N/A          14
 Skillet Fork at Wayne City                         464        103          < 1,100          667          511              above normal      N/A          14
 Little Wabash River below Clay City              1,131        106          < 2,100        1,549        1,183              above normal      N/A          19
 Big Muddy River at Plumfield                       794         49            1,078        1,077        1,077                   normal        49          27
 Cache River at Forman                              244         98            < 550          506          433                   normal       N/A          16

Notes:
Source streamflow data are obtained from the U.S. Geological Survey.
N/A = not available (e.g., due to ice or equipment problems).

Much below normal flow = 90-100% chance of exceedance.
Below normal flow = 70-90% chance of exceedance.
Normal flow = 30-70% chance of exceedance.
Above normal flow = 10-30% chance of exceedance.
Much above normal flow = 0-10% chance of exceedance.
*As calculated from past monthly mean flow values retrieved from U.S. Geological Survey (USGS) data services this month.
Note: Several stations affected by ice in February.

                                                                             — PAG E 8 —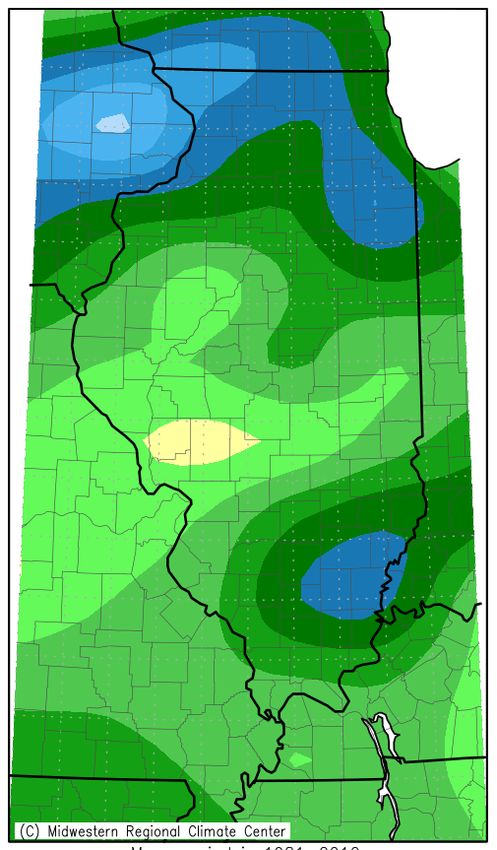
Table 5. Reservoir Levels in Illinois, February 2021

                                                                                                                  Average
                                              Normal pool           Current level            Monthly          difference from                      January reported
                                                or target          difference from           change              normal or              Years of           pumpage
Reservoir                  County              level (feet)       normal or target)           (feet)            target (feet)            record     (million gallons)
Altamont                   Effingham               582.0                 +0.4                    0.0                –1.1                    37                    5.6
Bloomington                McLean                  719.5                 +0.2                  +3.5                 –0.9                    34                   N/A
Carlinville                Macoupin                571.1                  0.0                  –0.1                 –0.2                    35                  25.1
Carlyle(1)                 Clinton                 443.0                 +1.5                  +0.3                 +1.8                    43                   N/A
Decatur(1,3)               Macon                   612.5                 +0.7                  +2.0                 +0.4                    37               1,014.4
Evergreen(4)               Woodford                720.0                 –1.0                  +2.0                 –1.2                    30                   N/A
Glenn Shoals(2)            Montgomery              590.0                 +1.3                  +1.3                 +0.1                    26          w/Hillsboro
Highland                   Madison                 500.0                 +1.3                   0.0                 +0.1                    32                  27.7
Hillsboro(2)               Montgomery              589.0                  N/A                   N/A                 +0.1                    24                  36.7
Jacksonville(2)            Morgan                  644.0                  N/A                   N/A                 –0.4                    17     w/Mauvaise Terre
Kinkaid                    Jackson                 420.0                 +0.5                  +0.2                  0.0                    32                  48.6
Lake of Egypt              Williamson              500.0                 +1.5                  +1.1                 +0.2                    25                   N/A
Mattoon                    Coles                   632.0                  0.0                   0.0                 –0.1                    22          w/Paradise
Mauvaise Terre(2)          Morgan                  588.5                  N/A                   N/A                 +0.1                    22            no meter
Mt. Olive (new)            Macoupin                600.0                  N/A                   N/A                 –0.5                    13      w/Mt. Olive (old)
Mt. Olive (old)            Macoupin                654.0                  0.0                  +0.4                 –0.2                    23                    5.0
Pana                       Christian               641.6                 +0.2                  +2.0                 –0.5                    35                   N/A
Paradise                   Coles                   685.0                  0.0                  –0.1                 –0.1                    30                  54.3
Paris (east)(5)            Edgar                   660.0                 +0.3                  +0.2                 +0.2                    10             Not PWS
Paris (west)(5)            Edgar                   660.1                 +0.3                  +0.2                 +0.2                    10        w/Paris (east)
Raccoon(1,5)               Marion                  477.0                 –0.2                   –0.3                +0.1                    13                  93.7
Rend                       Franklin                405.0                 +4.5                  +1.2                 +3.0                    43                   N/A
Salem(3)                   Marion                  546.5                 –0.2                   –0.3                –0.3                    25                  23.5
Shelbyville(1)             Shelby                  594.0                 +1.6                  +0.6                 +2.9                    43             Not PWS
Sparta(3)                  Randolph                497.0                 –0.1                   N/A                 –0.5                    23                   N/A
Spring(3,4)                McDonough               654.0                 +0.1                  +0.1                  0.0                    33                  46.7
Springfield(1,3)           Sangamon                559.6                 –1.1                  +0.9                  –1.1                   37                 566.1
Taylorville                Christian               590.0                  0.0                  +0.2                  –0.2                   27                  48.8
Vermilion(4)               Vermilion               581.7                  –0.1                  0.0                  –0.2                   35                 197.5

Notes:
Normal pool and target level datum is NGVD 1929.
Current levels reported represent water surface levels at the end of the month, not the monthly average.
Average difference from normal or target level is the arithmetic average of reported month-end values for the period of record indicated.
Years of record = total number of monthly readings included in month-end average. Total period of record may be longer.
Not PWS = not a public water supply.
N/A = not available.
(1) Target operating level may vary. Seasonal target levels this month represent March 1 values.
(2) Instrumentation not available to measure height of water elevation above spillway.
(3) Natural inflow can be supplemented by other sources.
(4) Normal pool elevations have changed during period of record reported.
(5) Years of record and average since supply switched to different source. Period of reporting is longer.

                                                                                 — PAG E 9 —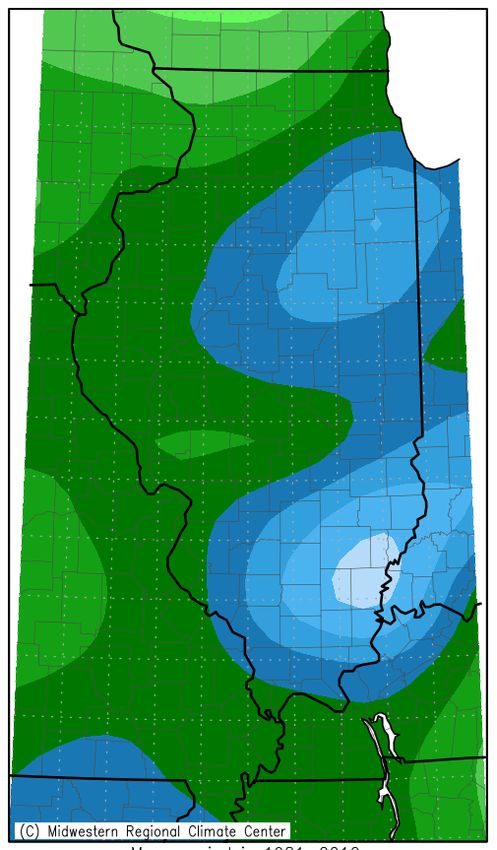
Groundwater Information
— J E N N I E AT K I N S Comparison to January 2021. Shallow groundwater
levels were above those of the previous month. Levels
Comparison to Period of Record. Shallow groundwater averaged 1.11 feet above and ranged from 1.36 feet below
levels in 27 observation wells were above the long-term average to 14.39 feet above January 2021 levels.
for February. Levels were 0.37 feet above average and ranged Comparison to February 2020. Shallow groundwater
from 4.04 feet below to 4.49 feet above normal levels (Table 6). levels in February were below levels from one year ago.
Levels averaged 1.48 feet below and ranged from 11.33
feet below to 2.59 feet above February 2020 levels.
Table 6. Month-End Shallow Groundwater Level Data Sites, February 2021
This month’s Deviation from
Well depth reading (depth 15-year avg. Period of record Previous Previous
Well name County (feet) to water, feet) level (feet) avg. (feet) month (feet) year (feet)
Belleville St Clair 15.00 1.00 1.73 1.49 –0.90 –0.03
Bondville Champaign 21.00 7.08 –3.74 –4.04 2.99 –3.66
Bondville (ICN) Champaign 20.00 5.93 –2.99 –2.95 3.11 –4.24
Boyleston Wayne 23.00 3.95 –0.67 –1.40 0.04 0.90
Brownstown Fayette 15.00 0.00 1.28 1.32 0.00 0.01
Carbondale Jackson 26.00 2.31 0.19 0.15 –0.19 –0.09
Coffman Pike 28.00 n/a N/A N/A N/A N/A
Crystal Lake McHenry 18.00 4.07 0.24 1.01 –0.04 –0.18
DeKalb DeKalb 25.00 4.60 –1.40 –1.59 0.26 –2.33
Fairfield Wayne 21.00 0.42 1.49 1.38 –0.08 0.25
Fermi Lab DuPage 15.00 4.15 1.23 1.27 3.44 1.91
Freeport Stephenson 26.00 20.11 –1.39 –1.36 –0.56 –5.40
Galena JoDaviess 25.00 21.10 –0.57 0.37 0.19 –1.81
Good Hope McDonough 30.00 5.69 0.14 1.04 2.05 –0.69
Greenfield Greene 22.00 13.33 –2.34 –3.51 2.07 –8.81
Janesville Coles 11.00 1.95 2.19 2.54 0.52 2.30
Monmouth Warren 27.00 6.45 3.99 3.88 3.12 2.59
Mt. Morris Ogle 55.00 23.25 –4.29 –3.03 –0.48 –7.71
Olney Richland 19.00 0.00 1.05 1.02 0.00 0.26
Perry Pike 20.00 3.51 4.96 –4.49 14.39 –2.79
Rend Lake Jefferson 21.00 0.94 2.15 2.18 –0.32 0.18
SE College Saline 11.00 0.00 1.42 1.46 0.10 1.19
Snicarte Mason 42.00 35.73 1.68 1.55 –0.24 2.34
Sparta Randolph 27.00 1.30 2.38 4.18 0.09 2.53
Springfield Sangamon 20.00 6.50 –0.87 –0.87 2.51 –5.25
St. Charles Kane 21.00 26.40 –3.45 –2.79 –0.68 –11.33
St. Peter Fayette 15.00 1.47 –0.20 0.12 0.04 0.24
SWS #2 St. Clair 80.00 12.04 0.55 2.17 –1.36 –0.47
0.18 0.37 1.11 —1.48
Notes: N/A = Data not available.
Data sources for this publication include the following: I L L I N O I S S TAT E W AT E R S U R V E Y
CPC - Climate Prediction Center, https://www.cpc.ncep.noaa.gov/index.php
W W W. I SWS . I LLI N O I S . E D U
ISWS - Illinois State Water Survey, https://www.isws.illinois.edu
MRCC - Midwestern Regional Climate Center, https://mrcc.illinois.edu 2204 Griffith Drive
NCEI - National Centers for Environmental Information, https://www.ncei.noaa.gov Champaign, IL 61820
NWS - National Weather Service, https://www.nws.noaa.gov (217) 333-2210
SPC - Storm Prediction Center, https://www.spc.noaa.gov
USACE - U.S. Army Corps of Engineers, http://rivergages.com, https://www.lre.usace.army.mil
USDM - U.S. Drought Monitor, https://droughtmonitor.unl.edu
USGS - U.S. Geological Survey, https://waterdata.usgs.gov/il/nwis
WARM - Water and Atmospheric Resources Monitoring Program, https://www.isws.illinois.edu/warmYou can also read