Central Indiana June 2022 Climate Summary
←
→
Page content transcription
If your browser does not render page correctly, please read the page content below
Central Indiana
                         June 2022
                     Climate Summary
          Tied 30th Warmest June on record at Indianapolis
               8th Driest June on record at Indianapolis

Temperatures
June 2022 was overall rather warm, with most locations averaging 1.0 to 2.0 degrees above
normal across central Indiana. Record heat/humidity during the 13th-16th marked the core of a
week-long anomalously hot period (see below table). Indianapolis set three new record high
minimum temperatures on the 14th, 15th, and 16th. This was the first three-consecutive day
period of any record warmth since upper 70s graced the city in early November 2020, and the
first three-peat of record heat in June since hot overnights in mid-June of 1981. Unseasonable
heat returned to the region briefly during the 21st-22nd, when more reasonable humidity levels
promoted temperatures equaling mid-month maximums at four of the seven 1st-order sites.
Despite these ~10 hot to very hot days, the month was only the warmest since 2018 at
Indianapolis given seasonable to rather cool conditions through the rest of the month. Lowest
temperatures were reported during the 3rd-4th, 9th-10th, and 28th-29th. Lafayette recorded the
coldest morning during the first week, dropping to 47F on the 4th. Several days later Farmland 5
NNW (Randolph Co.) and Kokomo 3 WSW (Howard Co.) both followed suit with their own 47F
observations early on the 9th, although points south were milder with a low of 56F at Indianapolis.
Cool mornings occurred again towards the month’s end, and with some of the lowest readings in
unexpected locations. The morning of the 29th found 44F at New Castle 3 SW (Henry Co.), while
stations across the region’s far south observed 48F – at Shoals 8 S (Martin Co.) and North Vernon
2 ESE (Jennings Co.). Not to be outdone, Indianapolis dropped to a rather cool 56F on the 28th.
June 2022’s above normal temperatures continued the rather warm trends from both June 2021
and May 2022. At Indianapolis, June 2022’s daily average temperatures were above normal on
19 days and below normal on 10 days. It was the (tied) 30 th warmest June for the Indianapolis
Area since weather records began in 1871, placing it in the 80 th percentile of all recorded Junes.
Tabular summary of June 13th-17th’s hot and very humid conditions. Observed maximum and
minimum temperatures are shown for the seven 1st-order/ASOS sites (top), while daily highs
are also included for the six selected COOP sites (lower). Highest max/min temps for each
group are indicated by shaded background. “+9”, etc. indicates each day’s overall departure
(°F) from the site’s normal temperature. Daily dewpoint maximums are shown for ASOS sites
by values in green, as well as minimum dewpoints on 6/17 following the arrival of Canadian
high pressure as the sultry workweek came to an end.June 2022 June 2022 Highest Lowest
Site Average Temp Dep from Nml Temperature Temperature
Indianapolis Int’l Airport 74.4 +1.9 95 on 21st 54 on 3rd
Lafayette 72.1 +1.4 th
96 on 16 , 21 st 47 on 4th
Muncie 74.4 +1.0 97 on 14th, 21st 50 on 28th
Terre Haute 74.6 +1.9 97 on 16th, 21st 51 on 4th, 28th
Bloomington 73.7 +1.7 93 on 13-16th, 51 on 28th, 29th
21st-22nd
Shelbyville 75.4 +2.2 98 on 14th 52 on 28th
Eagle Creek Airpark 74.8 +2.3 96 on 14th 54 on 28th
Precipitation
June began with afternoon to early evening thunderstorms on the 1st, across the southeastern
half of central Indiana, which were followed by occasional light to moderate late night rain; while
most of the region saw less than 0.10”, storm totals were greatest along a line from 1.67” north
of Oolitic (Lawrence Co.), through 1.70” near Flat Rock (Bartholomew Co.), to 1.83” in Rushville
(Rush Co.). Dry conditions prevailed during the 3rd-5th, before an active second week.
On the 6th, a few morning showers led to numerous afternoon thunderstorms and then a lighter
widespread evening rain; 0.10-0.80” was common, with several small patches of 1.00-1.70”, with
2.47” near Winchester (Randolph Co.), 2.18” in Westfield (Hamilton Co.), and 1.65” near Stanford
(Greene Co.). The 8th brought scattered morning to midday, briefly heavy showers, that were
soon followed by numerous t-storms through early evening; much of the region picked up 0.25-
0.80”, with 0.82” south of Ellettsville (Monroe Co.) and 0.80” in Rushville being the greatest
observations. On the 10th, periods of rain trended from generally southern counties during the
daytime to more central/northern zones in the evening. After midnight a rather narrow band
set-up along a Rockville to Seymour line; sites that received rain from all rounds reported the
greatest totals – 1.02” near Reelsville (Putnam Co.), 0.94” north of Spencer (Owen Co.) and 0.71”
at Seymour 1 WSW. The 11th found isolated afternoon showers precede widespread evening to
overnight thunderstorms across mainly central/northern counties, with further scattered
showers over southwestern zones towards dawn on the 12th; totals were 0.50-1.30” for much of
the region, with a few reports around 1.85” from south of Anderson (Hamilton Co.) to Modoc
(Randolph Co.), and 1.73” east of Martinsville (Morgan Co.). Rains continued on the 13th, with
locally potent thunderstorms forming in the morning along/near the I-74 corridor; Clayton
(Hendricks Co.) measured 1.49”, although amounts closer to 3.00” likely fell over rural portions
of Parke and Putnam Counties. The fourth consecutive day of storms, the 13th, welcomed thearriving heat wave, with brief heavy downpours during the afternoon along/north of I-74; the narrow axis of greatest reports extended from 1.31” south of Pike (Boone Co.) to 2.22” west of Wilkinson (Hancock Co.). 4-day rainfall totals (for the 10th-13th) ranged from 1.00-2.40” for most locations, and especially the northern half of the region, with 3.13” west of Wilkinson, 2.54” in Kilmore (Clinton Co.), and 2.01” in Beanblossom (Brown Co.). 8-day totals (for the 6th-13th) were mostly 1.50-2.80”, while locally anomalous totals included 4.44” near Winchester, 3.62” in Wilkinson, 3.29” in Clayton, and 3.15” near Hayden (Jennings Co.); meanwhile most of the climatologically wetter Wabash Valley and the US-50 corridor for Bedford and west totaled mainly below 0.75”. A final episode of mid-month thunderstorms graced at least southwestern portions of the region from dawn to noon on the 17th, with generally 0.25-0.90” falling southwest of Bloomington, with isolated heavier observations under the heaviest cells: 1.90” at Elnora (Daviess Co.) and 1.06” along the Wabash River near Graysville (Sullivan Co.). The month’s remaining two weeks were abnormally dry as Gulf of Mexico moisture was continually suppressed by an upper-level ridge centered over the southern Plains, starving out better rainfall potential from the few northern- stream waves that approached Indiana. The 22nd found afternoon storms develop over far southeastern counties just before advancing out of the area, with a small swath of sub-1.00” readings along the US-50 corridor from Lawrence County and east. On the 25th, two rounds of approaching rain/storms collapsed while attempting to cross the region, yet rain was deposited onto the dry ground, both in the afternoon over mainly northwest counties and then over all but eastern zones later in the overnight; combined totals were generally meager with 0.10-0.50” common over the western half of the region, and only a narrow patch of 0.75-0.90” along the Wabash River from Fountain County down to Terre Haute proper. Official “Abnormally Dry” (D0) and “Moderate Drought” (D1) conditions expanded eastward across the region following late June’s overall lack of rainfall. The upper Wabash Valley continued to exhibit the driest conditions. What started as a relatively small area of D0 over Warren County as of the June 7th update, expanded slowly into northern Fountain County and southwestern Tippecanoe County as of the 14th, before becoming D1 as of the 21st, with D1 then expanding as of the 28th to also include the entire upper Wabash Valley into far northern Vigo County. Meanwhile D0 conditions had expanded as of the 21st as far south and east as a Terre Haute- Lebanon-Alexandria line, before enveloping all of the region, excepting small portions of Henry, Rush and Randolph Counties as of the 28th. No river or stream flooding was observed in June. In summary, despite several opportunities for rain through much of the month’s first half, June fell well short of the ~4.50-5.20” climatological normals. Percentage of normal values across 1st- order airports ranged from 20% at Eagle Creek Airpark to 44% at Lafayette. The convective nature of rainfall events led to a highly-variable distribution of the limited rain, with several sites being outliers from the common 1.00-3.00” totals. Nearing normal values were several sites along far eastern counties, including 4.52” near Hayden (Jennings Co.), as much as 4.41” in the Rushville (Rush Co.) area, and 4.59” near Winchester (Randolph Co.). More representative of the increasingly parched conditions were several sites that fell short of 1.00” across both far northern zones and to the south of Indianapolis, including 0.72” at the Throckmorton-Purdue Agricultural Center at South Raub and 0.91” west of Battle Ground (both in Tippecanoe Co.), totals as low as 0.61” in Kokomo (Howard Co.); as well as 0.87” east of Paragon (Morgan Co.), 0.93” in Franklin
(Johnson Co.), and 0.62” in New Palestine (Hancock Co.). 1.18” fell at Indianapolis International
Airport, which was a mere 24% of normal. Three of the last six Junes at Indianapolis saw either
anomalously high (2017, 2020) or unseasonably low (2018) rainfall, although 2022 continued the
slightly below normal pattern from both June 2019 and June 2021. The year-to-date total at
Indianapolis rose to 19.75”, taking Indianapolis into a deficit for the first time this year – 3.53”
below normal.
Site June 2022 June 2022 Wettest Day Longest Dry Stretch
Precipitation Dep from Nml
Indianapolis Intl AP 1.18 −3.77 0.49 on 12th 12 days, 14-25th
Lafayette 2.02 −2.54 1.09 on 12th 11 days, 14-24th
Muncie 1.78 −3.03 1.09 on 11th 12 days, 14-25th
Terre Haute 1.04 −3.60 0.51 on 6th 8 days, 18-25th
Bloomington 2.48 −2.61 0.86 on 6th 8 days, 18-25th
Shelbyville 1.59 −3.57 0.39 on 11th 8 days, 18-25th
Eagle Creek Airpark 1.01 −4.05 0.31 on 11th 12 days, 14-25th
June 2022 was the 8th driest in the Indianapolis Area since weather records began in 1871, placing it in
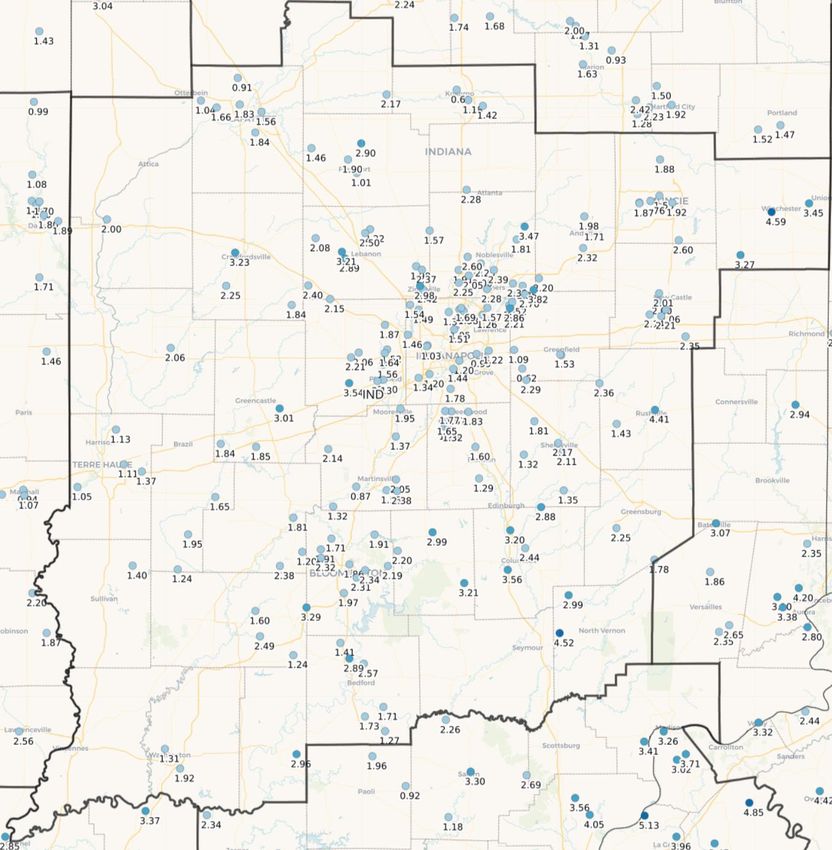
the 95th percentile driest of all recorded Junes.June 2022 Total Precipitation, Through the Morning of 7/1/2022
As Reported By Central Indiana CoCoRaHS Observers
For the period 700 AM EDT 6/1/2022 -to- 700 AM EDT 7/1/2022. Data is unofficial.
Occasional thunderstorms through the 13th led the overall meager and highly-variable precipitation totals of mainly
1.00-3.00”. Monthly totals of 4.00-5.00” were sprinkled along far-eastern counties, while several sub-1.00” patches
were found north/west of the Indianapolis Metro. All locations were below to well below normal.Severe Weather
June 2022’s severe weather was at times frequent, especially around the second week when
large hail and/or damaging winds were reported on 4 of 8 days. Days with numerous strong
storms that included isolated severe events were more common than organized severe weather,
although scattered severe storms did occur on the 8th, 13th, and 17th. Two weak tornadoes on
the 8th increased central Indiana’s yearly total to 10 tornadoes. The 1st saw scattered afternoon
strong thunderstorms with a few severe reports: winds downed tree branches onto US-31 in
Edinburg (Johnson Co.), while hail as large as 1.25” fell on portions of Lawrence and Bartholomew
Counties. Amid several strong storms on the 6th, 1.00” hail was reported in Westfield (Hamilton
Co.).
The 8th found the month’s most intense weather as ample wind shear fueled afternoon storms:
several reports of 1.75” hail crossed Jennings County, winds downed trees in southeastern
portions of both Hendricks County and Brown County, while Rush and Madison Counties each
saw one tornado. The Rush County EF1 tornado lifted occasionally along a nearly 10-mile path
from southeast of Gynneville to north of Rushville, throwing debris from damaged homes nearly
a quarter-mile, and causing major roof damage at both the Posey Township Volunteer Fire
Department and Arlington Elementary School. The Madison County EF0 tornado skipped across
a 0.6-mile path through Summitville, with several large downed tree limbs damaging a car and
home, among scattered minor tree and roof damage.
On the 12th, strong midday thunderstorms were locally intense, with photographs of 2.00” hail
in Coyuga (Vermillion Co.), a road washed out along the northern Parke-Putnam County line, and
several trees downed along US-231 just south of Fincastle (Putnam Co.). Another moderate
severe event impacted the region on the 13th: 1.00” hail and localized flash flooding were
reported in both Clinton County and Hancock County, with water over Indiana Route 26 at
Middlefork (Hancock Co.); while winds downed a few trees from Russiaville (Howard Co.) to east-
central portions of Rush County. The morning of the 17th brought another round of numerous
severe wind reports, as trees were toppled across several southwestern counties; Martin County
damage ranged from several downed trees along Greenwood Lake to two trees blown onto the
Weisbach Community Church in Shoals.
For info on severe weather in other areas during June, visit the Storm Prediction Center
“Severe Weather Event Summaries” website at spc.noaa.gov/climo/onlineMiscellaneous – Winds, Thunder, Fog & More June 2022’s at times frequent, yet typically isolated, severe weather once again did not intersect with any of the seven 1st-order airports. However, wind gusts did exceed 40 mph at these sites on a few occasions: Shelbyville recorded 47 mph from the northwest on the 1st, while the 8th brought gusts of 45 mph to Indianapolis and 42 mph to Lafayette. Most sites gusted above 30 mph on the 26th, with Terre Haute reading 41 mph. In contrast, light winds prevailed on the 24th, with all seven airports’ average wind speed under 5 mph. Fog frequency ranged from 4 days at Muncie to 11 days at Bloomington, while Indianapolis observed fog on 6 days. The second week was quite foggy, with fog common across the seven 1st-order airports on the 7th, 8th, and 10th; and all sites reporting fog on the 11th-13th. Dense fog was rare − only occurring on the 12th at Lafayette and on the 13th at Bloomington, Eagle Creek Airpark, Lafayette, and Muncie. Thunder frequency was led by 6 days at Indianapolis, with most other sites reporting thunder on 4 or 5 days. Thunder was common across the region on the 12th and 13th, yet rare during the remaining 17 days of June. Humidity extremes were seen between rare, oppressively high dewpoints around 80F on the 13th-14th and persistent dry heat over the 18th-24th, where relative humidity values often dropped below 30%. On the 3rd-5th, broad Canadian high pressure promoted very dry air at the surface, with minimum daily relative humidity values of 22-24% at most 1st-order sites on the 1st, before all sites dropped below 25% on the 2nd – including down to 11% at Muncie and 19% at Indianapolis. Muncie also dropped to 14% and 22% on the 3rd and 5th, respectively. The 8th then found dewpoints climbing briefly into the low 70s across most areas south of I-70. Widespread record-setting humidity began to infiltrate the region on the morning of the 12th, and while daily maximum dewpoints in the mid 70s or higher were seen through at least the 16th, the peak daily values were observed on the 13th - ranging from 77F at Muncie to 81F at Lafayette. All-time highest June dewpoint measurements were set by Terre Haute’s 80F (since 1961), Eagle Creek Airpark’s 79F (since 1996), and Shelbyville’s 80F (since 1998); Lafayette’s 81F was the month’s highest dewpoint since 2010, while Indianapolis’ 78F had not been surpassed in June since 1979. The 14th saw dewpoints down 2-4 degrees from this peak, with the day’s highest readings in mainly the upper 70s (see table above). Dewpoints persisted above 70F for most locations until quickly falling amid a cold frontal zone late on the 16th / the morning of the 17th. The remainder of the month was characterized by generally low daily minimum relative humidity values, especially on the 17th-24th, 27th-28th, and 30th; Muncie again led the way, recording values of 25% or lower on each of these days, including minimums of 16-19% on the 18th, 19th, and 30th. Indianapolis’ driest late days were the 18th (21%), 24th (24%), and 28th (23%).
July 2022 Outlook
The official outlook for July 2022 from the Climate Prediction Center indicates slightly greater
chances of above normal temperatures for central Indiana. The normal July temperature at
Indianapolis 75.8 degrees.
The outlook also indicates equal chances of above, below, or near normal precipitation for the
region. The normal July precipitation at Indianapolis is 4.42”.

      Data prepared by the Indianapolis Weather Forecast Office’s State Climate Team
               Questions should be referred to nws.indianapolis@noaa.gov
You can also read