Charts for the Beach - Richard Bernstein Advisors
←
→
Page content transcription
If your browser does not render page correctly, please read the page content below

Insights                         August 2021

  The Leaders In Pactive® Management

 Richard Bernstein Advisors
                                            Charts for the Beach

Richard Bernstein Advisors LLC (RBA)
is an investment manager focusing on
longer-term investment strategies that
combine top-down, macroeconomic
analysis and quantitatively-driven
portfolio construction. We strive to
be the leading provider of innovative
investment solutions for investors, and
our competitive edge is our research-
driven macro style of investing.
Our top-down macro approach
differentiates our firm from the
more common, traditional bottom-up
approach of most asset managers.
                                            It’s time for our annual August report, “Charts for the Beach.” Each year
Our extensive array of macro indicators
                                            we highlight five of our favorite charts we think consensus is currently
allows us to construct portfolios
                                            overlooking. Load up the cooler, get your towel and chair, and enjoy the
for clients that are innovative,
                                            charts! As The Happenings sang, “See you in September.”
risk-controlled, and focused on
overall portfolio construction instead
of individual stock selection.
                                            The Fed has cornered the Treasury market
                                            When the Hunt brothers attempted to corner the silver market in the early-
                                            1980s, they owned approximately 30-35% of the privately held market.
                                            Today, the US Federal Reserve owns between 50-55% of the 10-20 year
                                            Treasury market. The Fed has cornered the Treasury market.

                                            This has several implications:

                                               1. The Treasury market’s available float has been reduced, so
                                                  interest rate movements have become accentuated.

                                               2. The Fed has worked against its own goals. The combination
                                                  of tighter post-Financial Crisis regulations on leverage and a flat
                                                  yield curve has constrained bank lending and prevented liquidity
  CONTACT RBA                                     from flowing to the real economy.
  Website: RBAdvisors.com
  Twitter: @rbadvisors
  Phone: (212) 692-4088                   © 2021 Richard Bernstein Advisors LLC   PAST PERFORMANCE IS NO GUARANTEE OF FUTURE RESULTS   1
Insights   August 2021        3. The Fed has fostered a broad range of bubbles because their
                                 massive liquidity injections have been trapped in the financial
                                 economy.

                              4. As with any cornered market, there are limited buyers and
                                 prices fall as the “cornerer” sells. Accordingly, bond prices
                                 seem likely to fall (interest rates rise) when as Fed reduces its
                                 cornered positions.

                              5. Rising interest rates could be the kryptonite to the bubble in
                                 long-duration assets (long-term bonds, technology, innovation,
                                 disruption, bitcoin, etc.).

                                                                        CHART 1:
                              Fed Ownership of Treasury Securities as a Percentage of Outstanding, by Maturity
                                                              (as of July 2021)

                             60%

                             50%

                             40%

                             30%

                             20%

                             10%

                              0%
                                       0-1y           1-2y       2-5y        5-7y        7-10y      10-20y       20-30y

                              Source: New York Fed.

                           Don’t be geographically myopic
                           Investors tend to become very myopic during a bubble, and believe
                           only a small universe of stocks is attractive. Accordingly, innovation
                           and disruption themes have become cornerstones of speculative
                           growth investing in the US during the current bubble. However,
                           France, not exactly the hotbed of innovation and disruption, is
                           outperforming NASDAQ so far this year. No technology industry
                           ranks in the top 10 of MSCI France index’s industries. Myopia
                           during a bubble can hurt portfolio performance.

                         © 2021 Richard Bernstein Advisors LLC      PAST PERFORMANCE IS NO GUARANTEE OF FUTURE RESULTS    2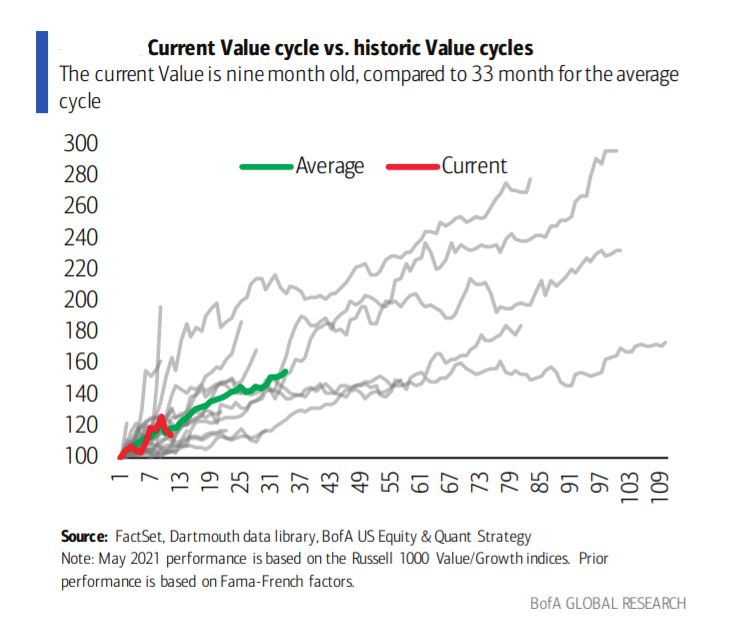
Insights   August 2021                                                        CHART 2:
                                          MSCI France Outperforming the NASDAQ Composite Index YTD
                                                         (Dec. 31, 2020 - Aug. 17, 2021)

                             Source: Bloomberg Finance L.P. For descriptors, see “Index Descriptions” at end of document.

                           One sign of a bubble: increased turnover
                           Did you realize the leading bitcoin trading platform has a market
                           capitalization over 50% larger than the market cap of the exchange
                           upon which its stock trades? Increased turnover is one of the classic
                           signs of a bubble and these elevated crypto trading volumes are
                           reflected in Coinbase’s outsized market capitalization.

                                                                              CHART 3:
                                                             Market Capitalization ($ Billions)
                                                                   (as of Aug. 16, 2021)

                              $80

                              $70

                              $60

                              $50

                              $40

                              $30

                              $20

                              $10

                                $0
                                        CME Group*         Intercontinental       Coinbase             Nasdaq        CBOE Global
                                                              Exchange*                                                Markets

                           Source: Bloomberg Finance L.P.
                           * At the time of this publication, this security is currently held in an RBA Portfolio.

                         © 2021 Richard Bernstein Advisors LLC            PAST PERFORMANCE IS NO GUARANTEE OF FUTURE RESULTS       3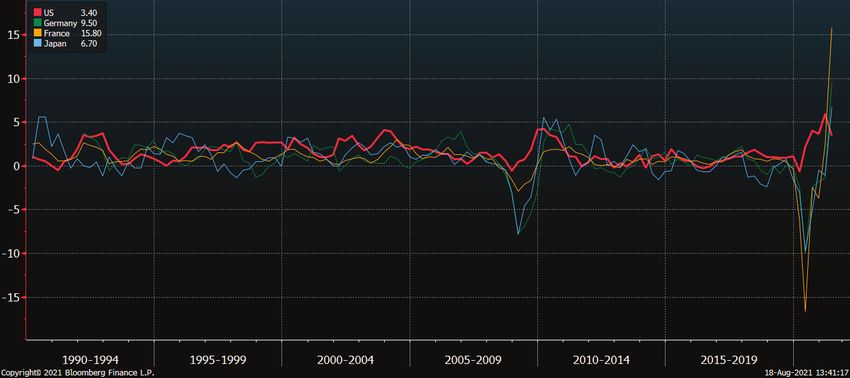
Insights   August 2021
                           More normal than you’d think
                           Patience is not a word used to describe investors these days.
                           However, investing patience has historically been a virtue. Case in
                           point, the current value cycle seems to be playing out according to
                           historical norms despite all the “I told you so” regarding the recent
                           underperformance of value. According to BofA Global Research,
                           growth outperforms value 33% of the time during value cycles and
                           the current value run seems to indeed be closely mimicking the
                           historical pattern.

                                                                 CHART 4:
                                                        Historic Length of Value Cycles

                           Stop the Technology hype!
                           Investors always need to distinguish hype from reality, but it’s
                           often difficult to do so because the underlying story seems so
                           compelling. But facts are facts.

                           There is a clear consensus the increased use of technology has
                           improved productivity and will hinder any inflation potential. The
                           unfortunate reality is technology hasn’t changed the trend in
                           productivity one bit over the past 30 years. That’s true in the US
                           and true in most major economies.

                           Globalization, and its associated impact of increased competition,
                           more likely depressed inflation trends than did technology. When
                           supply is greater than demand and competition heats up, prices go
                           down. Econ 101 is never as sexy as a hyped story though.

                         © 2021 Richard Bernstein Advisors LLC   PAST PERFORMANCE IS NO GUARANTEE OF FUTURE RESULTS   4
Insights August 2021 CHART 5:
OECD Productivity (Y/Y percent change)
(January 1990 - June 2021)
Source: Bloomberg Finance L.P.
Don’t miss out on future RBA Insights, subscribe today.
To learn more about RBA’s disciplined approach to macro
investing, please contact your local RBA representative.
INDEX DESCRIPTIONS:
The following descriptions, while believed to be accurate, are in
some cases abbreviated versions of more detailed or comprehensive
definitions available from the sponsors or originators of the
respective indices. Anyone interested in such further details is free
to consult each such sponsor’s or originator’s website.
The past performance of an index is not a guarantee of future results.
Each index reflects an unmanaged universe of securities without any deduction
© 2021 Richard Bernstein Advisors LLC PAST PERFORMANCE IS NO GUARANTEE OF FUTURE RESULTS 5Insights August 2021 for advisory fees or other expenses that would reduce actual returns, as
well as the reinvestment of all income and dividends. An actual investment
in the securities included in the index would require an investor to incur
transaction costs, which would lower the performance results. Indices are
not actively managed and investors cannot invest directly in the indices.
Nasdaq: The Nasdaq Composite Index: The NASDAQ Composite Index
is a broad-based market-capitalization-weighted index of stocks that
includes all domestic and international based common type stocks listed
on The NASDAQ Stock Market.
France: The MSCI France Index. The MSCI France Index is a free-float-
adjusted, market-capitalization-weighted index designed to measure the
equity-market performance of France.
About Richard Bernstein Advisors
Richard Bernstein Advisors LLC is an investment manager focusing
on long-only, global equity and asset allocation investment strategies.
RBA runs ETF asset allocation SMA portfolios at leading wirehouses,
independent broker/dealers, TAMPS and on select RIA platforms.
Additionally, RBA partners with several firms including Eaton Vance
Corporation and First Trust Portfolios LP, and currently has $14.7 billion
collectively under management and advisement as of July 31st, 2021.
RBA acts as sub‐advisor for the Eaton Vance Richard Bernstein Equity
Strategy Fund, the Eaton Vance Richard Bernstein All‐Asset Strategy
Fund and also offers income and unique theme‐oriented unit trusts
through First Trust. RBA is also the index provider for the First Trust
RBA American Industrial Renaissance® ETF. RBA’s investment insights
as well as further information about the firm and products can be found
at www.RBAdvisors.com.
Nothing contained herein constitutes tax, legal, insurance or investment advice, or the
recommendation of or an offer to sell, or the solicitation of an offer to buy or invest in any investment
product, vehicle, service or instrument. Such an offer or solicitation may only be made by delivery to
a prospective investor of formal offering materials, including subscription or account documents or
forms, which include detailed discussions of the terms of the respective product, vehicle, service or
instrument, including the principal risk factors that might impact such a purchase or investment, and
which should be reviewed carefully by any such investor before making the decision to invest. RBA
information may include statements concerning financial market trends and/or individual stocks, and
are based on current market conditions, which will fluctuate and may be superseded by subsequent
market events or for other reasons. Historic market trends are not reliable indicators of actual future
market behavior or future performance of any particular investment which may differ materially,
and should not be relied upon as such. The investment strategy and broad themes discussed
herein may be inappropriate for investors depending on their specific investment objectives and
financial situation. Information contained in the material has been obtained from sources believed
to be reliable, but not guaranteed. You should note that the materials are provided “as is” without
any express or implied warranties. Past performance is not a guarantee of future results. All
investments involve a degree of risk, including the risk of loss. No part of RBA’s materials may be
reproduced in any form, or referred to in any other publication, without express written permission
from RBA. Links to appearances and articles by Richard Bernstein, whether in the press, on
television or otherwise, are provided for informational purposes only and in no way should be
considered a recommendation of any particular investment product, vehicle, service or instrument
or the rendering of investment advice, which must always be evaluated by a prospective investor
in consultation with his or her own financial adviser and in light of his or her own circumstances,
including the investor’s investment horizon, appetite for risk, and ability to withstand a potential loss
of some or all of an investment’s value. Investing is subject to market risks. Investors acknowledge
and accept the potential loss of some or all of an investment’s value. Views represented are
subject to change at the sole discretion of Richard Bernstein Advisors LLC. Richard Bernstein
Advisors LLC does not undertake to advise you of any changes in the views expressed herein.
© Copyright 2021 Richard Bernstein Advisors LLC. All rights reserved.
PAST PERFORMANCE IS NO GUARANTEE OF FUTURE RESULTS
© 2021 Richard Bernstein Advisors LLC PAST PERFORMANCE IS NO GUARANTEE OF FUTURE RESULTS 6You can also read