Cheniere Earnings Presentation - Third Quarter 2021 - cloudfront.net

Page created by Clara Bradley
 
CONTINUE READING
Cheniere Earnings Presentation - Third Quarter 2021 - cloudfront.net
Cheniere Earnings Presentation
Third Quarter 2021

November 4, 2021

NYSE American: LNG
Cheniere Earnings Presentation - Third Quarter 2021 - cloudfront.net
Safe Harbor Statements
Forward-Looking Statements
This presentation contains certain statements that are, or may be deemed to be, “forward-looking                   •   statements that our Trains, when completed, will have certain characteristics, including amounts of liquefaction
statements” within the meaning of Section 27A of the Securities Act of 1933, as amended, and Section 21E               capacities;
of the Securities Exchange Act of 1934, as amended. All statements, other than statements of historical or         •   statements regarding our business strategy, our strengths, our business and operation plans or any other plans,
present facts or conditions, included or incorporated by reference herein are “forward-looking                         forecasts, projections or objectives, including anticipated revenues, capital expenditures, maintenance and operating
statements.” Included among “forward-looking statements” are, among other things:                                      costs, free cash flow, run rate SG&A estimates, cash flows, EBITDA, Consolidated Adjusted EBITDA, distributable cash
•   statements regarding the ability of Cheniere Energy Partners, L.P. to pay or increase distributions to its         flow, distributable cash flow per share and unit, deconsolidated debt outstanding, and deconsolidated contracted
    unitholders or Cheniere Energy, Inc. to pay or increase dividends to its shareholders or participate in            EBITDA, any or all of which are subject to change;
    share or unit buybacks;                                                                                        •   statements regarding projections of revenues, expenses, earnings or losses, working capital or other financial items;
•   statements regarding Cheniere Energy, Inc.’s or Cheniere Energy Partners, L.P.’s expected receipt of           •   statements regarding legislative, governmental, regulatory, administrative or other public body actions, approvals,
    cash distributions from their respective subsidiaries;                                                             requirements, permits, applications, filings, investigations, proceedings or decisions;
•   statements that Cheniere Energy Partners, L.P. expects to commence or complete construction of its             •   statements regarding our anticipated LNG and natural gas marketing activities;
    proposed liquefied natural gas (“LNG”) terminals, liquefaction facilities, pipeline facilities or other
                                                                                                                   •   statements regarding the outbreak of COVID-19 and its impact on our business and operating results, including any
    projects, or any expansions or portions thereof, by certain dates or at all;
                                                                                                                       customers not taking delivery of LNG cargoes, the ongoing credit worthiness of our contractual counterparties, any
•   statements that Cheniere Energy, Inc. expects to commence or complete construction of its proposed                 disruptions in our operations or construction of our Trains and the health and safety of our employees, and on our
    LNG terminals, liquefaction facilities, pipeline facilities or other projects, or any expansions or portions       customers, the global economy and the demand for LNG; and
    thereof, by certain dates or at all;
                                                                                                                   •   any other statements that relate to non-historical or future information.
•   statements regarding future levels of domestic and international natural gas production, supply or
                                                                                                                   These forward-looking statements are often identified by the use of terms and phrases such as “achieve,” “anticipate,”
    consumption or future levels of LNG imports into or exports from North America and other countries
                                                                                                                   “believe,” “contemplate,” “continue,” “could,” “develop,” “estimate,” “example,” “expect,” “forecast,” “goals,” ”guidance,”
    worldwide, or purchases of natural gas, regardless of the source of such information, or the
                                                                                                                   “intend,” “may,” “opportunities,” “plan,” “potential,” “predict,” “project,” “propose,” “pursue,” “should,” “subject to,”
    transportation or other infrastructure, or demand for and prices related to natural gas, LNG or other
                                                                                                                   “strategy,” “target,” “will,” and similar terms and phrases, or by use of future tense. Although we believe that the
    hydrocarbon products;
                                                                                                                   expectations reflected in these forward-looking statements are reasonable, they do involve assumptions, risks and
•   statements regarding any financing transactions or arrangements, or ability to enter into such                 uncertainties, and these expectations may prove to be incorrect. You should not place undue reliance on these forward-
    transactions;                                                                                                  looking statements, which speak only as of the date of this presentation. Our actual results could differ materially from
•   statements relating to Cheniere’s capital deployment, including intent, ability, extent, and timing of         those anticipated in these forward-looking statements as a result of a variety of factors, including those discussed in
    capital expenditures, debt repayment, dividends, and share repurchases                                         “Risk Factors” in the Cheniere Energy, Inc. and Cheniere Energy Partners, L.P. Annual Reports on Form 10-K filed with the
•   statements relating to the construction of our proposed liquefaction facilities and natural gas                SEC on February 24, 2021, which are incorporated by reference into this presentation. All forward-looking statements
    liquefaction trains (“Trains”) and the construction of our pipelines, including statements concerning the      attributable to us or persons acting on our behalf are expressly qualified in their entirety by these ”Risk Factors.” These
    engagement of any engineering, procurement and construction ("EPC") contractor or other contractor             forward-looking statements are made as of the date of this presentation, and other than as required by law, we
    and the anticipated terms and provisions of any agreement with any EPC or other contractor, and                undertake no obligation to update or revise any forward-looking statement or provide reasons why actual results may
    anticipated costs related thereto;                                                                             differ, whether as a result of new information, future events or otherwise.
•   statements regarding any agreement to be entered into or performed substantially in the future,
    including any revenues anticipated to be received and the anticipated timing thereof, and statements           Reconciliation to U.S. GAAP Financial Information
    regarding the amounts of total LNG regasification, natural gas, liquefaction or storage capacities that        The following presentation includes certain “non-GAAP financial measures” as defined in Regulation G under the
    are, or may become, subject to contracts;                                                                      Securities Exchange Act of 1934, as amended. Schedules are included in the appendix hereto that reconcile the non-
•   statements regarding counterparties to our commercial contracts, construction contracts and other              GAAP financial measures included in the following presentation to the most directly comparable financial measures
    contracts;                                                                                                     calculated and presented in accordance with U.S. GAAP.
•   statements regarding our planned development and construction of additional Trains or pipelines,
    including
          2   the financing of such Trains or pipelines;
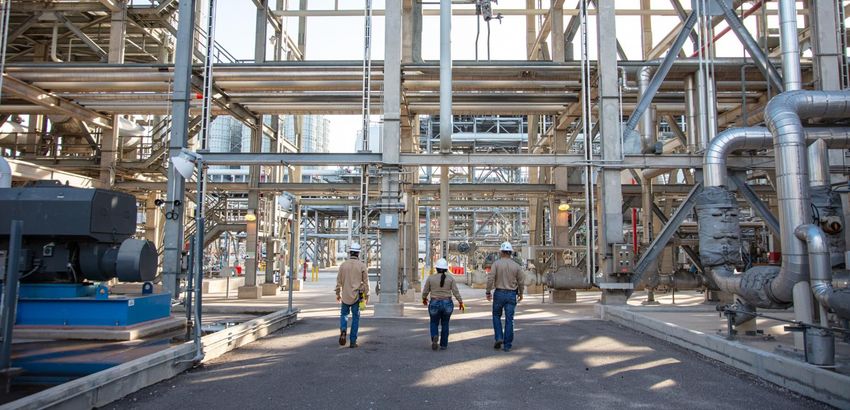
Cheniere Earnings Presentation - Third Quarter 2021 - cloudfront.net
Agenda

    Introduction         Randy Bhatia
                         Vice President, Investor Relations

    Company Highlights   Jack Fusco
                         President and Chief Executive Officer

    Commercial Update    Anatol Feygin
                         Executive Vice President and Chief Commercial Officer

    Financial Review     Zach Davis
                         Senior Vice President and Chief Financial Officer

    Q&A

3
Cheniere Earnings Presentation - Third Quarter 2021 - cloudfront.net
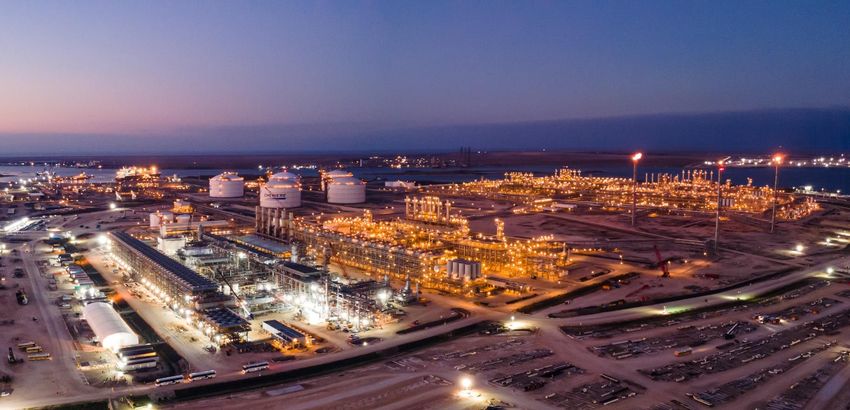
Operating and Financial Highlights
Jack Fusco, President and CEO
Cheniere Earnings Presentation - Third Quarter 2021 - cloudfront.net
Third Quarter Highlights and Guidance Update
       Consolidated Adjusted EBITDA
                                                                       Financial Guidance
     $1,200
     $1,000                                                             ($ billions, except per unit data)
                                                                                                                                                                FY 2021                                     Introduced FY 2022
       $800
       $600                                                             Consolidated Adjusted EBITDA                                                  $4.6          -            $5.0                    $5.8            -         $6.3
                                            $1,053
       $400
       $200           $477                                              Distributable Cash Flow                                                       $1.8          -            $2.1                    $3.1            -         $3.6
          $-
                       3Q 20                 3Q 21                      CQP Distribution per Unit                                                   $2.60           -          $2.70                    $3.00            -        $3.25
               Distributable Cash Flow
      $500
                                                                                          Long-Term SPAs signed with                                                                  Feed Gas Introduced at
      $400
                                                                                          ENN & Glencore                                                                              Sabine Pass Train 6
      $300

      $200                                  ~$390                                                0.9 MTPA from CMI on FOB basis for                                  Sabine Pass Train 6 commissioning activities
                                                                                                 ~13 years beginning July 2022                                       commenced with feed gas introduced in September
      $100           ~$190
                                                                                                                                                                     Project completion 97.1%1 with forecast Substantial
        $-                                                                                       0.8 MTPA from CMI on FOB basis for
                                                                                                                                                                     Completion in 1Q 2022
                      3Q 20                  3Q 21
                                                                                                 ~13 years beginning April 2023
                       Net Income
         $-
                                                                                          Announced Comprehensive Long-Term
                                                                                                                                                                                      141 Cargoes Exported
     $(250)          ($463)                                                               Capital Allocation Plan

                                           ($1,084)
     $(500)
                                                                              ✓   ~$1 billion of annual debt repayment through 2024                                  Exported record number of cargoes during the third
     $(750)                                                                   ✓   $0.33/share inaugural quarterly dividend in 3Q                                     quarter from our liquefaction platform
    $(1,000)                                                                  ✓   3-year $1 billion share repurchase program reset
                      3Q 20                  3Q 21                            ✓   Corpus Christi Stage 3 FID targeted for 2022

        Note: $ in millions unless otherwise noted. Net income as used herein refers to Net income attributable to common stockholders on our Statement of Operations. Consolidated Adjusted EBITDA and Distributable Cash Flow
5       are non-GAAP measures. A definition of these non-GAAP measures and a reconciliation to Net income attributable to common stockholders, the most comparable U.S. GAAP measure, is included in the appendix.
        1. Project completion percentage as of September 30, 2021.
Cheniere Earnings Presentation - Third Quarter 2021 - cloudfront.net
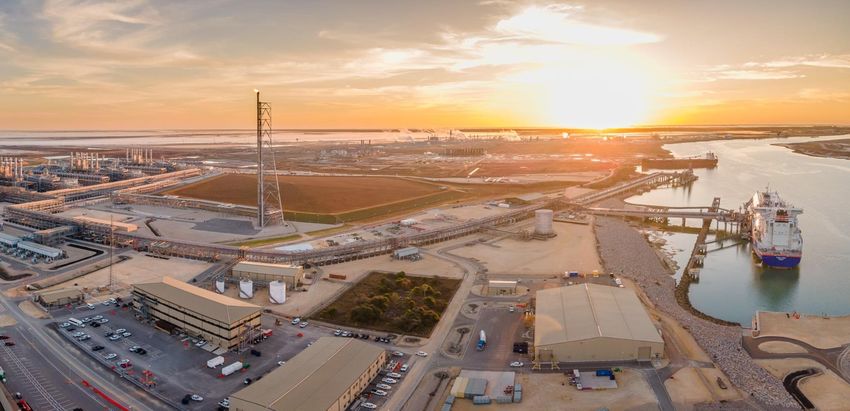
LNG Market Fundamentals Support Commercial Momentum
    Expected FID of Corpus Christi Stage 3 in 2022 supported by strong global LNG market and the demonstrated value of Cheniere’s reliable
                and flexible commercial offering to meet the long-term energy needs and environmental goals of our customers

                      Commercial Momentum Across Platform                                                                                                     Global LNG Supply Outlook
        Signed >2.5 mtpa of long-term take-or-pay contracts in ~3 months                                                        70 mtpa of LNG supply needed by 2030 and over 210 mtpa needed by 2040

                                                                                                                          700                                                                LNG Trade Forecast
                                                  0.85 mtpa                15 years             IPM

                                                                                                                                                                                                                             New Supply
                                                                                                                          600
                                                                                                                                                                                                              +210 mtpa
                                                                                                                          500
                                                  0.9 mtpa              ~13 years               FOB                       400

                                                                                                                                                                                                                             Under Construction
                                                                                                                                                                                                                              Operational and
                                                                                                                          300

                                                  0.8 mtpa              ~13 years               FOB                       200

                                                                                                                          100

                                 Creditworthy Counterparties                                                                 0
                                                                                                                              2000          2005         2010          2015           2020   2025    2030     2035    2040

                                                                                                                                                        12-Month Forward Curve Averages

                                                                                                                                 ~$4.50 Henry Hub                                ~$20 JKM               ~$17 TTF

     Note: Forward curve averages as of November 3, 2021.
6
     Source: Cheniere Research estimates (July 2021), Wood Mackenzie for historical figures. Area chart includes all recent FIDs through February 2021 (up to and including QG NFE)
Cheniere Earnings Presentation - Third Quarter 2021 - cloudfront.net
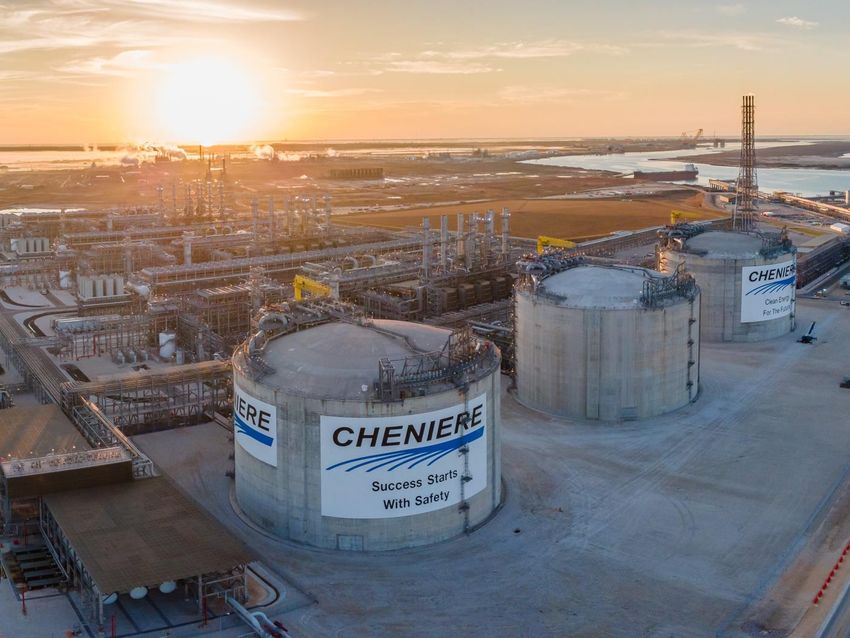
Commercial Update
Anatol Feygin, EVP and CCO
Cheniere Earnings Presentation - Third Quarter 2021 - cloudfront.net
Tight and Volatile Global Gas Market Heading Into Winter
    Global LNG Demand                                                                      LNG Capacity and Output Variance (‘21 vs. ‘19)                                   Global Energy Commodity Prices
    Global consumption of LNG grew 7% in 3Q amid intense                                   Strong US LNG supply growth continues to underpin global                         JKM and TTF reached unprecedented levels due to tight
    regional competition ahead of peak winter demand                                       supply                                                                           supply and expectations of a cold winter
        MT                                                                                        MT                                                                          $/MMBtu
35                                                                                          60                                                                               40
                                                                                            50                                                                                                                             Forward Curves
30                                                                                          40
                                                                                            30
                                                                                                                                                                             35
                                                                                            20
25
                                                                                            10
                                                                                             0
20                                                                                         (10)                                                                              30                                     TTF
                                                                                           (20)
                          5-Yr Range                    2021               2020                        US   Non-US Total        US    Non-US Total      US   Non-US Total
15
        Jan     Feb     Mar   Apr    May   Jun    Jul     Aug   Sep      Oct   Nov   Dec               Capacity Addition 1      Non-Legacy Output Δ 2    Legacy Output Δ2    25

    Global LNG Supply Variance in 3Q 2021                                                  Global LNG Demand Variance in 3Q 2021                                                                        Asia Spot
    US exports were up nearly 11 MT or 150% YoY in 3Q (3Q                                  Asian and Latin American buyers outbid European buyers                            20
                                                                                                                                                                                                          LNG
    2021 vs 3Q 2020)                                                                       for marginal LNG in 3Q 2021 (3Q 2021 vs 3Q 2020)
        MT                                                                                        MT
14                                                                                         10                                                                                15
12                                                                                                                                                                                  Oil Parity
                                                                                             8
10
                                                                                                                                                                             10
    8                                                                                        6

    6
                                                                                             4
                                                                                                                                                                              5
    4
                                                                                             2
    2
                                                                                                                                                                                     Henry Hub
    0                                                                                        0                                                                                0
             Cheniere   Rest of US   Australia   All Others     Russia     Net Supply                   Asia         Americas         MENA          Europe    Net Demand          2019           2020    2021             2022          2023

             Source: Kpler, Bloomberg (forward curves as of 10/6/2021).
8            1. Capacity Addition September 2021 vs January 2019.
             2. Non-Legacy Output and Legacy Output January-September 2021 vs 2019.
Cheniere Earnings Presentation - Third Quarter 2021 - cloudfront.net
Strong Buying in Asia Keeping Inventories Low in Europe
    Asia LNG Imports                                                                           Europe LNG Imports                                                                                        Latin America LNG Imports
    3Q LNG demand rose 10% YoY led by Korea and China                                          Imports were down 19% or 3.1 MT YoY in 3Q due to tight                                                    LNG imports increased by 107% YoY to 6.4 MT primarily
                                                                                               supply and a strong pull from Asia                                                                        from Brazil and Argentina
                                                                                                                                                                                                             MT
         MT                                                                                        MT
    30                                                                                                                                                                                                   7
                                                                                              10
                                                   5-Yr Range
                                                                                                                                                                5-Yr Range                               6
                                                   2020
                                                                                              8                                                                 2021                                     5
    25                                             2021
                                                                                                                                                                2020
                                                                                                                                                                                                         4
                                                                                              6
    20                                                                                                                                                                                                   3
                                                                                              4                                                                                                          2
    15                                                                                                                                                                                                   1
                                                                                              2
                                                                                                                                                                                                         0
    10                                                                                        0                                                                                                                   1Q   2Q   3Q    4Q    1Q   2Q     3Q       4Q    1Q     2Q     3Q
         Jan     Feb     Mar   Apr   May     Jun     Jul    Aug     Sep     Oct   Nov   Dec        Jan      Feb     Mar        Apr   May    Jun     Jul    Aug     Sep          Oct     Nov     Dec                     2019                  2020                       2021

    Asia LNG Imports 3Q 2021 vs. 3Q 2020                                                       Europe Gas Supply Variance in 3Q 2021                                                                     United States LNG Flows by Destination
    Gas burn and stock replenishment in Korea and continued                                    Limited LNG flows and lower Russian flows further                                                         Asia and Latin America contested Europe for US supplies
    growth in China underpinned Asia’s imports                                                 tightened the Q3 balance ahead of withdrawal season                                                       through 3Q 2021
          MT                                                                                        Bcf/d                                                                                                    MT
                                                                                                                                                                                                                        Asia                             Europe
    70                                                                                         45                                                                                                       10              Latin America                    Middle East - North Africa
                                                                                               44
                                                                                                                                                                                                        8
                                                                                               43
    65
                                                                                                                                                                                                        6
                                                                                               42
                                                                                                                                                                                                        4
                                                                                               41
    60
                                                                                               40                                                                                                       2

                                                                                               39                                                                                                       0
    55                                                                                         38                                                                                                                 1Q   2Q   3Q    4Q    1Q   2Q      3Q       4Q    1Q     2Q     3Q
               3Q 2020    South      China     Taiwan      Other Asia     Japan   3Q 2021                3Q 2020     Russia    Norway   Africa    Azeri   Production   Other          LNG     3Q 2021
                          Korea                                                                                    to Turkey    Pipe    Pipe      Pipe                 Russia                                           2019                      2020                    2021
                                                                                                                                                                        Pipe

9         Sources: Cheniere Research, Kpler, Commodity Essentials.
Cheniere Earnings Presentation - Third Quarter 2021 - cloudfront.net
The Pandemic “Reset” the Supply Cycle
 Historically low FIDs taken in 2015-2018 foretold a tighter market starting in 2021, further accelerated by the structural shift to natural gas

     mtpa       Variable Y-Y                      Tight                              Loose                          Tight (E)           mtpa
                                                                                                                                               Market Signaling for Additional Investment in
      90                                                                                                                                600
                                                                                                                Stalled supply and             New LNG Capacity
                                                                                                                swift demand
      80                                                                                                        recovery to extend
                                                                                                                current tightness              •   Pandemic put pressure on supply chains and
                                                                                                                                        500
                                                                                                                                                   energy systems
      70
                                                                                                                                               •   2020 was expected to be a balanced year with
      60                                                                                                                                400        expectations of market tightening beginning in
                                                                                                                                                   2021 and continuing
      50
                                                                                                        (YTD)                                  •   Pandemic moved expected timing of FIDs and
                                                                                                                                        300
                                                                                                                                                   therefore extended market supply/demand
      40
                                                                               New LNG                                                             imbalances
                                                                               supply results
      30                                                                       in period of                                             200    •   Current market is much tighter than expected on
                                                                               low FIDs                                                            various short-term supply and demand issues
      20
                                                                                                                   Low FIDs                    •   Supply/demand mismatch initially cast light on
                                                                                                                                        100
                                                                                                                   contributed                     demand uncertainty and now on supply
      10                                                                                                           to current                      uncertainty
                                                                                                                   tightness
       0                                                                                                                                0
            2007          2009          2011          2013          2015           2017          2019   2021          2023       2025

            Actual FIDs                Expected FIDs                   Trade Outlook 2021 (RHS)                  Trade Outlook 2019 (RHS)

      Source: Source: Cheniere Research estimates (July 2021), Wood Mackenzie for historical figures.
10
      Note: Shaded backgrounds represent shift vs 2019 expectations.
Financial Update
Zach Davis, SVP and CFO
Third Quarter Financial Highlights
                                                                                                                                                   Repaid $750 million of consolidated indebtedness and repurchased an
Summary Results                                                                                                                                    aggregate of 77,100 shares of common stock for ~$6 million, in line with
                                                                                                                                                   our capital allocation plan, for the nine months ended September 30, 2021
($ millions, except per share and LNG data)                               3Q 2021           2Q 2021 YTD 2021 YTD 2020
                                                                                                                                                   ~78% of 3Q 2021 physical LNG volumes recognized in income sold
Revenues                                                                    $3,200            $3,017            $9,307           $6,571
                                                                                                                                                   pursuant to long-term SPA or IPM agreements2
Income (Loss) from Operations                                             $(2,350)               $146        $(1,140)            $2,355
                                                                                                                                                   3Q 2021 impact of ~($3.1) billion related to unrealized mark-to-market
Net Income (Loss) 1                                                       $(1,084)             $(329)        $(1,020)               $109           losses on commodity and FX derivatives (pre-tax and excluding impact of
                                                                                                                                                   NCI), due to commodity curve shifts impacting the fair value of natural gas
Net Income (Loss) per Share 1                                               $(4.27)           $(1.30)           $(4.03)            $0.43
                                                                                                                                                   purchases, including IPM transactions, and forward sales of LNG
Consolidated Adjusted EBITDA                                                $1,053            $1,023            $3,528           $2,909
                                                                                                                                                  Key Financial Transactions and Updates
Distributable Cash Flow                                                      ~$390            ~$340          ~$1,480           ~$1,020            • In August 2021, Cheniere Corpus Christi Holdings, LLC issued $750 million of fully
                                                                                                                                                    amortizing 2.742% Senior Secured Notes due 2039; net proceeds used to
LNG Exported                                                                                                                                        refinance borrowings under CCH Term Loan Credit Facility due 2024

     LNG Volumes Exported (TBtu)                                                 500               496            1,476               920         • In September 2021, Cheniere Partners issued $1.2 billion of 3.25% Senior Notes
                                                                                                                                                    due 2032; net proceeds used to redeem the 2026 CQP Senior Notes and, along
     LNG Cargoes Exported                                                        141               139               413              261           with cash on hand, a portion of the 2022 SPL Senior Notes
                                                                                                                                                  • In October 2021, amended and restated $1.25 billion Revolving Credit Facility,
LNG Volumes Recognized in Income (TBtu)                                                                                                             extending maturity to 2026, lowering borrowing rate and incorporating
                                                                                                                                                    sustainability incentives
     LNG Volumes from Liquefaction Projects                                      489               508            1,439               932
                                                                                                                                                  • Year to date, SPL raised $482 million of privately-placed long-term amortizing
                                                                                                                                                    fixed rate notes due 2037, which are expected to be funded in the fourth quarter
     Third-Party LNG Volumes                                                       10                14                38               79          2021; net proceeds, along with cash on hand, will be used to redeem the
                                                                                                                                                    remaining 2022 SPL Senior Notes
     Note: Consolidated Adjusted EBITDA and Distributable Cash Flow are non-GAAP measures. A definition of these non-GAAP measures and a reconciliation to Net income attributable to common stockholders, the most comparable U.S. GAAP measure, is
     included in the appendix. Total margins as used herein refers to total revenues less cost of sales.
12   1.    Reported as Net income attributable to common stockholders and Net income per share attributable to common stockholders – diluted on our Consolidated Statement of Operations.
     2.    Percentage calculated based on physical LNG volumes recognized in income. Long-term refers to any agreement with an initial term of ~15 years or longer.
2021 and 2022 Financial Guidance

     Full Year 2021 Guidance                                                                                                                Full Year 2022 Guidance

        ($ billions, except per unit data)                                                                                                       ($ billions, except per unit data)

        Consolidated Adjusted EBITDA                                                    $4.6            -            $5.0                        Consolidated Adjusted EBITDA                                                   $5.8             -           $6.3

        Distributable Cash Flow                                                         $1.8            -            $2.1                        Distributable Cash Flow                                                        $3.1             -           $3.6

        CQP Distribution per Unit                                                    $2.60              -         $2.70                          CQP Distribution per Unit                                                    $3.00              -          $3.25

                                                                                                                                                        FY 2022 subject to volatility of global gas market prices, specific
           Increased EBITDA guidance range driven largely by improved global                                                                          timing of completion of Sabine Pass Train 6, and timing of cargoes
                 LNG pricing and strong execution of forward LNG sales                                                                                      scheduled to be delivered in year-end 2021/early 2022

             2021 EBITDA range slightly wider due to several high-value CMI                                                                       150 Tbtu open; Forecast $1 change in market margin would impact FY
         cargoes scheduled to be delivered around year-end and early next year                                                                      2022 Consolidated Adjusted EBITDA by less than $150 million; a
                                                                                                                                                       portion of open capacity reserved for long-term origination

                                                                        2022 Financial Guidance Above 9-Train Run Rate Metrics

      Note: Consolidated Adjusted EBITDA and Distributable Cash Flow are non-GAAP measures. A definition of these non-GAAP measures and a reconciliation to Net income (loss) attributable to common stockholders, the most comparable U.S. GAAP measure,
13    is included in the appendix.
Cheniere Earnings Presentation
Third Quarter 2021

November 4, 2021

NYSE American: LNG
Appendix
Cheniere LNG Exports
 Over 1,800 Cargoes (>135 Million Tonnes) Exported from our Liquefaction Projects

                                                                                                                      Cheniere LNG Exports by Destination
                                                                                                            MT
                                                                                                       12
                                                                                                       10
                                                                                                       8
                                                                                                       6
                                                                                                       4
                                                                                                       2
                                                                                                       0
                                                                                                                 1Q      2Q          3Q      4Q        1Q     2Q     3Q

                                                                                                                              2020                            2021

                                                                                                                         Europe      Asia   Latin America   MENA

                                                                   Cheniere Destinations

     Sources: Cheniere Research, Kpler.
16
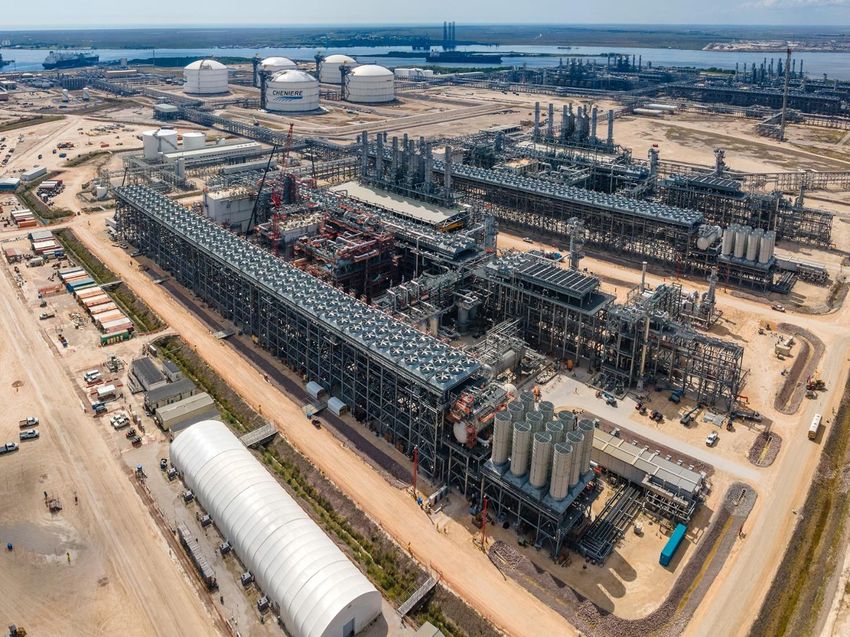
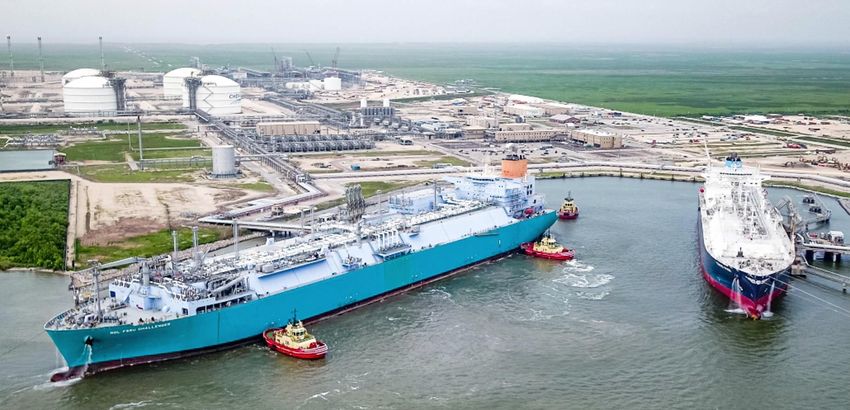
     Note: Cumulative cargoes and volumes as of October 31, 2021. MENA – Middle East & North Africa.
Industry Leading U.S. LNG Export Platform

                                                      Corpus Christi LNG Terminal                                Sabine Pass Liquefaction
                                                      ~15 mtpa Total Production Capacity                       ~30 mtpa Total Production Capacity

                                          Trains 1-2 operating, contracts with long-term buyers      Trains 1-5 operating, contracts with long-term buyers
                                          commenced                                                  commenced
            >1,500 Employees
           6 Offices Worldwide            Train 3 operating, completed March 2021                    Train 6 commissioning, est. completion 1Q 2022
     Houston | London | Washington D.C.   ~10+ mtpa Stage 3 expansion project shovel-ready           Trains 1-5 delivered ahead of schedule and within
         Singapore | Beijing | Tokyo                                                                 budget
                                          Trains 1-3 delivered ahead of schedule and within budget

17
Sabine Pass Update

     Liquefaction Operations
     5 Trains in operation
     Increased production via maintenance
     optimization and debottlenecking
     >1,400 cargoes produced and exported

     Growth
     Train 6 commissioning activities commenced
     •      Expected completion 1Q 2022
     •      Project completion 97.1%
     3rd berth construction underway
                                                                                                         Sabine Pass Train 6 in foreground

18   Note: Cumulative cargoes as of October 31, 2021. Project completion percentage as of September 30, 2021.
Corpus Christi Update

     Liquefaction Operations
     3 Trains in operation
     Increased production via maintenance
     optimization and debottlenecking
     >380 cargoes produced and exported

     Growth
     ~10+ mtpa Stage 3 expansion project fully
     permitted
     ~6 mtpa of available long-term contracts to
     support Stage 3

19   Note: Cumulative cargoes as of October 31, 2021.
Cheniere Corporate Structure

                                                                                                                     Cheniere Energy, Inc.
                                                                                                                    (NYSE American: LNG)

                                                                     CQP GP                                                                                              Cheniere Corpus
                                                                                                                      Cheniere Marketing
                                                                     (& IDRs)                                                                                            Christi Holdings

                                                           Cheniere Energy
                                                                                                                                                             Corpus Christi           Cheniere Corpus
                                                             Partners, L.P.
                                                                                                                                                              Liquefaction             Christi Pipeline
                                                         (NYSE American: CQP)

                                                              Cheniere Creole                                       Sabine Pass
           Sabine Pass LNG
                                                               Trail Pipeline                                       Liquefaction

                  Publicly Traded Equity
                  Operating Entity
                  Non-Operating Entity

20   Note: This organizational chart is provided for illustrative purposes only, is not and does not purport to be a complete organizational chart of Cheniere.
Run Rate Guidance

                                                                                                                                                                                                                          9 Trains
                                                                                                                                                                                                                          (Full Year)
                                                                                                                                                                                                                           SPL T1-6
                ($billions, except per share and per unit amounts or unless otherwise noted)                                                                                                                               CCL T1-3

              CEI Consolidated Adjusted EBITDA                                                                                                                                                                      $5.3 - $5.7

                    Less: Distributions to CQP Non-Controlling Interest                                                                                                                                       ($0.9) – ($1.0)

                    Less: CQP Interest Expense / SPL Interest Expense / Other                                                                                                                                                 ($1.0)

                    Less: CEI Interest Expense / CCH Interest Expense / Other                                                                                                                                                 ($0.8)

              CEI Distributable Cash Flow                                                                                                                                                                           $2.6 - $3.0

              CEI Distributable Cash Flow per Share1                                                                                                                                                        $10.25 - $11.75

              CQP Distributable Cash Flow per Unit                                                                                                                                                             $3.75 - $3.95

     Note: Numbers may not foot due to rounding. Range driven by production range of 4.9 – 5.1 MTPA per train and marketing margin of $2.00 - $2.50 / MMBtu. Additional assumptions include 80/20 profit-sharing tariff with SPL/CCH projects,
     $3.00 / MMBtu Henry Hub, 5.00% interest rates for refinancings, and assignment of an additional SPA to SPL as committed by CEI prior to Train 6 substantial completion. Average tax rate as percentage of pre-tax cash flow expected to be 0-5% in
     the 2020s and 15-20% in the 2030s. Consolidated Adjusted EBITDA, Distributable Cash Flow, Distributable Cash Flow per Share and Distributable Cash Flow per Unit are non- GAAP measures. A definition of these non-GAAP measures is included in
     the appendix. We have not made any forecast of net income on a run rate basis, which would be the most directly comparable measure under GAAP, in part because net income includes the impact of derivative transactions, which cannot be
     determined at this time, and we are unable to reconcile differences between these run rate forecasts and net income.
     1. Assumed share count of ~255mm shares.

21
Cheniere Debt Summary
                               Cash Balance: ~$2.2B1,3

                                                                                                                Cheniere Energy, Inc.
Cheniere Energy, Inc.
~$0.63B Convertible Notes due 2045 (4.250%)                                                                    (NYSE American: LNG)
$2.0B Senior Notes due 2028 (4.625%)                                                                                                                                                                   Cheniere Corpus Christi Holdings, LLC
$1.25B Senior Secured Revolving Credit Facility due 20264                                                                                                                                              $1.25B Notes due 2024 (7.000%)
                                                                                                                                                                                                       $1.5B Notes due 2025 (5.875%)
                                                                                                                                                                                                       $1.5B Notes due 2027 (5.125%)
                                                                                                                                                                                                       $1.5B Notes due 2029 (3.700%)
                                                                         CQP GP                                                                                  Cheniere Corpus                       ~$2.7B Notes due 20392
                                                                                                                 Cheniere Marketing                                                                    $1.2B Working Capital Facility due 2023
                                                                         (& IDRs)                                                                                Christi Holdings                      ~$1.76B Credit Facility due 2024

 Cheniere Energy Partners, L.P.
 $0.4B Notes due 2026 (5.625%)3
 $1.5B Notes due 2029 (4.500%)                                 Cheniere Energy
 $1.5B Notes due 2031 (4.000%)                                                                                                                 Corpus Christi                          Cheniere Corpus
 $1.2B Notes due 2032 (3.250%)                                   Partners, L.P.
                                                                                                                                                Liquefaction                            Christi Pipeline
 $0.75B Senior Secured Revolving Credit
 Facility due 2024
                                                             (NYSE American: CQP)

                                                                                                                                                             Sabine Pass Liquefaction, LLC
                                                                  Cheniere Creole                                      Sabine Pass                           $1.0B Notes due 2022 (6.250%)3
                Sabine Pass LNG                                                                                                                              $1.5B Notes due 2023 (5.625%)
                                                                   Trail Pipeline                                      Liquefaction                          $2.0B Notes due 2024 (5.750%)
                                                                                                                                                             $2.0B Notes due 2025 (5.625%)
                                                                                                                                                             $1.5B Notes due 2026 (5.875%)
                                                                                                                                                             $1.5B Notes due 2027 (5.000%)                             Publicly Traded Equity
Note: This organizational chart is provided for illustrative purposes only, is not and does not purport to be a complete organizational chart of Cheniere.
                                                                                                                                                             $1.35B Notes due 2028 (4.200%)                            Operating Entity
Total commitments for Term Loan, Credit, and Working Capital facilities are shown above and are inclusive of undrawn balances.
1. Unrestricted cash balance as of September 30, 2021. Includes unrestricted cash of $1.7 billion held by Cheniere Energy Partners, L.P.                     $2.0B Notes due 2030 (4.500%)
2. Includes 4 separate tranches of notes reflecting a range of interest rates from 2.742% to 4.800%.                                                         $0.8B Notes due 2037 (5.000%)                             Non-Operating Entity
3. In October 2021, the remaining net proceeds from the new 2032 CQP Notes were used to redeem the remaining amount of the 2026 CQP Notes and                $1.2B Working Capital Facility due 2025
     $0.3 billion of the 2022 SPL Notes, together with cash on hand.
4. The facility was amended and restated on October 28, 2021, extending the maturity to 2026.

22
Consolidated Adjusted EBITDA

Reconciliation to Non-GAAP Measures
                                                                                                                                                                  The following table reconciles our Consolidated Adjusted EBITDA to U.S. GAAP results for the three months ended
                                                                                                                                                                  June 30, 2021 and three and nine months ended September 30, 2021 and 2020 (in millions):
                                                                                                                                                                                                                                     Three Months Ended             Three Months                    Nine Months Ended
                                                                                                                                                                                                                                        September 30,               Ended June 30,                    September 30,
                                                                                                                                                                                                                                     2021          2020                  2021                      2021           2020

Regulation G Reconciliations                                                                                                                                      Net income (loss) attributable to common
                                                                                                                                                                  stockholders
                                                                                                                                                                                                                                 $       (1,084)    $     (463)     $          (329)         $      (1,020)        $           109
This presentation contains non-GAAP financial measures. Consolidated Adjusted EBITDA, Distributable Cash Flow, Distributable Cash Flow per Share, and                Net income (loss) attributable to non-controlling
                                                                                                                                                                                                                                           168             (45)                 198                       544                  390
Distributable Cash Flow per Unit are non-GAAP financial measures that we use to facilitate comparisons of operating performance across periods. These non-           interest
GAAP measures should be viewed as a supplement to and not a substitute for our U.S. GAAP measures of performance and the financial results calculated in             Income tax provision (benefit)                                      (1,860)          (75)                  (93)                (1,864)                    119
accordance with U.S. GAAP and reconciliations from these results should be carefully evaluated.                                                                      Interest expense, net of capitalized interest                          364           355                   368                  1,088                   1,174
Consolidated Adjusted EBITDA is commonly used as a supplemental financial measure by our management and external users of our consolidated financial                 Loss on modification or extinguishment of debt                         36            171                        4                     95                  215
statements to assess the financial performance of our assets without regard to financing methods, capital structures, or historical cost basis. Consolidated
Adjusted EBITDA is not intended to represent cash flows from operations or net income as defined by U.S. GAAP and is not necessarily comparable to similarly         Interest rate derivative loss, net                                       2            —                      2                      3                     233
titled measures reported by other companies.                                                                                                                         Other expense (income), net                                             24           129                    (4)                    14                     115
                                                                                                                                                                  Income (loss) from operations                      $                   (2,350)    $      72       $           146          $      (1,140)        $         2,355
We believe Consolidated Adjusted EBITDA provides relevant and useful information to management, investors and other users of our financial information in
                                                                                                                                                                  Adjustments to reconcile income from operations to
evaluating the effectiveness of our operating performance in a manner that is consistent with management’s evaluation of financial and operating performance.     Consolidated Adjusted EBITDA:
Consolidated Adjusted EBITDA is calculated by taking net income attributable to common stockholders before net income attributable to non-controlling                Depreciation and amortization expense                                 259            233                   258                       753                  699
interest, interest expense, net of capitalized interest, changes in the fair value and settlement of our interest rate derivatives, taxes, depreciation and          Loss (gain) from changes in fair value of
                                                                                                                                                                                                                                          3,115           140                   591                  3,826                     (300)
amortization, and adjusting for the effects of certain non-cash items, other non-operating income or expense items, and other items not otherwise predictive or      commodity and FX derivatives, net (1)
indicative of ongoing operating performance, including the effects of modification or extinguishment of debt, impairment expense and loss on disposal of             Total non-cash compensation expense                                    28              26                     29                      89                    82
assets, changes in the fair value of our commodity and FX derivatives prior to contractual delivery or termination, non-cash compensation expense, and non-          Impairment expense and loss (gain) on disposal
                                                                                                                                                                                                                                              1             —                      (1)                     —                      5
recurring costs related to our response to the COVID-19 outbreak which are incremental to and separable from normal operations. The change in fair value of          of assets
commodity and FX derivatives is considered in determining Consolidated Adjusted EBITDA given that the timing of recognizing gains and losses on these                Incremental costs associated with COVID-19
                                                                                                                                                                                                                                             —               6                     —                       —                     68
                                                                                                                                                                     response
derivative contracts differs from the recognition of the related item economically hedged. We believe the exclusion of these items enables investors and other
users of our financial information to assess our sequential and year-over-year performance and operating trends on a more comparable basis and is consistent      Consolidated Adjusted EBITDA                       $                   1,053      $     477       $         1,023          $       3,528         $         2,909
with management’s own evaluation of performance.                                                                                                                  (1) Change in fair value of commodity and FX derivatives prior to contractual delivery or termination

Distributable Cash Flow in 2021 is defined as cash received, or expected to be received, from Cheniere’s ownership and interests in CQP and Cheniere Corpus
                                                                                                                                                                  Consolidated Adjusted EBITDA and Distributable Cash Flow
Christi Holdings, LLC, cash received (used) by Cheniere’s integrated marketing function (other than cash for capital expenditures) less interest, taxes and
maintenance capital expenditures associated with Cheniere and not the underlying entities. Management uses this measure and believes it provides users of         The following table reconciles our actual Consolidated Adjusted EBITDA and Distributable Cash Flow to Net income
our financial statements a useful measure reflective of our business’s ability to generate cash earnings to supplement the comparable GAAP measure.               (loss) attributable to common stockholders for the three months ended June 30, 2021, the three and nine months
                                                                                                                                                                  ended September 30, 2021 and 2020, and forecast amounts for full year 2021 (in billions):
CQP Distributable Cash Flow is defined as CQP Adjusted EBITDA adjusted for taxes, maintenance capital expenditures, interest expense net of capitalized
                                                                                                                                                                                                                       Three Months Ended            Three Months           Nine Months Ended
interest, interest income, and changes in the fair value and non-recurring settlement of interest rate derivatives.                                                                                                       September 30,             Ended June 30,            September 30,                       Full Year
Distributable Cash Flow per Share and Distributable Cash Flow per Unit are calculated by dividing Distributable Cash Flow by the weighted average number of                                                            2020              2021           2021                2020             2021                       2021
common shares or units outstanding.                                                                                                                               Net income (loss) attributable to common
                                                                                                                                                                                                            $           (0.46)       $    (1.08)    $      (0.33)       $     0.11       $       (1.02)     $ (1.5)      - $ (1.1)
                                                                                                                                                                  stockholders
We believe Distributable Cash Flow is a useful performance measure for management, investors and other users of our financial information to evaluate our            Net income (loss) attributable to non-
performance and to measure and estimate the ability of our assets to generate cash earnings after servicing our debt, paying cash taxes and expending                controlling interest
                                                                                                                                                                                                                        (0.05)             0.17             0.20              0.39               0.54           0.7      -      0.8
sustaining capital, that could be used for discretionary purposes such as common stock dividends, stock repurchases, retirement of debt, or expansion capital        Income tax provision (benefit)                     (0.08)             (1.86)          (0.09)             0.12               (1.86)         (0.4)    -     (0.3)
expenditures.                                                                                                                                                        Interest expense, net of capitalized
                                                                                                                                                                     interest
                                                                                                                                                                                                                         0.36              0.36             0.37              1.17               1.09            1.5     -      1.5
Distributable Cash Flow is not intended to represent cash flows from operations or net income (loss) as defined by U.S. GAAP and is not necessarily comparable
to similarly titled measures reported by other companies.                                                                                                            Depreciation and amortization
                                                                                                                                                                     expense
                                                                                                                                                                                                                         0.23              0.26             0.26              0.70               0.75            1.0     -      1.0
Non-GAAP measures have limitations as an analytical tool and should not be considered in isolation or in lieu of an analysis of our results as reported under        Other expense, financing costs, and
GAAP and should be evaluated only on a supplementary basis.                                                                                                          certain non-cash operating expenses
                                                                                                                                                                                                                         0.47              3.21             0.62              0.42               4.03           3.3      -      3.1

                                                                                                                                                                  Consolidated Adjusted EBITDA                     $     0.48        $     1.05     $       1.02        $     2.91       $       3.53       $ 4.6        - $ 5.0
Note:                                                                                                                                                               Distributions to Cheniere Partners
We have not made any forecast of net income on a run rate basis, which would be the most directly comparable financial measure under GAAP, in part because          non-controlling interest
                                                                                                                                                                                                                        (0.16)             (0.17)          (0.16)            (0.47)              (0.49)         (0.6)    -     (0.8)
net income includes the impact of derivative transactions, which cannot be determined at this time, and we are unable to reconcile differences between run rate     SPL and Cheniere Partners cash
                                                                                                                                                                                                                         0.01              (0.32)          (0.34)            (0.99)              (1.10)         (1.5)    -     (1.4)
Consolidated Adjusted EBITDA and Distributable Cash Flow and income.                                                                                                retained and interest expense
                                                                                                                                                                    Cheniere interest expense, income tax
                                                                                                                                                                    and other
                                                                                                                                                                                                                        (0.14)             (0.18)          (0.18)            (0.43)              (0.46)         (0.7)    -     (0.7)
                                                                                                                                                                  Cheniere Distributable Cash Flow        $              0.19        $     0.39     $       0.34        $     1.02       $       1.48       $ 1.8        - $ 2.1
                                                                                                                                                                  Note: Totals may not sum due to rounding.

         23
Reconciliation to Non-GAAP Measures (continued)
Regulation G Reconciliations (continued)
Beginning with our 2022 financial guidance, we have adopted a revised definition for Distributable Cash Flow, which aims to more accurately reflect
the consolidated distributable cash flow of each of our subsidiaries, including Cheniere Partners. The revised definition reflects the distributable     Consolidated Adjusted EBITDA and Distributable Cash Flow
cash flow of Cheniere Partners before the impacts from capital allocation, less amounts attributable to minority interests. There is no change to our
run-rate distributable cash flow guidance as a result of this definition change.                                                                         The following table reconciles our Consolidated Adjusted EBITDA and Distributable Cash Flow to
Distributable Cash Flow for 2022 and going forward is defined as cash generated from the operations of Cheniere and its subsidiaries and adjusted
for non-controlling interest. The Distributable Cash Flow of Cheniere’s subsidiaries is calculated by taking the subsidiaries’ EBITDA less interest
                                                                                                                                                         Net income attributable to common stockholders for the forecast amounts for full year 2022 (in
expense, net of capitalized interest, interest rate derivatives, taxes, maintenance capital expenditures and other non-operating income or expense       billions):
items, and adjusting for the effect of certain non-cash items and other items not otherwise predictive or indicative of ongoing operating
performance, including the effects of modification or extinguishment of debt, amortization of debt issue costs, premiums or discounts, changes in
fair value of interest rate derivatives, impairment of equity method investment and deferred taxes. Cheniere’s Distributable Cash Flow includes 100%                                                                                                   Full Year
of the Distributable Cash Flow of Cheniere’s wholly-owned subsidiaries. For subsidiaries with non-controlling investors, our share of Distributable
                                                                                                                                                                                                                                                            2022
Cash Flow is calculated as the Distributable Cash Flow of the subsidiary reduced by the economic interest of the non-controlling investors as if
100% of the Distributable Cash Flow were distributed in order to reflect our ownership interests and our incentive distribution rights, if applicable.   Net income attributable to common stockholders                                            $ 1.4     - $ 1.8
The Distributable Cash Flow attributable to non-controlling interest is calculated in the same method as Distributions to non-controlling interest as      Net income attributable to non-controlling interest                                       1.0     -   1.2
presented on Statements of Stockholders’ Equity. This amount may differ from the actual distributions paid to non-controlling investors by the
subsidiary for a particular period.                                                                                                                        Income tax provision                                                                      0.7     -   0.8
CQP Distributable Cash Flow is defined as CQP Adjusted EBITDA adjusted for taxes, maintenance capital expenditures, interest expense net of                Interest expense, net of capitalized interest                                             1.5     - 1.5
capitalized interest, interest income, and changes in the fair value and non-recurring settlement of interest rate derivatives.                            Depreciation and amortization expense                                                     1.1     - 1.1
Distributable Cash Flow per Share and Distributable Cash Flow per Unit are calculated by dividing Distributable Cash Flow by the weighted average          Other expense (income), financing costs, and certain non-cash operating expenses          0.1     - (0.1)
number of common shares or units outstanding.
                                                                                                                                                         Consolidated Adjusted EBITDA                                                              $ 5.8     - $ 6.3
We believe Distributable Cash Flow is a useful performance measure for management, investors and other users of our financial information to
evaluate our performance and to measure and estimate the ability of our assets to generate cash earnings after servicing our debt, paying cash
                                                                                                                                                           Interest expense (net of capitalized interest and amortization) and realized interest
                                                                                                                                                           rate derivatives                                                                         (1.4)    - (1.4)
taxes and expending sustaining capital, that could be used for discretionary purposes such as common stock dividends, stock repurchases,
retirement of debt, or expansion capital expenditures.                                                                                                     Maintenance capital expenditures, income tax and other                                   (0.4)    - (0.2)
Distributable Cash Flow is not intended to represent cash flows from operations or net income (loss) as defined by U.S. GAAP and is not necessarily      Consolidated Distributable Cash Flow                                                      $ 4.0     - $ 4.7
comparable to similarly titled measures reported by other companies.                                                                                       CQP distributable cash flow attributable to noncontrolling interests                     (0.9)    - (1.1)
Non-GAAP measures have limitations as an analytical tool and should not be considered in isolation or in lieu of an analysis of our results as           Cheniere Distributable Cash Flow                                                          $ 3.1     - $ 3.6
reported under GAAP and should be evaluated only on a supplementary basis.
                                                                                                                                                         Note: Totals may not sum due to rounding.

          24
Investor Relations Contacts

Randy Bhatia
Vice President, Investor Relations – (713) 375-5479, randy.bhatia@cheniere.com

Frances Smith
Manager, Investor Relations – (713) 375-5753, frances.smith@cheniere.com

Zak Broderick
Senior Analyst, Investor Relations – (713) 375-5308, zak.broderick@cheniere.com

© 2021 Cheniere Energy, Inc. All Rights Reserved
You can also read