Childhood asthma in New Zealand: the impact of ongoing socioeconomic disadvantage (2010-2019)
←
→
Page content transcription
If your browser does not render page correctly, please read the page content below
article

       Childhood asthma in
     New Zealand: the impact
    of ongoing socioeconomic
    disadvantage (2010–2019)
Deborah Schlichting, Tayaza Fadason, Cameron C Grant, Justin O’Sullivan

                                            ABSTRACT
  AIM: To document trends in number and cost of asthma hospital admissions and asthma prescriptions
  in children (0–14 years) from 2010–2019 in New Zealand.
  METHOD: A retrospective analysis of public hospital admission and pharmaceutical prescription data.
  RESULTS: The dataset included 39,731 hospitalisations with asthma as a discharge diagnosis and
  5,512,856 prescriptions for asthma medication in children ≤14 years old. From 2010 to 2019, there
  was a 45% reduction in the number of asthma hospitalisations and an 18% reduction in prescriptions
  attributable to asthma. Declines were evident for both Māori and non-Māori children. However, Māori
  children were hospitalised with asthma at twice the rate of non-Māori children (7.2/1,000 versus
  3.5/1,000, p
article

41/100,000.6 The prevalence of childhood
asthma in New Zealand in 2019 was
                                                               Methods
estimated to be 13% by the New Zealand           Ethics
Health Survey, which used a case definition        Permission to use the data was provided
dependent on each child’s parents or care-       by the Ministry of Health. This study did
givers having ever been told by a doctor         not require submission to the Health and
that the child has asthma and whether            Disability Ethics Commission (HDEC) as it is
the child is currently taking treatments         not within the scope of HDEC review. Confir-
for asthma (inhalers, medicine, tablets          mation of this was received from HDEC on 9
or pills).7 The asthma prevalence among          August 2019.
Māori children (16%), New Zealand’s indig-
                                                 New Zealand administrative health
enous population, was higher than that
observed for children of non-Māori ethnic-
                                                 data
                                                    De-identified New Zealand administrative
ities. That Māori children have higher
                                                 health data from January 2010 to December
asthma morbidity8 and mortality9 rates
                                                 2019 were accessed through the Ministry of
was already documented over thirty years
                                                 Health. All paediatric administrative data
ago. Critically, in 2019, the Global Burden
                                                 from across New Zealand were analysed for
of Disease10 reported the rate of deaths due
                                                 patterns of hospitalisation and medication
to childhood asthma in New Zealand was
                                                 prescription for asthma among children
nearly four times higher than the global
                                                 aged 0–14 years. All demographic infor-
rate for children in the 10–14-year age
                                                 mation was extracted using the national
group, at 3.06% compared to 0.70%.10 For
                                                 health index number (NHI), a unique iden-
children aged 5–9 years, the proportion of
                                                 tifier assigned to each individual in New
disability-adjusted life years (DALY) due
                                                 Zealand at birth or on their first contact with
to asthma in New Zealand (8.95% of total
                                                 the healthcare system. These demographic
DALYs) is 3.6 times higher than the global
                                                 data included an individual’s sex, date of
rate for children aged 5–9 years.10
                                                 birth, self-reported prioritised ethnicity and
  There exist various efforts to assess the      NZDep2013,15 an indicator of neighbourhood
evidence on resource use and costs among         socioeconomic deprivation derived from
people with asthma in New Zealand.11–14 A        variables collected at the New Zealand 2013
1989 estimate11 put the combined cost of         national census. Neighbourhood socioeco-
asthma hospitalisations and medications in       nomic deprivation was categorised into
New Zealand at $102.3m per annum. The            quintiles.
annual cost of asthma hospitalisations and
                                                    De-identified child data were stratified by
medications in New Zealand was estimated
                                                 age and ethnic group. Age groups were ≤4
to be $349m per annum in 2001,14 $799m12 in
                                                 years, 5–9 years and 10–14 years. Neonates
2015 and over $1 billion in 2018.13 Therefore,
                                                 (age
article
(NMDS)16 and prescription data from the Cost of illness
Pharmaceutical Collection.17. The Pharma- We use a cost-of-illness approach to
ceutical Collection records all subsidised estimate the cost of paediatric asthma in
prescription medications dispensed from New Zealand. Consistent with published
community pharmacies in New Zealand. In studies on the cost of asthma in New
New Zealand, all prescription asthma medi- Zealand,11 we included only the major
cations are subsidised for children. direct costs of prescription medication and
Asthma hospitalisations were defined as hospital admission. In contrast to others,21
any admission to a public hospital with a we did not include indirect or intangible
discharge diagnosis of asthma. Asthma was costs.
defined using ICD-10-AM18 system clinical Hospitalisation costs, adjusted for inflation
codes (Table 1). Admissions with a diagnosis and reported in 2019/20 financial year terms
of wheezing (R06.2) were not included in ($FY2019/20), were derived by multiplying
asthma admissions. the case weight of each admission (supplied
Asthma-medication prescriptions were in the NMDS) by the annual purchase unit
identified in the pharmaceutical claims price for 2019/20 (Appendix Table 2).22
data using the PHARMAC schedule19 and The Ministry of Health pharmaceutical
the New Zealand Formulary for Children claims data includes information on the cost
(NZFC)20 (Appendix Table 1). PHARMAC, New of each prescription. The cost value used in
Zealand’s national drug-buying agency, clas- this analysis is the GST-exclusive subsidy,
sifies all medications by therapeutic group. as listed in the Pharmaceutical Schedule,
We used a three-stage identification process: that district health boards reimburse
(1) prescriptions were selected first from pharmacies. These values were inflation
‘Respiratory system and allergies’ in Ther- adjusted, and all prescription costs are
apeutic Group 1; (2) medications specific to reported in real values for the financial year
paediatric asthma were identified in Thera- 2019/20 ($FY2019/20). We retrieved inflation
peutic Group 2; (3) asthma medication was data from Stats NZ23 using the first quarter
stratified into preventer and reliever groups of 2010 as the index base period.
based on classification in the NZFC.20 Not all
medications used in the treatment of asthma Statistical methods
are listed under the respiratory systems For conventional statistical tests,
therapeutic group. Therefore, additional continuous variables were compared
medications (ie, prednisone and prednis- using Mann–Whitney tests, and cate-
olone (from therapeutic group ‘Hormone gorical data were compared using Fisher’s
preparations’) and omalizumab (from exact tests and chi-squared tests. Simple
therapeutic group ‘Oncology agents’)) were linear regression and a nonparametric
included in this analysis to capture the full loess regression were performed to assess
spectrum of asthma medication used to treat whether changes in best practice and
paediatric asthma. public health policy measures may have
Table 1: ICD-10-AM codes for identifying asthma admissions, including primary and secondary diagno-
ses, for children aged 0–14 years in New Zealand, 2010–2019.
ICD10 code Definition Number of admissions
2010–2019
J45.0 Predominantly allergic asthma 307
J45.1 Non-allergic asthma 389
J45.8 Mixed asthma 3
J45.9 Asthma, unspecified 37,681
J46 Status asthmaticus 1,351
(including acute severe asthma)
Total 39,731
82
NZMJ 16 April 2021, Vol 134 No 1533
ISSN 1175-8716 © NZMA
www.nzma.org.nz/journalarticle
contributed to the observed reductions was greater than 1.5:1.0 in all age groups
in childhood-asthma hospitalisation and in all years (Figure 2B). This is despite an
prescription. Statistical significance was aggregate 47% reduction in asthma hospi-
set at p≤0.05. All analysis for this study talisation rates, across all groups, between
was generated using SAS Enterprise Guide 2010 and 2019.
software v7.15.24 Poverty is a known risk factor for respi-
ratory illness and asthma.25 Consistent with
Results this, asthma admission rates for children
Discharge codes identified 32% of all from families living in the most deprived
childhood hospitalisations (2010–2019) quintile of neighbourhoods were, on
as having ICD-10-AM codes related to the average, 2.8 times higher than for children
respiratory system. Asthma accounted for living in the least deprived areas (Figure
4% of paediatric hospitalisations and 11% 3). The difference between admissions for
of paediatric respiratory hospitalisations. children in families from the least and most
There were 39,731 paediatric admissions to deprived areas deprivation scores remained
hospital with an asthma discharge diagnosis constant between 2010 and 2019.
(2010–2019). Seasonal fluctuations in number of asthma
Asthma admissions as a proportion of admissions were larger for children living in
all respiratory admissions declined from the most versus the least deprived quintile
16% (n=5,104, 2010) to 8% (n=2,811, 2019). of neighbourhoods and were evident from
At the population level, there was a 62% 2010–2019 (Figure 4). The difference in
reduction in asthma admissions for the number of asthma admissions between
youngest children (those agearticle
Figure 2: Asthma hospitalisation rates in New Zealand children by ethnic group and age group. (A)
Asthma hospitalisation rates for children of Māori and non-Māori ethnicities age 0–14 years, 2011–2019.
(B) Ratio of Māori to non-Māori for asthma hospitalisation rates by age group, 2010–2019.
Figure 3: Number of admissions for asthma, children aged 0–14 years, by neighbourhood deprivation,
2010–2019.
84
NZMJ 16 April 2021, Vol 134 No 1533
ISSN 1175-8716 © NZMA
www.nzma.org.nz/journalarticle of their first admission was larger for children acute management (reliever medications), of Māori (18%) compared with non-Māori accounted for 33% (n=2,431,048) of all respi- (14%) ethnicity (p
article

Figure 5: (A) Length of hospital stay for children (0–14 years) admitted to hospital with asthma by ad-
mission year (2010–2019). (B) Comparison of length of hospital stay for children of Māori and non-Māori
ethnicities from 2010–2019. (C) Proportions of children readmitted with asthma within 90 days of first
hospital discharge, by admission year.

                                                86
                                                                                   NZMJ 16 April 2021, Vol 134 No 1533
                                                                                   ISSN 1175-8716        © NZMA
                                                                                   www.nzma.org.nz/journal
article
Figure 6: Corticosteroids as a proportion of child asthma prescriptions by ethnic group from 2010 to
2019.
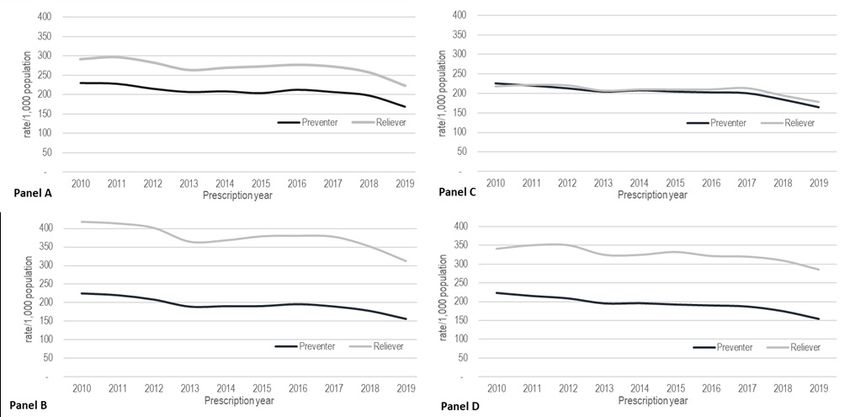
Figure 7:Prescriptions for asthma-preventer and -reliever medications: children of Māori versus non-
Māori ethnicity, in most and least deprived neighbourhood quintile of deprivation areas, 2010–2019.
(Panel A) Māori children in the least deprived quintile. (Panel B) Māori children in the most deprived
quintile. (Panel C) Non-Māori children in the least deprived quintile. (Panel D) Non-Māori children in
the most deprived quintile.
Figure 8: Asthma-preventer and -reliever medication costs, prescriptions for children aged 0–14 years,
2010–2019.
87
NZMJ 16 April 2021, Vol 134 No 1533
ISSN 1175-8716 © NZMA
www.nzma.org.nz/journalarticle
reliever to preventer prescriptions (1.97). asthma treatment, made up of hospital
Asthma-medication treatment costs for admissions and community pharmacy
children in the most deprived quintile of prescriptions, was $165m. Of this, $103m
neighbourhoods were double those for was for hospital admissions and $62m for
children living in the least deprived quintile community pharmacy prescriptions (Table
of neighbourhoods (Figure 10), suggesting 2). Notably, there was a 32% reduction in
that their asthma is more symptomatic and the annual hospital admission costs from
they require more asthma medications and/ 2010 to 2019.
or for longer. At a per capita level of spending on
The total hospitalisation cost for children asthma prescriptions, there was little
(aged 0 to 14 years) admitted for all respi- difference between prescription spending
ratory conditions was $1.2bn between 2010 for children of Māori versus non-Māori
and 2010. Asthma hospitalisation costs ethnicity. However, asthma hospitalisation
ranged from $2,436/admission (2010) to costs for Māori children were typically
$2,798 (2015), for an average annual spend double that of a non-Māori child (Figure 11).
of $10.3m from 2010–2019 (Figure 9). This indicates that Māori children require
In total, we estimate that from 2010 longer and/or more complex care for their
to 2019 the direct costs of paediatric asthma.
Figure 9: Average cost per asthma hospitalisation, children aged 0–14 years, 2010–2019.
Figure 10: Total combined direct costs of asthma treatment (hospital admissions and community
pharmacy prescriptions) for children age 0–14 years living in the most (NZDep Q5) and least (NZDep Q1)
quintile of neighbourhoods, 2010–2019.
88
NZMJ 16 April 2021, Vol 134 No 1533
ISSN 1175-8716 © NZMA
www.nzma.org.nz/journalarticle
Policy influence on asthma asthma declined by 18% over the same
period. There are clear inequities in the
incidence
health outcomes of New Zealand children
Various health-related policy measures
with asthma. To the extent that prescription
were implemented over the period 2010–
patterns reflect primary care patterns
2019, some of which may potentially have
and hospital admissions reflect shortfalls
exerted an influence on paediatric asthma
in primary care,6 our analyses suggest
hospitalisations. For example, lowering
that many New Zealand children are not
the age for free general practitioner (GP)
receiving sufficient quality healthcare to
care and changes in the asthma diagnosis
optimise management of their asthma.
protocol for children. Best practice guide-
Māori children and children living in the
lines for children agedarticle
Figure 11: Per capita real costs of asthma treatment: hospitalisations and prescriptions for
children of Māori and non-Māori ethnicity aged 0-14 years, 2010–2019.
Figure 12: (Panel A) Paediatric population, children age 0–14 years. (Panel B) Monthly admissions to
hospital with an asthma diagnosis, children age 0–14 years, and public health policy measures, 2010–
2019. The scatter plot is fitted with a LOESS and linear regression curves.
90
NZMJ 16 April 2021, Vol 134 No 1533
ISSN 1175-8716 © NZMA
www.nzma.org.nz/journalarticle
It is difficult to make comparisons across underuse of inhaled corticosteroids are
cost-of-illness studies, primarily because of problem areas of management.29 In addition,
differences in the types of costs included in inhaled corticosteroids are sometimes inap-
the analysis. Telfar Barnard et al12 estimated propriately prescribed for respiratory tract
that childhood asthma cost $24.4m in 2011, infections.30,31 Therefore, it is difficult to
of which $7.8m was for prescriptions and interpret medication prescribing data with
$7.6m for hospitalisations (total $15.4m). absolute certainty. (4) Further, this study has
In calculating these costs, Telfar Barnard not specifically addressed the role of combi-
et al included (1) ‘wheeze’ in the asthma nation therapy. A more detailed analysis
classification, (2) estimates for work-days that covers combination therapy may yield
lost and (3) GP visits. A 2015 repeat of this further important insights. (5) The pharma-
study13 estimated that childhood asthma cost ceutical cost data do not include many of
$78.3m, of which prescriptions accounted the dispensing costs and other payments to
for $2.1m and hospitalisations for $7.4m pharmacies and therefore underestimate
(total $9.5m). Our estimates are broadly the cost of supplying medicine to patients.
comparable to these studies for the 2011 (6) The actual price that PHARMAC pays for
treatment year but, in comparison to 2015, pharmaceuticals is confidential. PHARMAC
are $3.86m higher for prescriptions and negotiates rebates with manufacturers, and
$1.2m higher for hospitalisations. We therefore the list prices in the pharmaceu-
contend that this is because Telfar Barnard tical schedule will overestimate the cost of
et al12,13 estimated and deducted the rebate supplying medicine.
given to pharmaceutical companies. As this Despite these limitations, there is a clear
information is not publicly available, we and obvious disparity in asthma rates and
were unable to account for the rebate. prescriptions and hospitalisation for asth-
This study, while being comprehensive, matic children in New Zealand. Speculating
suffers from a number of limitations. Specif- on the causes of these disparities would
ically: (1) The administrative health data are almost certainly point to socioeconomic
not well-positioned to inform on sociode- differences, inequalities in accessibility
mographic factors beyond neighbourhood and perhaps unconscious bias in treatment
deprivation. (2) The pharmaceutical data approaches. However, speculation is insuffi-
captures prescriptions that were dispensed cient. Although the causes will undoubtedly
but cannot determine whether these medi- be various, they must be identified. Only
cations were filled or taken. (3) Inhaled then will we be able to tailor our response
corticosteroids are front-line medica- and address the equity problem that exists
tions for asthma, and non-adherence to in the care for childhood asthma.
treatment, overuse of bronchodilators and
91
NZMJ 16 April 2021, Vol 134 No 1533
ISSN 1175-8716 © NZMA
www.nzma.org.nz/journalarticle
Appendix
Appendix Table 1: Classification of asthma medication in the PHARMAC pharmaceutical schedule.
Therapeutic Group 1 Reliever or Preventer Therapeutic Group 2 Chemical name
Respiratory System Reliever Beta-adrenoceptor Salbutamol
and Allergies agonists
Terbutaline
Methylxanthines Theophylline
Anticholinergic Agents Salbutamol with ipra-
tropium bromide
Ipratropium bromide
Hormone Preparations Corticosteroids and Prednisone
related
Prednisolone
Respiratory System Preventer Inhaled corticosteroids Fluticasone
and Allergies
Beclomethasone
dipropionate
Budesonide
Inhaled Long-acting Salmeterol
Beta-adrenoceptor
Agonists Eformoterol fumarate
Inhaled Corticoste- Fluticasone with sal-
roids with Long-Acting meterol
Beta-Adrenoceptor
Fluticasone furoate
Agonists
with vilanterol
Anticholinergic Agents Tiotropium
Leukotriene receptor Montelukast
antagonist
Mast cell stabiliser Sodium cromoglycate
Nedocromil
Combination Drugs Combination drugs Budesonide with efor-
moterol
Oncology Agents Immunosuppressants Omalizumab
92
NZMJ 16 April 2021, Vol 134 No 1533
ISSN 1175-8716 © NZMA
www.nzma.org.nz/journalarticle
Appendix Table 2: Purchase Units for events included in casemix funding, adapted from Ministry of
Health.20
Financial Year Medical & Surgical
1998/99 2,433.62
1999/00 2,399.22
2000/01 2,487.16
2001/02 2,479.01
2002/03 2,617.72
2003/04 2,728.55
2004/05 2,854.88
2005/06 2,949.09
2006/07 3,151.01
2007/08 3,740.38
2008/09 3,985.32
2009/10 4,315.48
2010/11 4,410.38
2011/12 4,567.49
2012/13 4,614.36
2013/14 4,655.43
2014/15 4,681.97
2015/16 4, 751.58
2016/17 4,824.67
2017/18 4,921.16
2018/19 5,068.12
2019/20 5,216.21
2020/21 5,545.26
93
NZMJ 16 April 2021, Vol 134 No 1533
ISSN 1175-8716 © NZMA
www.nzma.org.nz/journalarticle
Competing interests:
Nil.
Acknowledgements:
The authors would like to thank the Liggins Māori advisory group for their input and
discussion into this work. We would also like to thank Frank Bloomfield for comments on
the manuscript and the Ministry of Health for data access and help. DS and TF were funded
by an HRC Explorer Grant (HRC 19/774).
Author information:
Deborah Schlichting, Research Fellow, Liggins Institute,
The University of Auckland, Auckland.
Tayaza Fadason, Research Fellow, Liggins Institute, The University of Auckland, Auckland.
Cameron C. Grant, Professor, Head of Department of Department of Paediatrics:
Child and Youth Health, The University of Auckland, Auckland.
Justin M. O’Sullivan, Associate Professor, Deputy Director, Liggins Institute,
The University of Auckland, Auckland.
Corresponding author:
Deborah Schlichting, Research Fellow, Liggins Institute,
The University of Auckland, Auckland
d.schlichting@auckland.ac.nz
Justin M O’Sullivan, Associate Professor, Deputy Director, Liggins Institute,
The University of Auckland, Auckland
j.m.osullivan@auckland.ac.nz
URL:
www.nzma.org.nz/journal-articles/childhood-asthma-in-new-zealand-the-impact-of-on-go-
ing-socioeconomic-disadvantage-2010-2019
REFERENCES
1. Asher I, Pearce N. Global Respiratory medicine 8. Mitchell EA. Racial
burden of asthma 2016;116:34-40. doi: inequalities in childhood
among children. The 10.1016/j.rmed.2016.05.008 asthma. Social Science &
international journal of [published Online Medicine 1991;32(7):831-
tuberculosis and lung disease First: 2016/06/15] 36. doi: https://doi.
: the official journal of the 5. Health Quality and Safety org/10.1016/0277-
International Union against Commission New Zealand. 9536(91)90309-Z
Tuberculosis and Lung Atlas of Healthcare Varia- 9. Sears MR, Rea HH, Fenwick
Disease 2014;18(11):1269- tion Methodology | Asthma J, et al. Deaths from
78. doi: 10.5588/ Wellingotn2019 [Available asthma in New Zealand.
ijtld.14.0170 [published from: https://www.hqsc. Archives of disease in
Online First: 2014/10/10] govt.nz/assets/Health-Quali- childhood 1986;61(1):6.
2. Serebrisky D, Wiznia ty-Evaluation/Atlas/Asthma/ doi: 10.1136/adc.61.1.6
A. Pediatric Asthma: Methodology-asthma-up- 10. Institute for Health Metrics
A Global Epidemic. date-2020.pdf accessed and Evaluation. GBD
Annals of Global Health 07 August 2020 2019. Compare. Seattle, WA:
2019;85(1):6. doi: http://doi. 6. OECD. Health at a Glance: IHME, University of Wash-
org/10.5334/aogh.2416 2019. 2019 doi: https://doi. ington; 2015 [Available
3. Hsu J, Qin X, Beavers SF, org/10.1787/4dd50c09-en from: http://vizhub.health-
et al. Asthma-Related 7. Ministry of Health. data.org/gbd-compare
School Absenteeism, Annual Update of Key accessed November 8 2019.
Morbidity, and Modifiable Results 2018/19: New 11. Mitchell E. Asthma costs.
Factors. American Journal Zealand Health Survey. New Zealand Medical Jour-
of Preventive Medicine Wellington2019 [Available nal 1989;102(865):171-2.
2016;51(1):23-32. doi: from: health.govt.nz/ 12. Telfar Barnard L, Baker M,
https://doi.org/10.1016/j. publication/annual-update- Pierse N, et al. The impact
amepre.2015.12.012 key-results-2018-19-new- of respiratory disease
4. Mirabelli MC, Hsu J, Gower zealand-health-survey in New Zealand: 2014
WA. Comorbidities of accessed April 2020. update. Wellington: The
asthma in U.S. children. Asthma Foundation, 2015.
94
NZMJ 16 April 2021, Vol 134 No 1533
ISSN 1175-8716 © NZMA
www.nzma.org.nz/journalarticle
13. Telfar Barnard L, Zhang J. nz/wwwtrs/Sched- 28. Mills C, Reid P, Vaithiana-
The impact of respiratory uleOnline.php accessed than R. The cost of child
disease in New Zealand: September 26 2020. health inequalities in
2018 update. Wellington: 20. New Zealand Formulary Aotearoa New Zealand:
Asthma + Respiratory for Children (NZFC). a preliminary scoping
Foundation NZ, University NZFC v89 2019 [Avail- study. BMC Public Health
of Otago, Wellington, 2018. able from: https://www. 2012;12(1):384. doi:
14. Wilson N. The cost burden nzfchildren.org.nz/ 10.1186/1471-2458-12-384
of asthma in New Zealand. accessed February 2020. 29. Bush A, Fleming L.
New Zealand Medical 21. Holt S, Beasley R. The Diagnosis and management
Journal 2001;114(1128):148. Burden of Asthma in of asthma in children.
15. Atkinson J, Salmond C, New Zealand. Wellington: 2015;350:h996. doi: 10.1136/
Crampton P. NZDep13 Asthma and Respiratory bmj.h996 %J BMJ : Brit-
Index of Deprivation. Foundation of New ish Medical Journal
Wellington: University Zealand, 2001. 30. Poulos LM, Ampon RD,
of Otago, 2014. 22. The NCCP Casemix – Cost Marks GB, et al. Inappropri-
16. Ministry of Health. Weights Project Group. ate prescribing of inhaled
National Minimum Dataset New Zealand Casemix corticosteroids: are they
(hospital events) Welling- Framework For Public- being prescribed for respi-
ton2019 [Available from: ly Funded Hospitals ratory tract infections? A
https://www.health.govt.nz/ - WIESNZ19 2019/20. retrospective cohort study.
nz-health-statistics/nation- Wellington: Ministry Primary care respiratory
al-collections-and-surveys/ of Health, 2019. journal : journal of the
collections/ General Practice Airways
23. Statistics New Zealand.
national-minimum-data- Group 2013;22(2):201-8. doi:
Infoshare. In: Zealand SN,
set-hospital-events 10.4104/pcrj.2013.00036
ed. Wellington, 2020.
accessed August 2019. [published Online
24. SAS Enterprise Guide First: 2013/04/26]
17. Ministry of Health. [program]. 7.15
Pharmaceutical Collec- 31. Teichert M, Schermer T,
version. Carey, NC: SAS
tion Wellington2019 van den Nieuwenhof L, et
Institute Inc., 2017.
[Available from: https:// al. Prevalence of inap-
25. Environmental Health propriate prescribing of
www.health.govt.nz/
Indicators New Zealand. inhaled corticosteroids for
nz-health-statistics/nation-
Asthma hospitalisations respiratory tract infections
al-collections-and-surveys/
(0–14 years) Wellington: in the Netherlands: a
collections/pharma-
Massey University; 2020 retrospective cohort study.
ceutical-collection
[Available from: www. NPJ Prim Care Respir Med
accessed August 2019.
ehinz.ac.nz accessed 2014;24:14086-86. doi:
18. Australian Consortium August 07 2020. 10.1038/npjpcrm.2014.86
for Classification Develop-
26. Maurer M, Rosén K, Hsieh
ment. The international
H-J, et al. Omalizumab for
statistical classification of
the Treatment of Chronic
diseases and related health
Idiopathic or Spontaneous
problems, tenth revision,
Urticaria. New England
Australian modification
Journal of Medicine
(ICD-10-AM/ACHI/ACS)
2013;368(10):924-35. doi:
(Tenth ed.). Darlinghurst,
10.1056/NEJMoa1215372
NSW: Independent Hospital
Pricing Authority, 2017. 27. Diagnosing and manag-
ing asthma in children.
19. PHARMAC. Online
Best Practice Journal
Pharmaceutical Sched-
2012;42 doi: https://bpac.
ule Wellington2020
org.nz/BPJ/2012/Febru-
[Available from: https://
ary/asthma.aspx
www.pharmac.govt.
95
NZMJ 16 April 2021, Vol 134 No 1533
ISSN 1175-8716 © NZMA
www.nzma.org.nz/journalYou can also read