Childhood Disability and Malnutrition in Turkana Kenya
←
→
Page content transcription
If your browser does not render page correctly, please read the page content below
Childhood Disability and
Malnutrition in Turkana Kenya
A Summary Report for Stakeholders and Policy
                 Makers
         nutrition a

    This study was funded by CBM and was conducted in partnership
    between: Kenyan Red Cross Society; CBM East Africa Regional Office;
    International Centre for Evidence in Disability, London School of Hygiene
    & Tropical Medicine

    KRC: James Kisia , Victoria Mwenda, Velma Nyapera, David Otieno and
    Hellen Mwangovya

    CBM: David Munyendo and Kirstin Bostelmann

    LSHTM: Maria Zuurmond, Severine Frison, Hannah Kuper and Jenny
    Evans

                                                                                1
Study Background
There are approximately 93 million children aged 0-14 years living with “moderate or
severe disability”.[1] This equates to one in twenty children globally (5·1%).
Childhood disability is most common in the poorest parts of the world. [1, 2]

Malnutrition is a leading cause of childhood death in these low income settings,
causing almost half of child deaths in 2011. [3] Malnutrition may also be linked to
childhood disability (Figure 1). Childhood disability is important, because malnutrition
may further increase morbidity and mortality among children with disabilities. Few
studies have addressed the relationship between disability and malnutrition. [4-7]

                                                    Children with disabilities may develop
                                                    malnutrition if they have:
                                                       - difficulties in feeding
                                                       - frequent illnesses
                                                       - difficulties absorbing nutrients
                                                       - face neglect
                                                       - receive poor care. [8, 9]

                                                    Children who are malnourished may
                                                    develop disabilities and developmental
                                                    delay. For instance, children lacking
                                                    specific nutrients may develop
                                                    impairments (e.g. rickets). [9]

Figure 1: Potential pathways between malnutrition
and childhood disability

Children with disabilities may be particularly vulnerable to malnutrition during
humanitarian crises. This is because access to basic resources substantially reduces in
these times.[10] Humanitarian aid may be less accessible for children with disabilities
and their households. One such region is Turkana County within the Rift Valley
province of Kenya. This region has been repeatedly classified as experiencing a
humanitarian emergency (level 4) under the Integrated Food Security Humanitarian
Phase Classification (IPC).[11]

The aim of the study was to assess whether children with
disabilities were included within humanitarian and food security
response programmes in Turkana, and whether there is an
association between disability and malnutrition.

This question was explored through qualitative and quantitative
studies.

                                                                                             2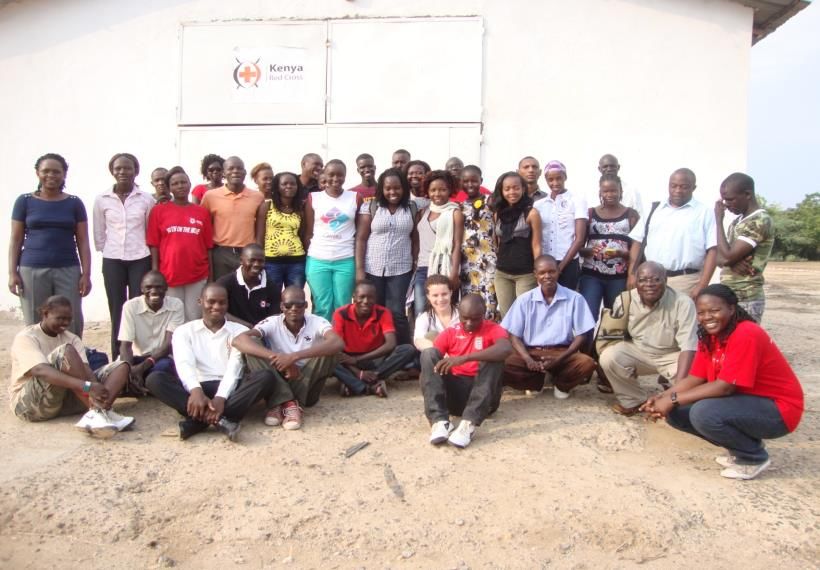
METHODS
The focus of the research was the Turkana Central and Loima districts. The fieldwork
was undertaken in 2013 through a combination of qualitative research and a
population based case-control study.

            Figure 2. Turkana Central District Administrative Boundaries

                 Figure 3. The field team for the quantitative study

Ethics
The following measures were taken to accord with ethical standards:
   • Written informed consent was obtained from the primary caregiver of each child

  •   A family member was present during the examination of each child.

  •   Ethical approval from Institutional Research and Ethics Committees from Moi
      Teaching and Referral Hospital in Kenya and LSHTM

  •   Children with disabilities or malnutrition requiring services were referred as
      appropriate

                                                                                   3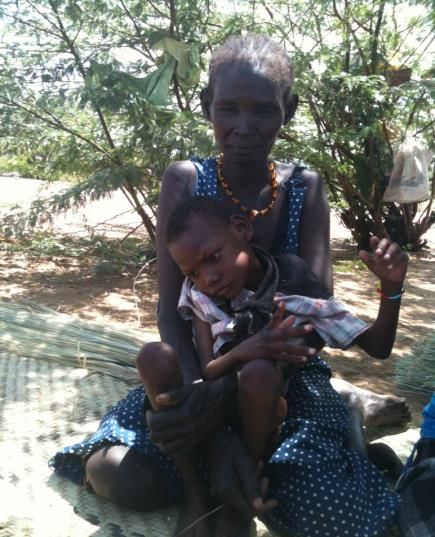
Qualitative study
The qualitative research was undertaken in April/May 2013 in Turkana Central. Two
interviewers and two translators undertook the research.
In-depth face to face interviews were undertaken with 31 families of children with a
range of disabilities, using an interview guide. Children with disabilities aged 10 years
and under were identified from existing KCRS supported projects and from additional
information gathered through local community health workers and KCRS volunteers.
They were sampled from across four sub-locations which reflected different livelihood
zones. A total of 23 villages were covered, the sample included both boys and girls,
and included children with a range of different types of impairments (physical,
hearing, visual and intellectual impairments).
Most interviews were in the local language Turkana, and some in Kiswahili. Detailed
notes were taken during the interviews. All interviews were recorded and transcribed
into English. Most interviews took place at the child’s home. The interview guide
covered the following topic areas:
1. Basic information on the family
2. Beliefs and attitudes about the child’s condition
3. The impact of caring for a child with a disability
4. Feeding practices
5. Access to services (health, education, humanitarian and nutrition programmes)
In addition, ten interviews and small group discussions were undertaken with 16 key
informants.
Qualitative data analysis
A thematic analysis was conducted. Some a-priori codes were identified from existing
literature. Both interviewers separately identified a list of key themes and sub-
themes, and these were then synthesised to provide an initial framework for analysis.
Further sub-themes emerged during the data analysis process. The interviews were
analysed using specialist software for qualitative data collection (NVIVO) and final
coding and analysis was undertaken at LSHTM. for qualitative data collection.
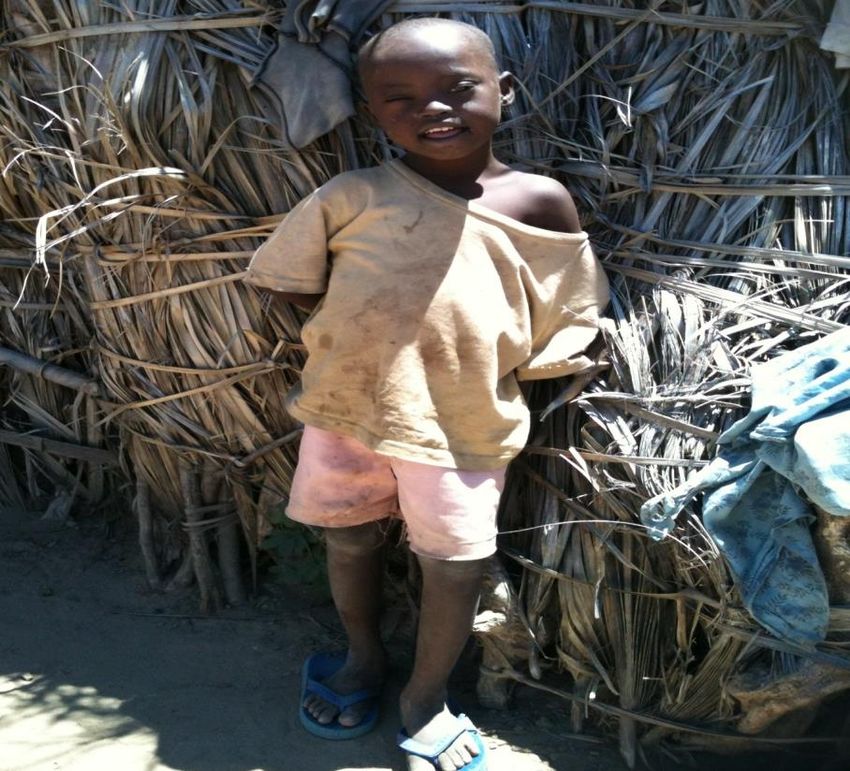
A grandmother with her grandson with
a disability
4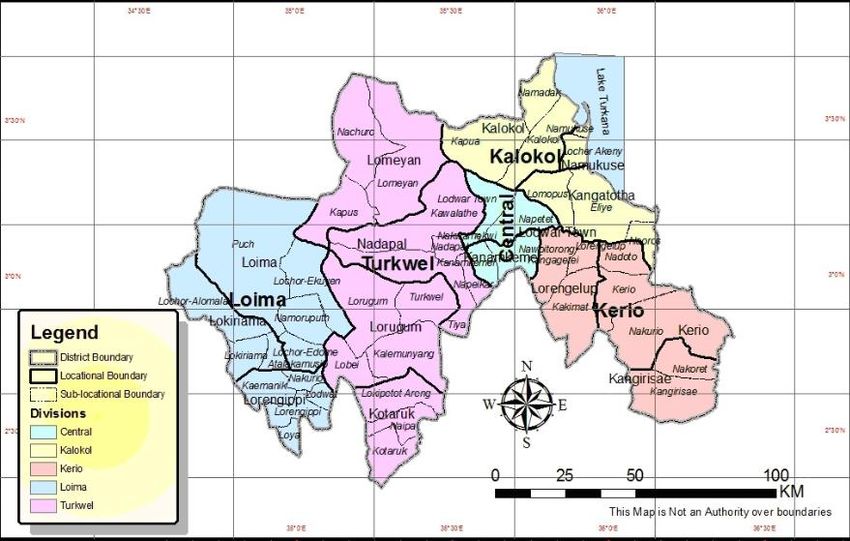
Quantitative study
Summary: For the quantitative study we selected children with disabilities (case),
their closest age sibling (sibling control) and their closest age neighbour (neighbour
control). These children underwent anthropometric measurement and their parents
completed a detailed questionnaire.
The quantitative research field work was undertaken in July/August 2013.
Selection of children with disabilities
Children with moderate/severe disabilities in the community aged 6 months to 10
years were identified through key informants.
Key informants in the community were identified (community health workers, Kenyan
Red Cross Volunteers, representatives from disabled people’s organisations). The key
informants underwent 1 day of training about childhood disability. They then returned
to their village and identified children who potentially had a disability during the
following 2-3 weeks.
A paediatrician and an interviewer visited the potential cases identified by the key
informants to ascertain as to whether or not the child had a moderate/severe
impairment. The child was assessed using a questionnaire (Washington Group-
UNICEF childhood disability questionnaire) and the paediatrician then examined the
child to confirm the type and cause of impairment as well as rehabilitation and
medical needs.
The types of impairment included:
Physical impairment (physical examination)
Epilepsy (questionnaire)
Visual impairment (visual acuity assessment)
Hearing impairment (questions, response to noise, examination with otoscope)
Intellectual impairment (professional opinion of paediatrician).
Selection of control subjects
Two control subjects were selected for each child with disability (case):
- Neighbour control: child nearest in age living closest to the child with a
disability and preferentially of the same sex.
- Sibling control: sibling living in the same household as the case and whose age
was closest to that of the case.
The purpose of two controls was to separate out the potential impact of disability on
the lives of children due to their poverty (i.e. in comparison to neighbour controls) or
purely in relation to the disability (i.e. in comparison to sibling controls).
We verified that the controls did not have disabilities through administering the
Washington Group-UNICEF questionnaire and through examination by the
paediatrician.
5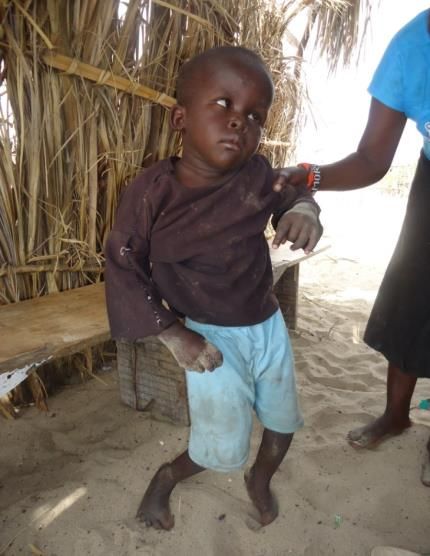
Data collection

The caregiver of the case and controls were interviewed using a semi-structured
questionnaire. The children’s anthropometric measures were taken by trained field
researchers.

The interviews included questions on:

  -   Household poverty
  -   Education of the child
  -   Health of the child
  -   Foods consumed regularly
  -   Feeding difficulties
  -   Receipt of humanitarian aid

The following measurements          were
taken for each child: Weight

  -   Height/length                           Anthropometric measurements        taken
  -   Mid Upper Arm       Circumference       on a child in the study
      (MUAC)
  -   Arm length
  -   Tibia Length

Training of field staff and pilot study

The questionnaires were pilot tested and translated into Ng’aturkana. There was a
structured training programme for the interviewers, paediatrician and anthropometry
team, that included theory and practice sessions.

Data analysis

Double data entry, range and consistency checks were undertaken in Kenya. All
statistical analyses were undertaken using Stata version 12 (StataCorp, Texas).

Statistical analysis included simple descriptive tabulations that compared cases with
neighbourhood and household controls. Furthermore, calculations of mean differences
and odds ratios with 95% confidence intervals were done. Additionally, multivariable
logistic and linear regression analyses to estimate the relationship between disability
and anthropometry, socio-demographic characteristics, including age, gender, and
poverty markers was carried out.

The nutritional status of the children was compared to the WHO Child Growth
Standards, by calculating standard deviation scores ("z-scores") using Stata
macros for weight for age, height for age, weight for height (for children 5 years and
younger) and body mass index (BMI) for age. [12] Children with z-score values
outside the recommended range (z-scores greater than 5 or 6/less than -5 or -6,
depending on the measure) and defined "under height for age", "under weight for
age" "under BMI for age" as a z-score of -2 or less were excluded.

                                                                                     6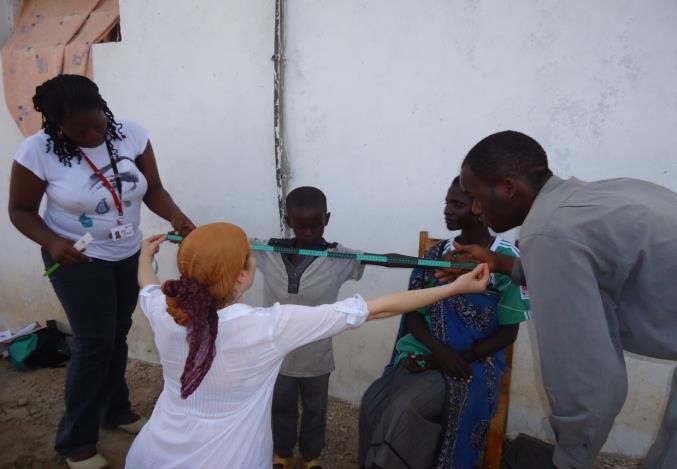
RESULTS
Study sample:

The case-control study included 311 children with disabilities, 196 Sibling controls and
300 neighbour controls (Table 1). It was not always possible to identify sibling
controls in the correct age group.

The average age of the cases was 2.8 years, and two thirds were boys. The cases
and controls were similar in terms of age and gender.

Table 1: Characteristics of children with disabilities and controls

                                 Child with          Sibling control    Neighbour
                                 disabilities                           control
                                                     N=196
                                 N=311                                  N=300

Sex                       Male 201 (65%)             107 (57%)          177 (60%)

                       Female 109 (35%)              80 (43%)           118 (40%)

Age              6 months-
Prevalence, type and cause of impairment

The key informants identified 311 children with moderate/severe disabilities.

Estimation of prevalence of childhood disability: There are an estimated 41,674
children aged
Access to treatment, rehabilitation and attitudes towards disability

Only 46 of the 311 children with disabilities had ever received rehabilitation (15%).
Barriers to treatment were cited as: lack of awareness (34%), lack of money (33%),
lack of perceived need (18%) or lack of transport (4%).
The qualitative study showed very           SUPPORTING QUOTES
similar findings. For most cases the
                                            “I have been considering taking him to
caregivers had not sought any medical
                                            the hospital but I have no faith that
diagnosis, although it was common to
                                            anything can be done medically about
seek treatment from traditional healers.
                                            this disease; it is caused by the
Caregivers frequently described             environment”
struggling to carry their child to the
                                            “We preferred seeking help from a
health services, which was difficult as
                                            traditional healer instead of the
they grew bigger. Some of the children
                                            hospital on advice from the villagers
had problems with incontinence or
                                            who felt that there are some diseases
with behavioural difficulties, and this
                                            which can be treated at home, such as
was a further complicating factor.
                                            polio.”
Even where they had been to a
                                            “In the past we took him for
hospital or clinic, there was
                                            physiotherapy…… we would hire
considerable confusion about the
                                            people with bikes and would sit him in
nature of their child’s condition, a lack
                                            the middle and take him.[Why did you
of information about the cause and
                                            stop going?] The main reason was the
options for treatment.
                                            child was too heavy to take, and we
Another key barrier to treatment was a      had no means of carrying him “
lack of information about available and
                                            “This child was born with this
of referral pathways amongst the
                                            condition [club foot]. We took her to
families and the health professionals
                                            the hospital in Kitale, and they put a
at the community level. There was a
                                            plaster on her leg. We were supposed
lack of treatment and rehabilitation
                                            to go back to hospital for treatment
services available. This results in the
                                            but we have not taken her there
need for families to travel long
                                            because we do not have money.”
distances, with the associated
opportunity costs.                          “I do not think A is alive. I am just
                                            taking care of him until his final
Many families talked about the stigma       death.”
and shame of having a child with a
disability. Some children with              “Some in the community are merciful.
disabilities were seen as a burden as       Others say ‘Why is she carrying a
                                            dead person...a useless person’”
they could not help with household
chores or would not bring in a dowry.
Most key informants said that children
                                            “I do not think that this child is of
with disabilities were hidden away at
                                            benefit to the family in any way.... She
home. There was some evidence of            can’t get married or help with
neglect of children with disabilities.      household chores.”

                                                                                     9
Socio-demographic characteristics and childhood disability
Children with disabilities were significantly more likely to have a female head of
household, compared to neighbour children without disabilities (Table 2).
Other household measures were not related to childhood disability (education of the
household head or spouse, polygamous family, nomadic family, socio-economic
markers, household size, number of children per household, livelihood, water and
sanitation). This pattern suggests a lack of relationship between poverty and
childhood disability in this region.
Table 2: Socio-demographic characteristics and childhood disability
Child with Neighbour Age and sex
disabilities control adjusted Odds
Ratio (95% CI)
Head of Adult male 250 (84%) 262 (90%) Baseline
household
Adult female 46 (16%) 26 (9%) 1.9 (1.1-3.2)
Understanding Odds Ratios: An odds ratio (OR) shows association between an
exposure and an outcome. In this example, between head of household (exposure)
and whether the child has a disability (outcome). The OR represents the odds that an
outcome will occur given a particular exposure, compared to the odds of the outcome
occurring in the absence of that exposure. As an example:
- Odds of disability for a child living in a family headed by a man = 250/262=0.95.
- Odds of disability for a child living in a family headed by a woman is 46/26=1.77
- Odds ratio = 0.95/1.77 = 1.9. This means that child is almost twice as likely to
have a disability if he/she lives in a house headed by a woman, rather than a man.
The 95% confidence interval shows the range of odds ratios that are likely, with 95%
probability. If the confidence interval does not include 1, then the odds ratio is
statistically significant (as in the example given above).
The qualitative study mirrored these “I am not able to do any work here all
findings. Half of the households were day. I have to carry the child all
single parent households which were through the day. I am not able to
make as many mats as other women
female- headed. Fathers had died,
make. I only make one mat every
left, or were permanently working
month while other women make even
away from home. In other instances 5 mats. Sometimes I am not able to
the husband visited rarely and make any mat at all.”
irregularly. The parents commonly
“I have to stay home to take care of
described how their caring role limited
the disabled child, I am not able to
their ability to undertake livelihood engage in any activity that can help me
activities, so that it is surprising that get income.”
no link with poverty was shown in the
quantitative study.
10Education and childhood disability
Children with disabilities (aged 5+) were significantly less likely to attend school than
neighbour controls (Table 3). Among children who did attend school, children with
disabilities were at significantly lower levels in the education system, but did not
appear to be more likely to miss days of school.
Enrolment in school varied by impairment type. It was higher for children with
epilepsy (69%), visual impairment (62%) or physical impairment (57%) than children
with intellectual impairment (50%) or hearing impairment (37%).
Table 3: Impact of disability on school attendance (children aged 5+)
Child with Neighbour Age and sex
disabilities control adjusted OR
(95% CI)
Attends school Yes 115 (62%) 159 (93%) Baseline
No 70 (38%) 12 (7%) 8.5 (4.3, 16.9)
Type of school Pre-primary 93 (80%) 115 (72%) Baseline
Primary 23 (20%) 44 (28%) 0.5 (0.3,0.9)
School grade 1 32 (82%) 52 (72%) Baseline
2+ 7 (18%) 20 (28%) 0.3 (0.1-1.0)
The qualitative study also showed “Since the child cannot walk wellto
that children with disabilities were school I am forced to carry him to
excluded from schools. school, sometimes we don’t have
time to take carry him to school
The four key reasons parents gave
and he has to stay at home,
for non-attendance at school were:
especially when I have to fetch
1. Lack of transport to school/ firewood early in the morning.”
long distances
“There is a school here [a special
2. Lack of support in schools
school in Lodwar] but you have to
3. Lack of funds for school fees
be able to pay”
4. Fear that their child might be
teased or hurt by other “It is difficult if you have to sit here
children. the whole day and care for him.
When all the children have gone to
Exclusion from school impacted on school he is left alone. The mother
the family through reducing the might be in town and I might be
opportunities for employment collecting firewood or on the farm.
He is then left on his own under the
tree until someone comes home.”
11Childhood disability and receipt of aid
Receipt of aid in the last 3 months was relatively rare, as only 10% of families of
children with disabilities received aid, compared to 7% of the controls, which may
predispose the children towards malnutrition. Receipt of care did not differ between
case and control households (Odds ratio=0.7, 95% confidence interval 0.4-1.3).
Children with disabilities were often not attending school, and
therefore were less likely to be in School Feeding Programmes.
Young boy with a physical impairment
The lack of access of children with “When food is distributed at school
disabilities to School Feeding it only reaches children with
Programmes was cited in the disabilities in school. It leaves out
qualitative study. children not enrolled in school
especially those under five years”
Families also reported that the
(KI)
disability of the child was a barrier
to the access of other Feeding “There is a food for work
Programmes, because of difficulties programme within the area but I’m
in accessing the scheme. not a beneficiary. There is no way I
can leave the baby and go to work.”
Many key informants said that
children with disabilities were “B has not been part of any food
generally hidden away at home programme, but we haven’t
most likely because of the stigma exposed him to any of these
attached to disability as well as programmes [why?] I was
lack of awareness of services. ashamed to take him out for a
Consequently, they were not seen project.”
in the health or nutrition
programmes.
12Childhood disability and health
There were no differences between children with disabilities and neighbour controls in
vaccination coverage, health status or care-seeking behaviour. Nor were there
differences in receipt of vitamin A supplementation or deworming.
Childhood disability and feeding practice
Children with disabilities were more likely to have their food prepared differently, and
twice as likely to report difficulties in feeding (Table 4).
There was no difference in the types of food eaten between children with disabilities
and controls or the number of times the child was fed per day. We did not assess the
quantity or quality of the foods eaten. There was no difference in breastfeeding
practices between children with disabilities and those without.
Table 4: Relationship between disability and with feeding difficulties
Child with Neighbour Age and sex
disabilities control adjusted OR
(95% CI)
Food differently prepared Yes 29 (10%) 14 (5%) 2.1 (1.1-4.2)
No 272 (90%) 269 (95%) Baseline
Does child feed him/herself Ever 55 (18%) 13 (4%) 6.5 (3.3,12.7)
Never 249 (82%) 284 (96%) Baseline
Difficulty feeding No 252 (81%) 268 (89%) Baseline
Yes 59 (19%) 32 (11%) 1.9 (1.2-3.1)
These findings on frequent difficulties with feeding among children with
disabilities were supported by the qualitative study for some of the children,
for example, for children with cerebral palsy. Participants had the following
to say:
“. ….it takes a long time for him to chew anything and swallow anything and
so it takes a very long time to feed him and this can be a problem when we
have to work.” (child with cerebral palsy)
“The child is not able to feed himself. He is usually fed, but feeds
without any difficulty. He feeds less than that of other children
since he is fed. Usually a child who feeds herself is more likely to eat
more compared to the one who is fed.”
13Childhood disability and anthropometry
Children with disabilities were on average shorter, with smaller arm span and length,
and shorter tibia length in comparison to neighbour controls (Table 5). There were
fewer differences in anthropometric characteristics when comparing children with
disabilities to their sibling. Children with disabilities had significantly lower weight and
smaller MUAC in comparison to either their sibling or neighbour control.
Table 5: Anthropometric measures and disability
Child with Family control p- Neighbour p-
disabilities value** control value**
Mean (SD*)
Mean (SD*) Mean (SD*)
Height 104.6 (18.8) 103.4 (17.2) 0.20 106.4 (16.0)The prevalence of malnutrition was high in both controls without disabilities and
children with disabilities (Table 7). Children with disabilities were 1.5-2.7 times more
likely to be underweight for age, stunted and have low BMI for age in comparison to
neighbour controls or family controls. Children with disabilities were almost twice as
likely to be wasted in comparison to neighbour controls, but this difference was not
apparent compared with siblings. These associations were not explained fully by
adjustment for the presence of feeding difficulties.
Table7: Relationship between malnutrition and disability status
Child with Family Age- sex Neighbour Age- sex
disabilities control adjusted OR control adjusted OR
(95% CI) (95% CI)
N (%) N (%) N (%)
Underweight Yes 158 (54%) 63 (34%) 2.2 (1.5-3.2) 86 (30%) 2.7 (1.9-3.7)
for age
No 136 (46%) 120 (66%) Baseline 201 (70%) Baseline
Stunting Yes 74 (33%) 42 (23%) 1.7 (1.1-2.6) 57 (20%) 1.9 (1.3-2.9)
No 151 (67%) 137 (77%) Baseline 225 (80%) Baseline
Low BMI for Yes 84 (37%) 47 (26%) 1.6 (1.1-2.5) 69 (24%) 1.8 (1.2-2.7)
age
No 143 (63%) 132 (74%) Baseline 219 (76%) Baseline
Wasting* Yes 40 (33%) 27 (24%) 1.5 (0.8-2.7) 31 (20%) 1.9 (1.1-3.4)
No 80 (67%) 85 (76%) Baseline 122 (80%) Baseline
*Restricted to childrenDISCUSSION
Summary of results
This was a large study among children with disabilities using quantitative and
qualitative methods, conducted in an area prone to food insecurity. The key findings
are as follows:
1. Prevalence and type of disabilities:
- The prevalence of moderate/severe disability was 0.7%.
- The majority of children with disabilities were boys
- Physical impairment was the most common type.
- There was poor uptake of health and rehabilitation services.
These figures are in line with the estimates from the Key Informant Method Study of
Childhood Disability in Bangladesh and Pakistan, which estimated the prevalence of
moderate/severe impairment of 0.9% in Bangladesh and 0.5% in Pakistan. [14]
Physical impairment was the most common type of impairment in both settings. The
higher prevalence of disability in boys as compared to girls was also reported in the
UNICEF survey.[7]
2. Feeding, malnutrition and disability:
- Malnutrition was common in both children with disabilities
and controls without disabilities
- Children with disabilities more likely to be malnourished
- Children with disabilities less likely to be at school and in
school feeding programmes
The central finding of the study is that children with disabilities are more likely to be
malnourished compared to those without. This is likely to be because:
Children with disabilities were less likely to attend school, and so were not
included in the School Feeding Programme
Children with disabilities were more likely to report feeding difficulties
Disability as a consequence of malnutrition (e.g. rickets) was relatively common
Families with children with disabilities may have more difficulties accessing aid
or undertaking productive work
Children with disabilities may face neglect, or reduced access to care
Other studies have also investigated the link between malnutrition and childhood
disability. The UNICEF multiple Indicator Cluster Survey including nearly 200,000
children across 15 countries showed that disability was significantly related to
stunting in 5 of the countries, and to being underweight in 7 of the countries. [5]
Others have reported more mixed results, but agree that malnutrition is most
common in children with neurological or physical impairments, [4, 6, 7, 9, 15-17]
and that this may be linked to feeding difficulties. [4]
163. Education, poverty, health, aid receipt and disability:
- Children with disabilities were often not included in education.
- No clear relationship between poverty and childhood disability
- Families of children with disabilities experience difficulties
accessing aid.
With respect to previously published studies:
Data is lacking to address inclusion of children with disabilities in aid receipt.
A large review found that the relationship between childhood disability and
socio-economic circumstances was “inconsistent and inconclusive” across 24
primary studies from low and middle income countries, [18] supporting the lack
of relationship shown in this study.
The exclusion of children from education has been demonstrated and is well
established. [1]
Strengths of the study
This study used mixed methods, collecting qualitative and quantitative data.
The quantitative study was large, including children with disabilities as well as
two sets of controls.
The presence of disability was assessed both through a questionnaire as well as
examination by a paediatrician.
Detailed anthropometric measures were taken, as well as a comprehensive
questionnaire.
Limitations of the study
The key informant method is unlikely to identify all children with disabilities in
the community, and so may underestimate the prevalence.
There were missing data in a number of categories.
It was not possible to measure anthropometry on all children.
Sophisticated measures of anthropometry, such as DXA scans, could not be
used.
Implications
A central implication of our findings is the need to address malnutrition in Turkana,
particularly among children with disabilities. There is also the need for further focus
on including children with disabilities in education.
Lack of inclusion of children from education and other programmes are contrary to
the spirit of two key conventions relevant to children with disabilities: the UN
Convention on the Rights of the Child, [19] and the UN Convention on the Rights of
Persons with Disabilities. [2]
A range of activities could be promoted to tackle these issues, such as targeted
feeding programmes or support for families on feeding practices, but the evidence
base on what works needs to be strengthened substantially in order to identify
scalable interventions. [20, 21]
17Recommendations:
1. Children with disabilities should be targeted in food aid and food
assistance programmes: Direct inclusion of children with disabilities in food
aid and food assistance interventions as a key vulnerable group
2. Children with disabilities should be included in mainstream food
assistance programmes: Take steps to ensure that children with disabilities
can access existing nutrition and food assistance programmes.
3. Efforts are needed to include children with disabilities in education.
Explore models of ‘good practice’ from within Kenya and the region.
4. Advocacy and communication is needed to increase knowledge (at all
levels) which will promote mainstreaming of disability into various sectoral
programmes as well as encourage social change at all levels including
community members.
5. Partnerships need to be strengthened: Enhance partnerships with key
stakeholders such as Pediatrics and surgical association of Kenya as well as
UNICEF who can be a key avenue to advocate for disability to county
government to increase availability of treatment and rehabilitative services at
the for children with disabilities.
6. Establish simple and clear referral pathways for treatment and
rehabilitation services for children with disabilities.
7. Research is needed: More research is needed to better understand the lives of
children with disabilities. The mixed methods approach worked well and can be
extended to other studies.
Conclusions
Children with disabilities are particularly vulnerable to
malnutrition, within an area of food insecurity.
Efforts need to be made to include these children within food
supplementation programmes, and school based programmes
alone may be inadequate to meet this need.
Exclusion of children with disabilities from education is also a
priority area to be addressed.
18REFERENCES
1. WHO, World Report on Disability. 2011, Geneva: World Health Organisation.
2. United Nations, Convention on the rights of persons with disabilities. 2006,
United Nations: New York.
3. Black, R.E., et al., Maternal and child undernutrition and overweight in low-
income and middle-income countries. Lancet, 2013. 382(9890): p. 427-51.
4. Yousafzai, A.K., S. Filteau, and S. Wirz, Feeding difficulties in disabled children
leads to malnutrition: experience in an Indian slum. The British journal of
nutrition, 2003. 90(6): p. 1097-106.
5. Gottlieb, C.A., et al., Child disability screening, nutrition, and early learning in
18 countries with low and middle incomes: data from the third round of
UNICEF's Multiple Indicator Cluster Survey (2005-06). Lancet, 2009.
374(9704): p. 1831-9.
6. Tompsett, J., A.K. Yousafzai, and S.M. Filteau, The nutritional status of disabled
children in Nigeria: a cross-sectional survey. Eur J Clin Nutr, 1999. 53(12): p.
915-9.
7. Wu, L., et al., Association between nutritional status and positive childhood
disability screening using the ten questions plus tool in Sarlahi, Nepal. Journal
of health, population, and nutrition, 2010. 28(6): p. 585-94.
8. Yousafzai, A.K., et al., Beliefs about feeding practices and nutrition for children
with disabilities among families in Dharavi, Mumbai. Int J Rehabil Res, 2003.
26(1): p. 33-41.
9. Kerac, M., et al., The interaction of malnutrition and neurologic disability in
Africa. Semin Pediatr Neurol, 2014. 21(1): p. 42-9.
10. Kett, M. and M. van Ommeren, Disability, conflict, and emergencies. The
Lancet, 2009. 374(9704): p. 1801-1803.
11. OCHA (United Nations Office for the Coordination of Humanitarian Affairs),
Turkana Nutrition and Mortality Survey. July 2012.
12. WHO, WHO Child Growth Standards. 2006, World Health Organisation: Geneva.
13. Kenyan National Bureau of Statistics, Kenya Population and Housing Census.
2009, Kenya National Bureau of Statistics: Nairobi.
14. Murthy, G. and I. Mactaggart, The Key Informant Child Disability Project in
Bangladesh and Pakistan. 2013, ICED: London.
15. Colver, A., C. Fairhurst, and P.O. Pharoah, Cerebral palsy. Lancet, 2014.
383(9924): p. 1240-9.
16. Socrates, C., et al., Poor nutrition is a serious problem in children with cerebral
palsy in Palawan, the Philippines. Int J Rehabil Res, 2000. 23(3): p. 177-84.
17. Gladstone, M., et al., Assessment of neurodisability and malnutrition in children
in Africa. Semin Pediatr Neurol, 2014. 21(1): p. 50-7.
18. Simkiss, D.E., et al., Childhood disability and socio-economic circumstances in
low and middle income countries: systematic review. BMC pediatrics, 2011. 11:
p. 119.
19. United Nations, Convention on the Rights of the Child. 1989, United Nations:
New York.
20. Tomlinson, M., et al., Research priorities for health of people with disabilities:
an expert opinion exercise. Lancet, 2009. 374(9704): p. 1857-62.
21. Yousafzai, A.K., P. Lynch, and M. Gladstone, Moving beyond prevalence studies:
screening and interventions for children with disabilities in low-income and
middle-income countries. Arch Dis Child, 2014. 0: p. 1-9.
19This study was funded by CBM and was conducted in partnership between: Kenyan Red Cross
Society; CBM East Africa Regional Office; International Centre for Evidence in Disability,
London School of Hygiene & Tropical Medicine
Thank you to all the Kenya Red Cross Volunteers (KCRS) who supported the field
work in a multitude of ways. Thank you to Dr Dr Hillary Rono, Zonal Ophthalmologist
Western Kenya, Ministry of Health.
And finally a huge thanks to the families who gave up their time to be interviewed
and share their personal stories.
KRC: James Kisia, Victoria Mwenda, Velma Nyapera, David Otieno and Hellen
Mwangovya
CBM: David Munyendo and Kirstin Bostelmann
LSHTM: Maria Zuurmond, Severine Frison, Hannah Kuper and Jenny Evans
20You can also read