Children Looked After and Care Leavers Placement Sufficiency Strategy January 2021 2024
←
→
Page content transcription
If your browser does not render page correctly, please read the page content below
Children Looked After
and Care Leavers Placement
Sufficiency Strategy
January 2021 - 2024
This version date 08/12/2020
Version number Final
Review Frequency Every 3 Years
Next review date December 2023
1
Contents
Page
1.0 Introduction 3
2.0 Sufficiency Duty: Legal Context 4
3.0 Thurrock- Our Vision 4
4.0 Thurrock – The Place 5
5.0 Thurrock Priorities 5
6.0 What Children and Young People Tell Us 6
7.0 Placement Needs Analysis 8
7.1 Profile of Children Looked After 8
7.2 Age of Children Looked After 9
7.3 Gender of Children Looked After 10
7.4 Ethnicity Breakdown 10
7.5 Unaccompanied Asylum Seeking Children 11
7.6 Legal Status of Children Looked After 13
7.7 Placement Stability, SGO’s and Adoption 14
7.8 Placement Stability 15
8.0 Educational Attainment 17
9.0 Children Looked After with Disabilities 18
10.0 Transition to Adult Services 19
11.0 Care Leavers 19
12.0 Placement Availability 22
13.0 Accommodation for Care Leavers and Vulnerable Young People 25
14.0 How Children Looked After and Care Leavers Feels About Where 26
They Live
15.0 Placement Costs 29
16.0 Gap Analysis 26
17.0 Key Priorities 30
18.0 Measuring Success 39
Appendix 1 Our Pledge to Children Looked After 41
Appendix 2 Charter for Care Leavers 43
2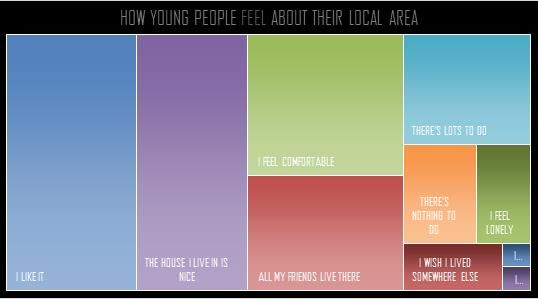
1.0 Introduction
Children and Young People in Care are one of the most vulnerable groups in our
society. It is our priority to ensure that all children and young people in our care and
their families receive the best possible support. This strategy outlines a review of the
needs of our Children and Young People who are Looked After and Care Leavers by
Thurrock Council and our approach to addressing these.
Meeting the needs of Children Looked After and Care Leavers is the responsibility of
the local authority as corporate parents and a priority across the council and its
partners. It is the responsibility of the local authority as corporate parents, to support
each of our care leavers as individuals in order to enable them to achieve their
maximum potential.
Our vision is to provide sufficient high quality placements for children and young
people which understand their aspirations and ambitions and can support them to
fulfil their potential. We aspire for our Care Leavers to have all the necessary skills
and support to make a successful transition to adulthood and independence at a time
that is right for them individually.
We want to make sure that we have appropriate placement and accommodation
options, both now and in the future, that support our looked after children to achieve
the best possible outcomes, whilst ensuring best use of available resources.
By working together across the service and with our partners responsible for Children
Looked After we are focused on delivering the services children and young people
need and deserve to live safe, happy, healthy and successful lives.
Joe Tynan, Assistant Director Children’s Social Care and Early Help
3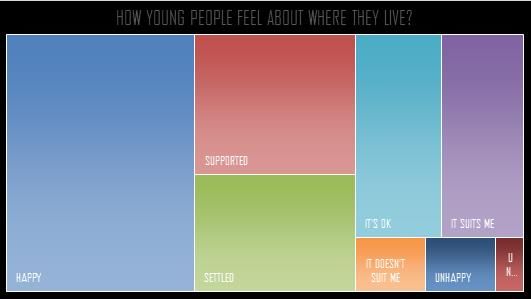
2.0 Sufficiency Duty: Legal Context
Section 22 of the Children Act 1989 (amended by the Children and Young Persons
Act 2008) places a general duty on Local Authorities to secure, so far as reasonably
practicable, sufficient accommodation within the authority’s area, which meets the
needs of children that the Local Authority are looking after, and whose circumstances
are such that it would be consistent with their welfare for them to be provided with
accommodation that is in the Local Authority’s area.
Sufficiency Duty Statutory Guidance describes the accommodation required for a
Child Looked After that, so far as is reasonably practical:
is near the child’s home;
does not disrupt his/her education or training;
enables the child to live with an accommodated sibling;
where the child is disabled, is suitable to meet the needs of that child; and
is within the local authority’s area, unless that is not reasonably practicable.
The overall context for meeting the Duty is set out in the statutory guidance,
(Sufficiency: Statutory guidance on securing sufficient accommodation for Looked
After Children, 2010) which states that:
“Securing sufficient accommodation that meets the needs of Looked After Children is
a vital step in delivering improved outcomes for this vulnerable group. Having the right
placement in the right place, at the right time is a critical success factor in relation to
the delivery of better outcomes for Looked After Children.”
The key areas that need to be addressed in relation to meeting the Duty are:
The number of accommodation providers in the area
A range of accommodation capable of meeting different needs
That the Local Authority is active in managing the market
That the commissioning strategy and practice is part of the “market
management”
That the Duty applies not just to meeting the needs of “Looked After” Children
and young people but also children at risk of care or custody
Sufficiency includes providing early intervention and prevention services that
help support children and families
This document builds on the long term vision for the development of our sufficiency
duty that was set out in the Sufficiency Strategy 2019/20. This version provides a
three year plan from January 2021 to January 2024.
3.0 Thurrock – Our Vision
An ambitious and collaborative community which is proud of its heritage and
excited by its diverse opportunities and future.
4
When a child becomes Looked After, the Local Authority becomes their “Corporate
Parent” responsible for them during their period as a child who is looked after and
when they leave care. Every parent wants the best for their child. In Thurrock, we
believe that where possible and in children’s best interest, children should live with
their families or their communities. It is not always possible for children to remain with
their families due to risk of harm or because they have been harmed.
We want to ensure the right children are in our care, that they are in the right
placements and that they transition into adulthood feeling support with the skills to
progress to independent living. We want our Children Looked After and care
experienced young people to feel settled, secure and stable and aim to do this
through robust permanency planning and placement stability.
Members and senior leaders in the Council are committed to providing the best
possible services and ensuring that children within Thurrock remain safe. Members
from all parties support Children’s Social Care and provide support and challenge
through the Corporate Parenting Committee.
4.0 Thurrock - The Place
There are 29,898 children on the school roll (School Spring Census 2020). There are
an estimated 44,650 children and young people under the age of 18 years in Thurrock
accounting for 25.6% of the population (ONS Mid 2019 estimates). The population of
children and young people is expected to increase by 11.2% in the next ten years.
Alongside existing increases in the child population in Thurrock, there is expected to
be a rapid economic and housing growth over the next decade. It is expected that the
population of children and young people aged 0 – 25 years will rapidly increase as a
result. It is highly likely, therefore, that the numbers of Children Looked After in
Thurrock will also grow. In order to account for this expected population growth, the
local Strategic Housing Market Assessment (SHMA) population projections take into
account the levels of job and housing growth expected to take place in Thurrock in
the coming years to provide a more realistic forecast of population growth than the
standard Office for National Statistics (ONS) forecasts.
It is estimated that from the baseline year of 2014 the child population (0 – 17 years)
will grow by 19% by 2024 and 35.4% by 2037. By comparison, the child population
of England is projected to grow by just 13.3% by 2024 and 19.2% by 2037. This is
around half of the rate of growth expected in Thurrock over the next 20 years.
5.0 Thurrock Priorities
People – a borough where people of all ages are proud to work and play, live
and stay.
This means:
5
- High quality, consistent and accessible public services which are right first time
- Build on our partnerships with statutory, community, voluntary and faith groups
to work together to improve health and wellbeing
- Communities are empowered to make choices and be safer and stronger
together
Place – a heritage rich borough which is ambitious for its future
This means:
- Roads, houses and public spaces that connect people and places
- Clean environments that everyone has reason to take pride in
- Fewer public buildings with better services
Prosperity – a borough, which enables everyone to achieve their aspirations
This means:
- Attractive opportunities for businesses and investors to enhance the local
economy
- Vocational and academic education, skills and job opportunities for all
- Commercial, entrepreneurial and connected public services
6.0 What Children and Young People Tell Us
There is a commitment to create a culture of listening to children and young people;
understanding what they want from the services they receive so that our work is
relationship based and informed by listening to the voice of our children. This
commitment includes the development of sufficient accommodation which meets the
needs of Children Looked After and Care Leavers. Feedback is via the Participation
and Engagement Team who routinely collect the views of children and young people
through a variety of methods and use this information to ensure the voice of children
and young people is at the heart of planning and delivering services. Some of the
ways the Participation and Engagement Team do this are illustrated below, these
were developed with children and young people:
6
We want all Children Looked After and Care Leavers and to be healthy, safe and
happy, do well at school, training or employment and enjoy good relationships with
their peers. We want our young people to be able to make the most of leisure
opportunities, hobbies and interests, and to grow towards adulthood equipped to lead
independent lives and to make their way as adults into higher education, good careers
and jobs, and achieve financial security.
The quality of placements strongly relates to children and young people ‘doing well’
and having stability in care. It is therefore the aim of this strategy to ensure that across
all areas of our services supporting Children Looked After and our Care Leavers, we
aspire to achieve the best possible placements and housing provision for our young
people.
Children can be in care for varying lengths of time. Some children are unable to return
to live with their parents because to do so would mean that they would likely suffer
further harm, abuse and/or neglect. When children become Looked After in Thurrock,
we will work hard to make sure that they are not further disadvantaged and that the
care we provide is better than the care they have previously received. We will
provide high quality care in a foster placements with a family or, where necessary a
high quality residential setting.
We want to enable our children and young people to be involved in decisions affecting
their lives, along with their parents and carers. We will work with our Children Looked
7
After and our young people who have left care to shape how we manage and organise
the resources and services that support them.
When the Council’s five year commissioning exercise commenced it included
engagement and consultation with young people who experienced being “Looked
After” they used the following key words to describe the features of a good service:
Trust Listening Structured
Communication Helping Transparency
Supporting Understanding Knowledge
This feedback was reflected in the specification that sets out the requirements for
providers and this remains in place. The expanded participation and engagement of
children and young people who are looked after and care leavers will be used to
contribute the development of new placement commissioning on an ongoing basis.
7.0 Placement Needs Analysis
7.1 Profile of Children Looked After (CLA)
As at the end of March 2020 there were 298 Children Looked After in Thurrock which
shows a reduction from 72.0 per 10,000 in 2018 to 68.1 per 10,000 in 2020, this is
lower than our statistical neighbour average of 76.0 and higher than the England
average of 65.0 per 10,000 based on the most recent data available (2018-19).
Rate of CLA per 10,000 pop
100
80
60
40
20
0
Mar-16 Mar-17 Mar-18 Mar-19 Mar-20
Thurrock 79.2 78.0 72.0 67.7 68.1
SN 66.5 68.1 69.5 76.0
England 60.0 62.0 64.0 65.0
The child (0-17 years) population has been increasing in Thurrock at a much faster
rate compared to the national average. This higher rate of growth is expected to
continue in the future in part due to the high level of economic and housing
development currently taking place. It is likely that there will therefore, be a
8
proportionate increase in the numbers of Children Looked After in Thurrock, even if
the rate per 10,000 remains constant. The 19% predicted growth in the population of
children and young people in Thurrock by 2024 compared to 13.3% for England
needs to be considered when planning support and placements.
The implementation of the Brighter Futures Strategy aims to provide support earlier
and reduce the number of children entering the care system, alongside this is the
Families Together Team who work with children and young people aged from 10-17
years and their families to help families learn together safely and learn to overcome
difficulties. The investment in these programmes will help to mitigate the likelihood of
increasing demand of children becoming looked after due to increased population.
7.2 Age of Children Looked After
The highest percentage of children in care in Thurrock are those aged 10-15 years,
this has remained broadly stable over recent years with this age group representing
40.6% of the children in care population as at 31st March 2020.
Age distribution of Children Looked After
60%
40%
20%
0%
March 2019 March 2020
Under 1 4.8% 3.7%
Aged 1-4 7.9% 14.4%
Aged 5-9 13.4% 15.8%
Aged 10-15 44.1% 40.6%
Aged 16+ 29.7% 25.5%
March 2019 March 2020
Under 1 14 11
Aged 1-4 23 43
Aged 5-9 39 47
Aged 10-15 128 121
Aged 16+ 86 76
This data on age breakdown is used in planning services and support. This is
particularly important in planning likely demand for Care Leaver support services
9
including housing and wider support needs. The number of children and young people
is monitored to identify the numbers that turn 16 and 18 per month along with those
moving into independence, this helps with case load management and the provision
of support.
7.3 Gender of Children Looked After
There are a larger number of male Children Looked After than female although the
numbers remain broadly similar from 2019 to 2020.
Children Looked After by gender
80%
60%
40%
20%
0%
March 2019 March 2020
Male 59.7% 60.1%
Female 40.3% 39.9%
March 2019 March 2020
Male 173 179
Female 117 119
Male Children Looked After can be more difficult to find suitable placements for and
also on average adoption takes longer than for female Children Looked After. We
closely monitor this data and assess any increase in risks if the gender breakdown
changes.
7.4 Ethnicity Breakdown
The ethnicity of Children Looked After remains broadly similar from the data held in
2019 and as illustrated below, this is broadly similar to the general population of
children in Thurrock.
10
Children Looked After by ethnicity comparison
100%
80%
60%
40%
20%
0%
Information
Asian/Asian Black/Black Mixed/Dual Any other
White not yet
British British Background ethnic group
obtained
Thurrock 2019 2.8% 15.5% 9.7% 67.9% 4.1%
Thurrock 2020 4.3% 14.1% 10.1% 68.8% 2.7%
School Census Spring 2020 6.8% 14.4% 6.3% 69.2% 1.0% 2.3%
England 2019 5.0% 8.0% 10.0% 74.0% 4.0%
Comparison with England 2019 data shows that a higher percentage of Black/ Black
British children are Children Looked After, in Thurrock however this is consistent with
the percentage of Black/ Black British children in the general Thurrock population.
The percentage of Children Looked After who are of Mixed/ Dual background is
slightly higher than the Thurrock general population data however this is in line with
the England 2019 trend.
Placement planning addresses the individual diversity needs of children placed and
the supervising social workers assist foster carers to ensuring appropriate oversight
and supervision is in place. In some situations where a cultural match has not been
possible, foster carers’ support network (Independent Reviewing Officers, Social
Workers, and Independent Visitors) can provide and contribute to the information and
care that foster families need to provide appropriate support.
7.5 Unaccompanied Asylum Seeker Children (UASC)
We have reducing numbers of UASC Children Looked After who are 16+ reducing
from 25 in 2019 to 16 in 2020. The overall number of UASC has reduced representing
7.0% of our Children Looked After population. At the end of March 2019, the number
of UASC was 31 compared to 21 in 2020, the majority of these children are aged 16+.
The Eastern Region Transfer Scheme provides a regional response to meeting the
accommodation and support needs of UASC, this is not part of a national scheme.
Through this we have an allocation of 0.07 as a part of the total cohort of UASC.
Locally this translates to 28 children and young people and we continue to
11
accommodate and receive UASC from the Eastern Region to meet our 0.07
allocation.
Uaccompanied Asylum-Seeking Children
12%
10%
8%
6%
4%
2%
0%
March 2019 March 2020
Thurrock 10.7% 7.0%
SN 6.3%
England 6.5%
March 2019 March 2020
Thurrock 31 21
SN (2018-19) 26 not available
England (2018-19) 5,070 not available
Number of Children Looked After who are Unaccompanied Asylum Seeking
Children and % of Children Looked After Total.
Age of Unaccompanies Asylum Seeking Children
30
25
20
15
10
5
0
March 2019 March 2020
Aged 10-15 6 5
Aged 16+ 25 16
For Care Leavers who are Unaccompanied Asylum Seeking Children, the Headstart
Housing Programme referred to later in this document has increased the availability
of local accommodation. This in turn provides improved access to support, training
12
and employment and access to services. Additional details of the support available
are outlines later in this document.
7.6 Legal status of Children Looked After
As of March 2020 there were 66 of children who were subject to care proceedings.
This is an increase on the March 2019 figure of 25. There were 176 number of
children who became subject to a Care Order in March 2019 and 162 in March 2020.
There is a focus on ensuring the Order reflects the status of a Looked After Child so
Placement with Parents Regulations are an exceptional placement, very small
numbers of children placed in this way.
Children Looked After by Legal Status
80%
60%
40%
20%
0%
March 2019 March 2020
Full Care Order 60.9% 54.4%
Interim Care Order 8.6% 22.1%
Placement Order 6.9% 4.4%
Single Period of Accom. (S20) 22.4% 18.5%
Other 1.3% 0.7%
March 2019 March 2020
Full Care Order 176 162
Interim Care Order 25 66
Placement Order 20 13
Single Period of Accom. (S20) 65 55
Other 4 2
There has been an impact on court proceedings as a result of COVID and this will
impact 2020/21 adoption timescales and plans for permanency as Final Hearings
have been delayed and proceedings are taking longer than the Public Law Outline of
26 weeks for conclusion.
13
7.7 Placement stability, Special Guardianship Orders (SGO’s) and Adoption
More children achieved permanency through adoption in 2019-20 in Thurrock and an
increased number are identified for 2019-20 with adoption as a potential permanence
plan. A total of 15 children were adopted in 2019-20 compared to 13 in 2018/19.
Thurrock Council are part of an alliance with Adopt East. Adopt East is a regional
adoption alliance which brings together the professionalism, skills and expertise of
eight local authorities and two voluntary adoption agencies from across the East of
England.
The Adopt East Alliance is committed to delivering the highest quality adoption
service to children and families throughout our region. We work with families in
Southend, Thurrock, Essex, Suffolk, Norfolk, Bedford Borough, Adoption Plus,
Hertfordshire and Luton. The scale of our organisation means that Thurrock children
waiting for adoption have access to a large number of adopters. By working
collaboratively, we are able to share best practice avoiding any unnecessary delay.
Adoption performance through the in house team is reflected in the data below. There
is a positive trend in the number of adopters recruited with 11 in 2020/21, a significant
increase from 2018/19 (3) and 2019/20 (6).
Approved
15
11
10
6
5 3
0
2018-19 2019-20 2020-21
14
In common with many Local Authorities in the region, where we recruit local adopters
who may not want/ be suitable to adopt local children we are able to transfer these or
‘sell’ to other Local Authorities in recognition of the costs we have incurred in
approving them as adopters. We also purchase adopters to support the matching
process and increase adoptions. This data is shown below, costs vary due to many
factors such as the needs of the child, number of siblings, and ages of the children.
Sell
8
6 5
4
2 1
0
0
2018-19 2019-20 2020-21
How many adopters we have purchased in the last 3 financial years. How much this
has cost in 2020/21 we have also developed the Fostering to adopt programme and
have an initial 3 cases that have resulted in adoption.
Purchased
12
10
10
8 7
6 5
4
2
0
2018-29 2019-20 2020-21
In 2020/21 we have also developed the Fostering to Adopt Programme and have an
initial 3 cases that have resulted in adoption.
7.8 Placement Stability
Although it is sometimes necessary to move a child to provide them with a better
placement our aim is to minimise the number of times each child changes placement
as this can be very disruptive, we describe this as achieving permanence for that
child. To achieve permanence it is essential that all our teams work effectively
together to support each placement. Permanence can be achieved in a number of
ways, including adoption, Special Guardianship Order, Child Arrangement Order or
matched for long term fostering. Each of these options gives the chance for the child
to achieve stability and achieve their potential. We know that placement stability is an
important factor in how well our Children Looked After are doing, the performance on
placement stability is shown below.
15
% of Children Looked
Stability
After
of with
Placement
3 or more placements
15% 14% 100%
11% 11%
10%
80% 10% 10% 10%
10% 9%
8%
60%
5%
40%
0% 20%
2016-17 2017-18 2018-19
0%
March 2019 March 2020
Thurrock SN England
Foster families 75.1% 78.9%
Residential settings 8.6% 9.7%
Independent living 10.7% 8.7%
Live at home / Placed with own
3.1% 1.7%
parents
Placement order 2.4% 0.7%
Secure units 0.3%
March 2019 March 2020
Foster families 218 235
Residential settings 25 29
Independent living 31 26
Live at home / Placed with own parents 9 5
Placement order 7 2
Secure units 1
The performance across the factors shown in the chart above has remained relatively
stable and maintaining and improving this is a priority.
In addition, a key measure of placement stability is also the percentage of children
with three or more moves in a year. Thurrock’s performance over recent years has
been improving and in 2018/19 (the most recent published data) performance was
better than national and our statistical neighbours. A part of achieving this is based
on the quality of providers in place, the increase in in house-foster carers and the
activity in recent years to set local standards and encourage providers on to the
framework through the select list is a part of this.
The chart below provides a comparison of the 3 or more placements data with our
statistical neighbours and national (latest published data). There has been a
significant improvement over recent years, this is routinely monitored.
The percentage of Children Looked After who have been in a placement for 2 + years
has reduced in recent years as permanency planning has been further developed.
Thurrock has significantly lower numbers than our statistical neighbours and England
data.
16
The chart below gives an indication of how long current Children Looked After have
been in their placement and is used in permanency planning and placement
stability.
% of Children Looked After in Placement 2+ years
80%
68.0% 68.0%
70%
60%
50% 44.1%
41.9% 40.0%
39.5%
40% 34.2%
30%
20%
10%
0%
2015-16 2016-17 2017-18 2018-19 2019-20 SN England
(2015-16) (2015-16)
2015-16 2016-17 2017-18 2018-19 2019-20
Thurrock 139 132 132 116 102
8.0 Educational Attainment of Children Looked After
There are also strong indications that placement stability is also factor in the
educational attainment of Children Looked After, whilst the factors that determine this
are too diverse to measure at a child level there are some key performance indicators
that provide the direction of travel. These are outlined below.
The Head Teacher of the Virtual School ensures that Children who are Looked After
have access to education and works closely with the Social Work teams and other
professionals. They hold and publish a range of data on attainment however for the
purposes of this document we are reporting on two of the key stages. School
attendance data is also shown below.
School Attendance 2019
Average attendance CLA 96.9%
All Thurrock Children Attendance 94.9%
Key Stage 2
The combined reading, writing and maths scores remain consistent with 50% of
Children Looked After achieving the expected levels in 2019 and 2018. This
17
compares with the national level of 35% in 2018 and 37% in 2019. The comparison
with all Thurrock children is shown in the table below.
2019 Key Stage 2 Thur Thur Nati Nati National National
Exam Analysis: rock rock onal onal Disadvan Non -
12+ months in care CLA ALL CLA ALL taged Disadvan
taged
Reading, Writing &
Maths combined 50% 70% 37% 64.9 51% 71%
% %
Key Stage 4
The 2019 KS4 Attainment 8 Score for Thurrock Children Looked After was 23.20
compared to a national Children Looked After score of 17.9. For Thurrock Children
Looked After, this is an improvement from the 2018 score of 19.7.
The 2019 KS4 Progress 8 Score for Thurrock Children Looked After was -1.09
compared to a national Children Looked After score of -1.47. For Thurrock Children
Looked After, this is an improvement from the 2018 score of -1.42
The chart below shows the 2019 data, including a comparison with all Thurrock
children.
2019 Key Thurr Thurr Natio Natio National National
Stage 4 ock ock nal nal Disadvant Non –
Exam CLA ALL CLA ALL aged Disadvant
Analysis: aged
12+ months
Attainment 8 23.20 42.90 17.90 44.80 36.80 50.50
Score
Progress 8 -1.09 -0.10 -1.47 -0.08 -0.45 0.13
9.0 Children in Care with Disabilities
6.4% of our Children Looked After as at the end of March 2020 had a disability as
defined by the Children Act 1989 (Section 17 Part 11), this number remains broadly
static against previous years although there has been a slight reduction in recent
months and this will be reflected in the next published data. Although this group make
up a comparatively small proportion of the wider cohort of Children Looked After, they
usually have complex needs and so it is essential that we can provide placements,
which are able to meet their needs and provide them with the support they need to
thrive. The specialist nature of the care needs of this group, the national shortage of
provision and the need for an effective transition to Adult Services where appropriate
make this a key group to consider with regards to planning of provision.
18
% of Children in Care With Disabilities
100%
80%
60%
40%
20%
0%
March 2019 March 2020
Disability 6.6% 6.4%
Non-disability 93.4% 93.6%
March 2019 March 2020
With disability 19 19
No disability 271 279
10.0 Transition to Adult Services
Transition is complex as young people move from Children’s Services into adult
provision and it is important that those involved in support work closely together to
reduce concerns about the change from children’s to adult provision. Support across
Adult Social Care Services is offered in a number of different ways guided by the
Care Act 2014, ranging from support and advice, early intervention and prevention to
delivery of support to meet complex needs. Most young people who utilise adult
services will be those who have complex challenges such as learning disabilities,
physical disabilities and mental health challenges. A Preparing for Adulthood Strategy
has been written to support young people and their families and an implementation
plan for this strategy will be developed in partnership with young people, their families,
education, health, social care and the wider community. We want to ensure that
young people are placed at the heart of our Better Care Together Agenda which
focuses on community, place, strengths and integrated approaches. We have
identified within our Market Development Strategy that there will be a steady increase
in the numbers of people between 18 to 65 who will have learning disabilities and
autism and as such our planning for future supports reflects this.
11.0 Care Leavers
The definition of Care Leavers includes young people who have left care post 18 but
also children who have not left care but have become eligible for support post the age
of 18.
Eligible children within the meaning given by paragraph 19B of Schedule 2 to the
Children Act 1989. Eligible children are young people aged 16 and 17 who have been
19
Looked After for at least 13 weeks since the age of 14 and are still being Looked
After.
Relevant children within the meaning given by section 23A(2) of the Children Act are
children who are not being Looked After by a Local Authority, but was, before last
ceasing to be Looked After, an eligible child, and is aged 16 or 17.
Former relevant persons within the meaning given by Section 23C (1) of the Children
Act 1989 are young people aged between 18-25 who have been either eligible or
relevant children or both.
As at the end of March 2020, 276 Care Leavers, including those 16-18 being
supported, were receiving an Aftercare Service, this is a slight increase from March
2019 but this is largely dependent on the age of children in care.
Care Leavers
180
160
140
120
100
80
60
40
20
0
Mar-20 Sep-20
Aged 22+ 24 34
Aged 19-21 158 168
Aged 16-18 72 74
Getting the right support for Care Leavers is a priority for Thurrock as this supports
transition into adulthood. A number of interlinked projects have already commenced
that bring together partners such as Housing, Adult Services and Children’s Services
to identify and meet support needs and find housing solutions locally. The data below
aids the planning of this as we can see that the number of 22-25 year olds increased
in recent years and this will impact particularly on providing support for the move to
independent living for this cohort.
20
Age distribution of Care Leavers
300
250
200
150
100
50
0
Nov- Mar- May- Nov-
Dec-19 Jan-20 Feb-20 Apr-20 Jun-20 Jul-20 Aug-20 Sep-20 Oct-20
19 20 20 20
22-25 years 14 16 17 18 23 28 27 28 27 28 34 38 37
18-21 years 218 220 216 215 213 213 216 215 221 225 225 228 231
16-17 years 11 16 16 18 17 18 18 14 16 15 17 13 12
Care Leavers by gender
300
250
200
150
100
50
0
Nov- Mar- May- Aug- Nov-
Dec-19 Jan-20 Feb-20 Apr-20 Jun-20 Jul-20 Sep-20 Oct-20
19 20 20 20 20
Indetermined 2 2 2 2 2 2 2 2 2 2 2 2 2
Female 72 74 73 77 76 75 76 76 76 76 80 82 80
Male 169 176 174 172 176 182 183 179 186 190 194 195 198
The high percentage of Children Looked After aged 10-15 years means that demand
for Aftercare services is likely to remain high and due to the increasing local
population this may increase over the coming years. A profile of when Care Leavers
aged 16-17 years turn 18 is shown below for the period January 2021 to March 2022.
This only provides an estimate due to other factors but is useful in managing support
needs.
Jan Feb Mar Apr May Jun Jul Aug Sep Oct Nov Dec Jan Feb Mar
-21 -21 -21 -21 -21 -21 -21 -21 -21 -21 -21 -21 -22 -22 -22
1 0 2 0 2 0 0 0 1 0 1 1 0 0 2
21
12.0 Placement Availability
As of March 2019 there were 218 of children in fostering households; 119 of which
were IFA and 99 of which were in house. In March 2020 the number of children in
fostering households was 235 and 117 were IFA and 118 were in house. In 2020-21
and 2021-2022 if the numbers of Children Looked After remain at 298 (as of March
2020), an increased fostering recruitment campaign would seek to increase fostering
capacity by approximately 20 households and reduce the number of children placed
over 20 miles from Thurrock and in other types of placement by at least 20 Children
Looked After. The Thurrock placement need is focussed on the recruitment of
fostering households that will be able to manage sibling groups locally as this is
currently where we often have difficulty securing a local placement.
Placement provider March 2019
60
50
40
30
20
10
0
Parents/person with
Private provision Local authority provision Voluntary / Third sector
parental responsibility
0-4 years 10 22 1 4
5-11 years 22 38 5 2
12-15 years 54 39 2 5
16+ years 55 26 1 4
Placement provider March 2020
60
50
40
30
20
10
0
Parents/person
Local authority Voluntary / Third Other public
Private provision with parental
provision sector provision
responsibility
0-4 years 24 29 1
5-11 years 40 31 1 1
12-15 years 50 40 1 4
16+ years 52 20 2 1 1
The majority of Children Looked After (78.9%) have a placement in a foster care
setting, this is a slight increase from 2019 (75.1%). These placements are provided
through In-house foster placements and placements through commissioned
22
Independent Fostering Agencies (IFA’s) and breakdown of fostering placements is
also provided.
Children Looked After by Placement type
90%
80%
70%
60%
50%
40%
30%
20%
10%
0%
March 2019 March 2020
Foster families 75.1% 78.9%
Residential settings 8.6% 9.7%
Independent living 10.7% 8.7%
Live at home / Placed with own
3.1% 1.7%
parents
Placement order 2.4% 0.7%
Secure units 0.3%
March 2019 March 2020
Foster families 218 235
Residential settings 25 29
Independent living 31 26
Live at home / Placed with own parents 9 5
Placement order 7 2
Secure units 1
A further breakdown of the fostering placements is shown below. The increasing
number of in-house foster carers reflects the recruitment activity the team have been
undertaking. This supports the provision of local placements and value for money.
IFA placements are recruited through the select list provision of which there is still a
need however the offer of local provision that meets individual needs has priority over
carers further away.
23
Foster carers in-house and IFA
140
119 118 117
120
99
100
80
60
40
20
0
March 2019 March 2020
In-house IFA
Thurrock operates a select list and annually invites providers to become a part of that
framework. This has led to the development of a Thurrock specific contract that better
meets the needs of children and young people in the borough. There are currently 13
Semi Independent providers, 7 Residential providers and 19 Independent Foster
Agencies as a part of the framework. Placements are made under the framework
where possible but where this is not possible, usually due to the need for specialist
or emergency placements then they are spot purchased.
The nature of the residential care market has resulted in a lower number of this type
of placement on the select list. This is replicated in Local Authorities across the
Country; the majority of residential placements are spot purchased for individual
children however the same terms and conditions apply regardless of the contract
type. It remains a priority to recruit high quality placement types, suitable to individual
needs as close to the local authority as is practicable.
Children Looked After by Placement location and distance
80%
60%
40%
20%
0%
Placed outside 20 miles or less from More than 20 miles
Placed in Thurrock
Thurrock home from home
March 2019 41.4% 58.6% 74.5% 25.5%
March 2020 35.2% 64.8% 71.5% 28.5%
24
March 2019 March 2020
Placed in Thurrock 120 105
Placed outside Thurrock 170 193
20 miles or less from home 216 213
More than 20 miles from home 74 85
There is a recognition that there is a slight decrease in the numbers of Children
Looked After who are placed both within the Borough and within 20 miles of their
home. As at end March 2020, 71.5% of children and young people are placed within
a 20 mile radius of their home compared to 74.5% in 2019 and 79.3% in 2018. The
geographical size of Thurrock means that those children not placed in the Borough
are generally in neighbouring or nearby authorities such as Essex, Southend, London
Boroughs of Barking and Dagenham, Havering and Redbridge.
Placements over 30 miles tend to be of a specialist nature where there are few
providers available to meet specific needs. The children who are placed in residential
care have specialist needs and are unable to settle within a foster family environment.
They generally have extensive trauma histories and foster families can be challenged
with the presenting needs of these children. Residential care offers safe care to some
older adolescence who can be subject to grooming from gangs and experience
exploitation.
The renewed Thurrock fostering campaign with the additional benefits for Thurrock
foster carers to receive council tax rebate will support the focus on local recruitment
of carers so children can remain within their communities. This assists with the
continuity of school and support ensuring links to families and environment. We are
hoping that an inclusive and diverse approach to the fostering recruitment will also
assist in placing children within culturally matched placements and offer familiarity
with family customs and placement within familiar communities.
We now have one standard Thurrock Select List. Individual/ spot purchases will only
be utilised if a placement cannot be found from the Select List, and in these cases
will still be subject to a standardised set of contract terms and conditions.
The exception to this is the limited number of Special Educational Needs placements
made with Residential Non-maintained Special Schools and Colleges where the
National Contract is used. Thurrock is also a part of the Children’s Cross Regional
Arrangements Group, this brings a collective approach to monitoring and fee
negotiation to those providers who are members.
13.0 Accommodation for Care Leavers and Vulnerable Young People
The majority of Children Looked After are supported by the Aftercare Team on turning
18. At the end of September 2020, 276 Care Leavers were receiving an Aftercare
service. Working closely with the Aftercare team, Headstart Housing provides
transitional accommodation whilst young people develop the independence skills
required to manage social housing. Now managing a portfolio of 114 beds, including
25
42 supported by key workers, the service provides a tailored approach to support
young people to develop. The portfolio includes:
Homelessness: A joint project between Children’s services and Housing is in
place to offer accommodation for young people who meet the relevant criteria.
For young people, this consists of:
Hostel 1 5 beds primarily for young people aged 16/17 years who have
declared themselves homeless and are assessed by Housing
as being so. Mediation support is also offered to try to support
the young person to return home. If rooms are empty they can
be used as emergency supported accommodation while a
suitable placement is found.
Hostel 2 9 beds available to Headstart Housing/ Aftercare for former
Children Looked After aged 17-25 years. Support is provided to
a maximum of 25 hours per week and is allocated based on
individual needs.
Young Parents Support Project: This project provides accommodation and
parental support
Accommodation For 20 young women plus support for a further 5 women aged
and Support 16-25 who are pregnant or who have children under 5. The
across 2 project is open to Thurrock residents and any current of former
hostels Thurrock Council Child Looked After.
Move on flats 2 flats housing 4 young families
Other Accommodation for Care Leavers Where Appropriate
Local A mix of Council housing stock and the use of private
accommodation landlords
There remains a shortage of:
- Post 18 low need 24/7 Supported Accommodation
- Post 18 medium / high need CQC Registered accommodation
- Floating support for Care Leavers aged 18-25 years old.
Joint working has already commenced across Children’s, Adults, Housing and Public
Health to integrate commissioning and identify opportunities to better use existing
funding.
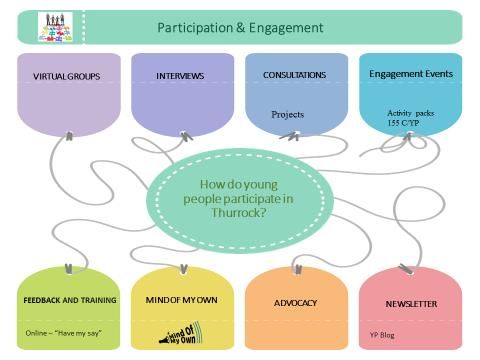
14.0 How Children Looked After and Care Leavers Feel About Where They Live
The following diagrams summarise how children and young people who are Looked
After feel about where they live and their local area, they were gathered by the
Participation and Engagement Team. It is broken down to show the different age
groups and the individual aspects of their responses. We can see that 92% feel
positive about where they live and 86% feel positive about their local area. In addition
the majority of children in each age group say they feel safe where they live.
26
HOW DO YOU FEEL ABOUT WHERE YOU LIVE?
OVERALL
TOTAL NUMBER OF RESPONSES 108
POSITIVE V NEGATIVE
8%
92%
HOW YOUNG PEOPLE FEEL ABOUT WHERE THEY LIVE 0 to 9 10 to 16 17+
48
23 21
17 18
12
4 3 4 4 2 3 3 2 2 2 3 2
0 1 1 1 0 0
HAPPY SUPPORTED SETTLED IT SUITS ME IT'S OK IT DOESN'T SUIT ME UNHAPPY UNSAFE
27
HOW DO YOU FEEL ABOUT YOUR LOCAL AREA?
OVERALL
TOTAL NUMBER OF RESPONSES 77
POSITIVE V NEGATIVE
14%
86%
HOW YOUNG PEOPLE FEEL ABOUT THEIR LOCAL AREA 0 to 9 10 to 16 17+
35
33
26 27 Unsafe
18 Count of Unsafe
7
11
7 8 7 7
6 6
4 3
1 0 0 0 0 0 0 1 0 0 0 1 0 0 1 0
I LIKE IT ALL MY FRIENDS LIVE I FEEL COMFORTABLE THE HOUSE I LIVE IN THERE'S LOTS TO DO THERE'S NOTHING TO I DON'T FIT IN I WISH I LIVED I FEEL LONELY I FEEL SCARED
THERE IS NICE DO SOMEWHERE ELSE
WHERE DO YOU FEEL SAFE?
OVERALL
TOTAL NUMBER OF RESPONSES 76
WHERE DO YOUNG PEOPLE FEEL SAFE? 0 to 9 10 to 16 17+
50
25
19
15 14
11 12
8 9
5 3 5 4 4
2 2 1 0 0 1 0 2 2 1
AT A CLUB IN MY LOCAL AREA NOWHERE OUTSIDE SCHOOL OR COLLEGE WHEN I'M ALONE WHERE I LIVE WITH MY FRIENDS
28
15.0 Placement Costs
Provided below is the average weekly unit cost per child in each different placement
type. These costs will vary based on the needs of the child and the placement type
required with significant variations between the minimum and maximum cost,
especially for placements out of area. This breakdown is designed to provide an
overview.
Average weekly unit costs per child
In-house foster Independent Residential Supported
care Fostering Agency (Independent) Accommodation
£474.50* £894.73 £4080.40 £1037.03
In house foster placements provide the most cost efficient placement type* (support
costs are met in house) and are generally provided locally, these are followed by
Independent Foster Agency placements. We always seek to place children in foster
care where possible with priority given, subject to the child’s need, to placements
within a 20 mile radius, the next level of priority is to those providers who are a part
of the Select List/ framework. To support to use of foster care we have the local in
house recruitment drive along with the annual select list to support an increase in
Independent Foster Agencies. Residential care is only used for specialist or
emergency use. The cost of all placements are based against a framework of costs
dependent on the level of need. Whilst it is recognised that costs will be dependent
on the need and availability a pricing framework is used regardless of if the placement
is from a framework or spot purchased. It remains a priority to reduce placement
costs whilst maintaining the right level of care for children and young people.
There is limited comparator data available for the last 12 months however a report
‘Price Trends and Costs of Children’s Homes – February 2020’ indicates that the
average weekly cost for an education inclusive residential placement is £3,970 which
is broadly similar to the rate we currently pay. It remains a priority for us to achieve
value for money and the Commissioning team work on placement costs will be
ongoing.
16.0 Gap analysis
The development of the Brighter Futures commissioned parenting offer should
focus on the reduction of 10-15 year olds entering the care system by ensuring
there is a clear pathway from the Children’s Centre support offered into other forms
of support.
29
Edge of care support for 10-15 year olds particularly must remain a focus as this is
the consistently the largest cohort of Children Looked After.
The high levels of Care Leavers combined with the cohort of 10-15 year olds who
will become Care Leavers in the coming years means that there is a risk of a
shortage of post 18 accommodation in the local area, this should be a focus for
development through the existing programmes.
Post 18 support has been identified as a priority through a number of areas of work
along with the joint programme of commissioning to meet the increasing levels and
complexity of needs. These programmes should continue to align to reduce
duplication and maximise the use of resources.
Permanence remains a priority for Thurrock Children Looked After, adoption
numbers are increasing however this must remain a focus to meet the demand for
adoption permanency.
Whilst the Children Looked After number is lower than our statistical neighbours,
the local projected population growth particularly of children means that even if our
rate per 10k remains the same we are likely to see an increase in the number of
Children Looked After. The development of in-house foster carers is important as
these carers often allow for local placements. The recruitment activity should be
matched to any % population growth and also provide opportunities for local
placements for sibling groups.
We need a range of providers to meet different placement needs, currently there is
a shortage of residential and IFA’s providers locally who are part of the select list.
Market development activity should aim to increase this when the Framework
opens annually.
The majority of residential placements are more than 20 miles from Thurrock, we
must work with providers based closer to Thurrock to address this.
The number of Children Looked After who experience 3 or more moves in a year
should continue to be a focus, the placement development work will support this.
The costs per placement vary significantly, there is a need for improved step down
processes and fee negotiation to achieve value for money to allow us to invest more
of our budget in supporting our children who are looked after.
17.0 Key Priorities
Across all of the services we deliver, we seek to make sure that all decisions are
centred on the views and needs of the child. We also aim to make sure that our time
is focussed on achieving the right outcomes for our children who are looked after to
achieve these aims.
Placement type and the age of our children in care population have recently been
relatively constant. The numbers of children in care have decreased in line with our
30
statistical neighbours but are predicted to increase as the local population does. If we
are to achieve the best outcomes for all these children we need to ensure that all our
placement services are fit for purpose and continue to grow and develop.
There are six main strands to our strategy, these are a continuation of the work
developed in recent years:
The voice of children and young people at the
heart of planning
Achieving placement stability and permanence
Placement Recruitment and support of foster carers
Sufficiency
Strategy Commissioning and partnership working
Developing the offer for care leavers
Developing the support offer for our most
vulnerable children
Priority 1: The voice of children and young people is at the heart of planning.
We feel it is of importance to listen to our children and young people and this
measured in a number of ways including:
- Children and young people are able to comment on their placement through the
engagement of the Participation and Engagement Team
- Children and young people report that they feel happy where they live
31
Percentage of children participating in CLA reviews between April
2019 and March 2020
70%
60%
50%
40%
30%
20%
10%
0%
Apr May Jun Jul Aug Sep Oct Nov Dec Jan Feb Mar
Child attended & spoke for self 48% 46% 38% 43% 54% 48% 64% 59% 64% 43% 59% 48%
Child attended - advocate spoke 0% 1% 2% 0% 0% 0% 3% 2% 0% 3% 0% 0%
Child attended without contributing 3% 1% 2% 3% 9% 1% 1% 2% 0% 1% 0% 0%
The Mind of My Own App is one of the ways children and young people can feedback
how they feel about their placement, the following comments were taken from the
feedback when asked how they felt/ what they liked:
- Enthusiastic
- Get on well
- Safe, happy, part of the family
- School
- Computer access, hobbies, activities
- Personal space
- Excited
- Enjoy time together, they are good at listening
- I talk to them if I am worried, they care about me
- Calm
- The other kids, food, money, friends, school, Wi-Fi
- Safe
- Safe and settled
- Its ok, part of the family
When asked about the things we could do better, children and young people
feedback the following comments below:
32
Next steps
- To create a culture of listening to children and young people and hearing back
from them about the services they receive and improving our relationships with
them.
- The ideas from children, young people and their families contributing to the
shaping of service development and service improvements
- Ensuring the voice of the child is at the heart of assessment, planning and
intervention
- Ensuring that children who are looked after and children who are subject to a
Child Protection plan know they can ask for an advocate and are supported to
attend/contribute to conferences and reviews
- Ensure that all internal processes are focused on the child and maximise the
impact of money spent to ensure that the best outcomes are achieved.
- Ensure that all processes are efficient and minimise any potential wasting of
resources.
33
Priority 2 – Achieving Placement Stability and Permanence
As a part of our national reporting, this indicator measures the percentage of Children
Looked After aged under 16 at who have been looked after continuously for at least
2.5 years who were living in the same placement for at least 2 years, or are placed
for adoption and their adoptive placement together with their previous placement
together last for at least 2 years.
More children achieved permanency through adoption in 2019-20 in Thurrock and an
increased number are identified for 2019-20 with adoption as a potential permanence
plan. A total of 15 children were adopted in 2019-20 compared to 13 in 2018/19.
Where possible, we want all our children to be in placements which provide them with
long term placement stability, and where appropriate to leave care.
We describe this as achieving permanence for that child. Although it is sometimes
necessary to move a child to provide them with a better placement our aim is to
minimise the number of times each child changes placement as this can be very
disruptive. To achieve permanence it is essential that all our teams work effectively
together to support each placement. Permanence can be achieved in a number of
ways, including adoption, special guardianship order, child arrangement order or
matched for long term fostering. Each of these options gives the chance for the child
to achieve stability and achieve their potential.
Ensure there is sufficient support available for children to achieve their long
term care plans to prevent Children Looked After remaining in placements
which may not best meet their needs.
Next steps
- Continually review all placements to understand where there is opportunity to
support permanence or where a child might be better served by moving to a
different placement.
- Improve the placement review process to ensure all placements are regularly
brought before the placement panel for review and all options for that child are
considered at this time so each child is able to move towards permanence
where appropriate.
- Ensure all children who are at the edge of care and those becoming looked after
are part of a Family Group Conference/Meeting.
- Put in place necessary support for our carers and children in care to enable long
term placements. This covers placement support such as therapeutic
intervention to ensure the carer’s home can meet the needs of the children
placed with them.
- Raise awareness of and assist carers to apply for Special Guardianship Orders
wherever suitable to ensure that this option is available to achieve permanence
for children who are Looked After.
- Improve our offer of life story work for children.
- Review all approved connected carers to see whether an SGO would be more
34
appropriate to meet the child’s long term needs.
To recruit sufficient adopters, maintain existing placements as the number of
available adopters continues to fall across the UK and further develop our
adoption support services to achieve and secure improvements in service
delivery.
Next Steps
- Implementation of the Adoption Recruitment Strategy.
- Raise awareness of support for those who have adopted through more effective
use of social media.
- Increase targeted support groups for families to allow early intervention where
a placement might be at risk of breaking down.
- Maintain quality and quantity of matches through a review of processes to
ensure they are robust and achieve what is right for the child
- Increase our early intervention and therapeutic offer to provide the additional
support for adopters funded through the Adoption Support Fund (government
funding to provide therapeutic support to adoptive families)
Priority 3 – Recruitment and Support of Foster Carers
There are three main types of foster care available to our children who are looked
after. Where possible we keep children with people they already have some form
of relationship with, this type of placement is Family and Friends Foster Care.
When a child is first referred to us we will speak to any proposed carers to assess
whether they will be able to provide the support that child needs. If we cannot find
a suitable related carer, we will try to place them with one of our Thurrock ‘in-house’
carers. Only where we cannot identify an in-house placement to meet their needs
will we then look to place them with an Independent Fostering Agency (IFA) as
these placements are more likely to be outside of Thurrock.
It is a priority for us to significantly increase the number of children placed with
Thurrock Council foster carers as placements are more likely to be local and carers
will have access to local clinical support and specialist training along with local
supervising social workers, however we value to role that independent fostering
placements have in meeting the diverse needs of our Children Looked After. We
have set a target to increase in house placements by 20 year on year and increase
the proportion of children placed locally with in-house carers. The importance of
placing children and young people with foster carers where appropriate means that
we will also continue to recruit from the independent sector as a part of the
commissioned framework.
In 2019/20 the service was successful in recruiting 19 fostering households. At the
beginning of COVID-19, recruitment had good momentum. The fostering
recruitment strategy highlights the key areas which result in the increased
recruitment of fostering households. Enquiries are steady but progression to
application is slower as applicants deal with the uncertainty of COVID-19. This is
a similar experience to other authorities and is confirmed in the feedback from our
35
Eastern Region colleagues. The decision to provide a Council Tax rebate for
Thurrock foster carers provides financial support as well as emphasising the value
Thurrock places on the fostering community and the care they provide to Thurrock
Children. The fostering recruitment campaign is being updated to create new
marketing opportunities, the idea is to focus on our local communities, enhance
the profile of Thurrock and our excellent offer to increase successfully approved
fostering households.
Next Steps
- To ensure that there are more foster carers recruited that are recruited than
resign or are de-registered so that the total number of foster care households
increases year on year.
- Increasing local engagement and raising awareness of fostering with Thurrock
through an updated fostering recruitment campaign and brand.
- To increase the number of independent foster carers on the select list to further
increase the availability of foster care placements
-
Priority 4: Commissioning and Partnership Working
Thurrock continues to place and match all those children and young people requiring
a placement. Children would benefit from increased choice in placements that support
their education and proximity to Thurrock. In order to support placement choice, a
newly refreshed fostering campaign is being launched with the additional offer of
Council Tax rebate.
The enhanced placements offer is supplemented through the annual placement
commissioning review which has enabled Thurrock to develop a framework of
providers who have clear quality frameworks bringing a consistent approach to the
commissioned provision which includes IFAs and residential care. Whilst this has
been successful, there is still a need to spot purchase foster and residential provision.
Close working such as the partnership between Children’s and Housing to support
Care Leavers accommodation and support is providing a range of opportunities to
jointly commission provision. In addition, we work closely with the Thurrock Clinical
Commissioning Group (CCG) particularly for cases where there are significant care
needs. Residential places are currently purchased according to need and where
appropriate, agreed through a joint decision making process. It is acknowledged that
where there are complex needs the market drives the cost and availability of
provision, this is an issue facing local authorities across England and continues to be
a priority for us to address. Placements for children with significant health needs are
jointly funded with the Continuing Care team in the Clinical Commissioning Group.
The Mind of My Own app is being used to consult with young people around their
health and the health services they receive in order to feed back to the Children
Looked After Heath Steering group.
36You can also read