Choc Horror: Jo Swinson MP - Excess packaging and plastic waste in Easter Egg packaging in 2018 - cloudfront.net
←
→
Page content transcription
If your browser does not render page correctly, please read the page content below
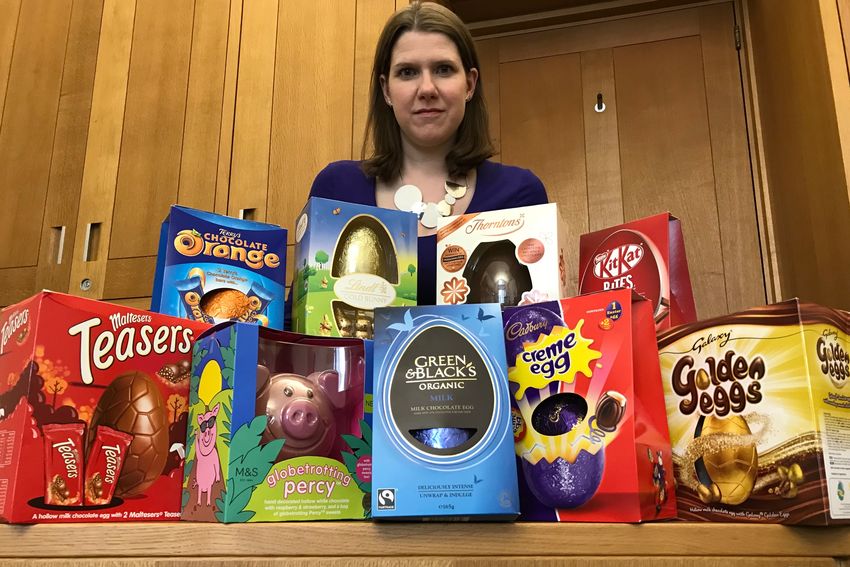
Choc Horror:
Excess packaging and plastic waste in Easter Egg
              packaging in 2018

              Jo Swinson MP

                       !1                   March 2018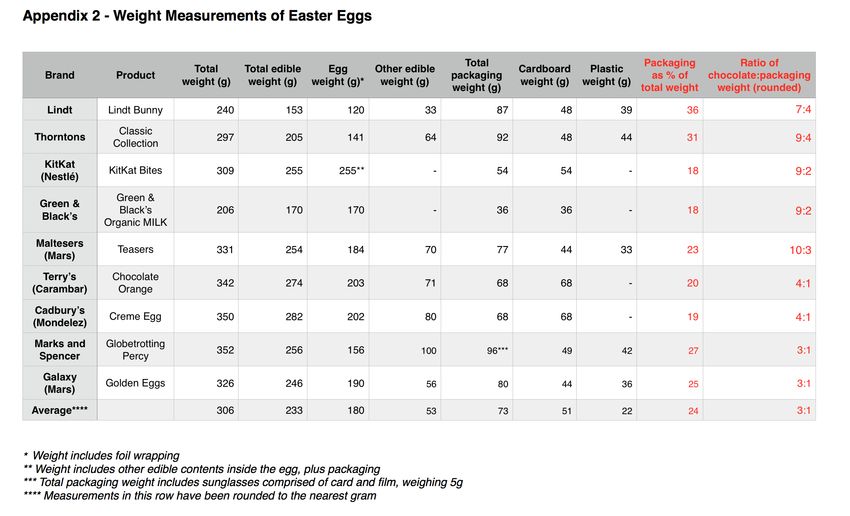
Contents

Key findings                                                   3
Foreword from Jo Swinson                                       4
Why it matters                                                 5
Scope of the report                                            7
What’s the story in 2018? Analysis of the results              8
2018 League Tables                                             9
Appendix 1 - Descriptive and Environmental Information        11
Appendix 2 - Weight Measurements of Easter Eggs               12
Appendix 3 - Volume Measurements of Easter Eggs               13

                               !2                        March 2018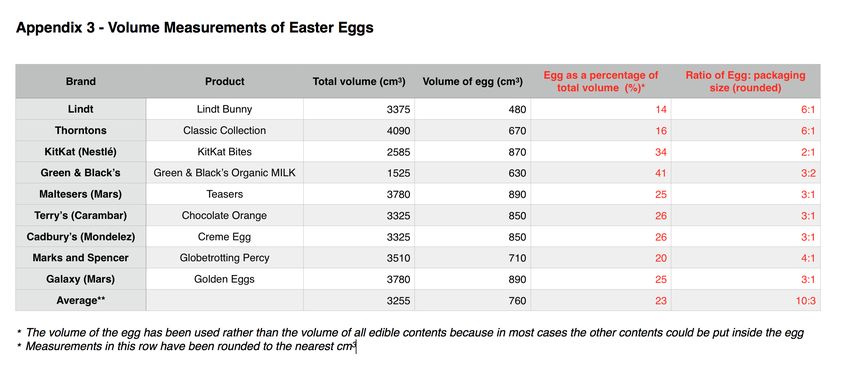
Key Findings

• This report found that the worst offender for excess packaging on Easter
  Eggs is Lindt, with the Egg itself taking up less than one sixth of the
  total size of the box, and the packaging accounting for over 36% of the
  total weight (a chocolate to packaging ratio of almost 2:1).

• This year’s winner is Green & Blacks. Packaging accounted for 18% of
  the total weight (a chocolate to packaging ratio of almost 5:1), and the
  size of packaging was relatively small compared to the size of the Egg
  which took up more than 41% of space in the box.

• With a few exceptions, packaging levels on Easter Eggs have not
  improved since the previous report in 2012, and the average chocolate to
  packaging weight ratio is still 3:1.

• 5 of the brands investigated used a substantial amount of plastic (>30
  grams) for packaging their Eggs. This sort of plastic is now more widely
  recycled by local authorities, but many still do not offer kerbside
  collections of this plastic, meaning that significant amounts of Easter
  Egg packaging could end up in landfill or even the oceans.

                                      !3                            March 2018
Foreword from Jo Swinson
Six years on from my last report, and it is clear that the worst excesses of Easter Egg
packaging remain fully entrenched in the industry. Most major brands have failed to
streamline their packaging and - as was the case six years ago - the evidence points to
widespread complacency.
2010-2012 saw a noticeable reduction in Easter Egg packaging, as brands such as
Cadbury’s (Mondelez) streamlined their packaging as part of their contribution to the
Courtauld Commitment 2.1 The removal of plastic packaging by the company in 2011 was
a welcome step forward, but little progress has been made in the last 7 years on further
reducing packaging levels.
Of particular concern this year was that three brands - Cadbury’s, Mars2 and Terry’s -
failed to include proper recycling information. In recent years, increasing numbers of local
councils now offer recycling facilities for the type of of PET 1 plastic typically found in
Easter Egg packaging, so it is vital that this is properly communicated to consumers. More
disappointing still was that the packaging on two eggs (Thorntons and Marks and
Spencer), included a non-recyclable plastic bag around the smaller edibles. This report
calls on these two companies and any others to eliminate non-recyclable packaging
materials in their 2019 Easter Egg ranges.
Companies such as Nestlé have made progress in packaging their Eggs more efficiently. In
their KitKat Bites Easter Egg range, the accompanying chocolates are stashed inside the
larger hollow egg, thereby reducing the overall volume of packaging. That being said, a
cursory glance at the packaging still suggests considerable room for improvement.
Easter Eggs have typically been among the worst examples of packaging waste, and a
symbol of the excess plastic packaging that is still prevalent across the food industry and
other consumer industries. It is disappointing and worrying that major brands have still
not made substantial progress on curbing the worst excesses of this trend. This report
therefore calls on Easter Egg manufacturers to set an example by making 2019 the year
that we see an end to frivolous and excessive packaging on Easter Eggs.
1 Courtauld Commitment 2 (2010-2012) was a voluntary agreement aimed at improving resource efficiency
and reducing the carbon and wider environmental impact of the UK grocery retail sector. It considered the
journey of products, from manufacturing to disposal, to see where the greatest efficiencies could be made
both environmentally and economically. For a report on the results, see: http://www.wrap.org.uk/sites/
files/wrap/Courtauld%20Commitment%202%20Final%20Results.pdf.
2 This report notes inconsistency among Mars eggs on recycling information. Some eggs contained detailed
information (e.g. Galaxy Eggs), whereas others displayed only a recycling sign (e.g. Maltesers Teasers).
!4 March 2018Why it matters
A staggering 8.3 billion metric tons of plastic has been produced on Earth to date,
according to researchers at the University of Georgia.3 Of this, 6.3 billion tonnes (76%) of
plastic waste has been generated, which is heavier than more than 1 billion elephants.4
Around four fifths (79%) of this waste is deposited in landfill or discarded in the natural
environment.
Even the scientists who conducted this research were shocked and appalled by the scale of
their findings, with one remarking that these levels would “break any system that was not
prepared for it” and suggesting that “this is why we have seen leakage from global waste
systems into the oceans.”5
The urgent need to preserve our planet’s oceans is now firmly in the spotlight. 14 million
viewers watched the BBC’s Blue Planet 2 last year.6 276 MPs across 8 different parties
have now signed up to the Blue Belt Charter, pledging their support to give the Overseas
Territories Governments the resources to create a vast network of marine reserves to
protect the surrounding waters which are home to a quarter of the world’s penguins.7
Plastic in our oceans is a real problem. Only last week, new research on the Great Pacific
Garbage Patch - a huge mass of plastic and debris in the Pacific Ocean - suggested that
between 45,000 –129,000 tonnes of ocean plastic are floating inside an area of 1.6million
km2; a figure 4 to 16 times higher than previously reported and more than 6 times the size
of the UK.8
The plastic packaging from Easter Eggs can all too easily find its way into the ocean. In
England alone, there are more than 1200 historic landfills in low-lying coastal areas at risk
of being breached by erosion.9 Stringent regulations on waste management didn’t come
into force until 1994,10 so many of these historic coastal landfills could contain plastics that
may end up in the sea. It’s not just old landfill sites; on our streets too, plastic that spills
out of bins gets blown into drains and ends up in the sea.
3 http://advances.sciencemag.org/content/advances/3/7/e1700782.full.pdf
4 The average male African bush elephant weighs 6,000kg. Therefore 6.3 billion tonnes of plastic waste is
equivalent to 1.05 billion elephants.
5 https://news.nationalgeographic.com/2017/07/plastic-produced-recycling-waste-ocean-trash-debris-
environment/
6 http://www.bbc.co.uk/news/entertainment-arts-42641146
7 For more info, visit: https://greatbritishoceans.org/
8 https://www.nature.com/articles/s41598-018-22939-w.pdf
9 https://onlinelibrary.wiley.com/doi/epdf/10.1002/wat2.1264
10 The Waste Management Licensing Regulations 1994 (S.I. 1994/1056)
!5 March 2018It is therefore alarming that 5 out of the 9 Easter Eggs investigated in this report used a
substantial amount of plastic packaging (>30 grams), while another 2 contained plastic-
wrapped chocolates. Improvements have been made at a local level when it comes to
recycling plastics - the proportion of local authorities offering kerbside collections of non-
bottle rigid plastic packaging has grown from 20% in 2008/09 to an estimated 67% in
2014/1511 - but this still means that a lot of the plastic used in Easter Egg packaging does
not get recycled and could end up in our oceans.
The size of Easter Egg boxes matters too. Larger boxes mean that fewer eggs fit on each
lorry, so more journeys are required, leading to higher CO2 emissions. The largest Easter
Egg box found in this report was Thorntons (4090cm3), where around 8,000 eggs would fit
on a lorry.12 The smallest, Green & Black’s (1525cm3), contained almost as much chocolate
as in the larger Egg box, yet over 20,000 could fit on each lorryload. Figures from 2015
show that 147.7 million hollow eggs were sold in the UK,13 and so the difference in
packaging size between the Thorntons Egg and the Green & Black’s Egg could stack up to
almost 12,000 extra lorry journeys14, meaning an extra 385 tonnes of CO2 emissions.15
11 http://www.wrap.org.uk/sites/files/wrap/Plastics_Market_Situation_Report.pdf
12 Calculated using standard capacity of a 7.5t Curtain lorry (32.24m3).
13 https://www.statista.com/statistics/531148/easter-chocolate-confectionery-sales-value-uk/
14 The number of journeys required would be 6,987 for Green & Black’s and 18,738 for Thorntons - a
difference of 11,757.
15 A normal sized lorry travelling at 80km/h will produce on average 32.7kg of CO2 emissions over 100km.
Full table used for calculations accessible here: https://www.theyworkforyou.com/wrans/?id=2013-03-01a.
144740.h
!6 March 2018Scope of the report
This report sets out to measure three aspects of Easter Egg packaging:
(1) Recyclability and environmental-friendliness
(2) The weight of packaging as a proportion of total weight
(3) The volume of the egg as a proportion of the whole package
A recent study from Which?16 focuses on (2) as an indicator of packaging excesses.
However, this report takes the view that weight is not necessarily the most accurate way
to measure packaging levels on Easter Eggs, since card and plastic packaging will always
be relatively light compared to the chocolate inside (picture a small but dense egg
suspended in a large hollow cardboard box).
Consequently, this report focuses on (1) and (3) as the more reliable indicators of
packaging levels, since the former gives an idea of the amount of plastic waste that could
end up in our oceans, and the latter measures the size of the egg itself in relation to the size
of the packaging it sits inside. As discussed above, unnecessarily large packaging takes up
more space on lorries and requires extra journeys, which increase carbon emissions.
16 https://www.which.co.uk/news/2018/03/the-truth-about-easter-egg-packaging/
!7 March 2018Analysis of results: 2018’s winners and losers
Luxury brands are the biggest culprits when it comes to excess packaging on Easter Eggs,
with Lindt the worst offender of the brands investigated in this report. The hollow egg
occupied a mere 14.2% of space inside the box, and the packaging alone contributed to
36.3% of the total weight. The Lindt egg was also the most expensive product, relative to
the weight of the contents. Thorntons was not far behind, with the egg taking up only
16.4% of space and 31% of weight coming from the packaging.
This year’s winner is Green & Black’s. Their Milk Chocolate Egg took up the greatest
proportion of packaging space (41.3% of the total volume) and their packaging weighed
the least relative to the total weight of the box (17.5% of the total weight).
Most improved was Nestlé, who have streamlined packaging on their KitKat Bites egg by
hiding the accompanying chocolates inside the larger hollow egg, thereby reducing the
overall volume of packaging. The KitKat Bites box was the 2nd smallest (2585cm3) after
Green & Black’s.
5 out of the 9 Easter Eggs investigated in this report used extensive plastic packaging.
Marks and Spencer’s Egg was the worst for recyclability. Their Egg contained 2 plastic
inserts, in addition to sweets packaged in a non-recyclable plastic bag. Other losers were
Lindt and Thorntons (plastic insert + plastic wrapped chocolates), and two others also
contained plastic wrapped chocolates (Terry’s Chocolate Orange, KitKat Bites). The Green
& Black’s Egg was the most environmentally friendly.
Disappointingly, 3 of the eggs contained no substantial recycling information on their
packaging (Maltesers, Terry’s, Cadbury’s), although others such as KitKat contained
detailed information, even if some of the packaging was not widely recyclable.
!8 March 2018Fig 1: 2018 League Table - best and worst overall packaging
Rank* Brand (from best to worst overall packaging)
1 Green & Black’s
2 Nestlé
3 Cadbury’s
4 Terry’s
5 Mars
6 Marks and Spencer
7 Thorntons
8 Lindt
* See footnote17
Fig 2: 2018 League Table - breakdown by packaging measurement
Weight of packaging relative to Egg size as percentage of total
Rank Recyclability*
total weight package size
1 Green & Blacks (17.5% of total) Green & Black’s (41.3% of total) Green & Black’s
2 Nestlé Nestlé Cadbury’s
3 Cadbury’s Terry’s Terry’s
4 Terry’s Cadbury’s Nestlé
5 Mars Mars Mars
6 Marks and Spencer Marks and Spencer Lindt
7 Thorntons Thorntons Thorntons
8 Lindt (36.3%) Lindt (14.2%) Marks and Spencer
* See footnote18
17 This ranking is calculated by giving a ‘score’ to each brand, based on their ranking for each column in Fig
2. The lower the score, the less excessive the packaging. For example, Cadbury’s is ranked 3rd, 4th and 2nd,
giving it a total score of 9 points, whereas Lindt comes 8th, 8th and 6th, giving it a total of 22.
18 This ranking is calculated from the proportion of recyclable contents, and how widely recycled each is by
local authorities. For example, plastics not as widely recycled in kerbside collections compared to cardboard.
!9 March 2018Comparison of Easter Egg packaging relative to 2012 levels19
Packaging as % of total Packaging as % of total % vol of egg to % vol of egg to
Brand
weight (2012) weight (2018) total vol (2012) total vol (2018)
Mars 24 25 ↑ 21 25 ↑
Green & Black’s 17 18 ↑ 42 41 ↓
Cadbury’s 19 19 → 29 26 ↓
Marks and Spencer 21 27 ↑ 58 20 ↓
Nestlé 25 18 ↓ 29 34 ↑
Thorntons 30 31 ↑ 15 16 ↑
Average 22.7 23 ↑ 32.3 27 ↓
19The 2012 report can be accessed here: https://www.2degreesnetwork.com/groups/2degrees-community/
resources/easter-egg-packaging-annual-progress-report-2012/attachments/5477/. Results in that report
were rounded to the nearest whole number, so the same has been done with the results obtained for this
year’s report, apart from averages which are correct to 1 decimal place. (N.B. Lindt and Terry’s not included
in 2012 report.)
!10 March 2018!11 March 2018
!12 March 2018
!13 March 2018
You can also read