CIRCULARITY GAP REPORT - THE - Gouvernement du Québec

Page created by David Carlson
 
CONTINUE READING
CIRCULARITY GAP REPORT - THE - Gouvernement du Québec
THE
CIRCULARITY
  GAP REPORT

 Closing the Circularity Gap in Quebec, Canada
CIRCULARITY GAP REPORT - THE - Gouvernement du Québec
CIRCLE ECO N O MY
                                                                                          Circle Economy works to accelerate the transition
                                                                                          to a circular economy. As an impact organisation,
                                                                                         we identify opportunities to turn circular economy
                                                                                         principles into practical reality. With nature as our
                                                                                         mentor, we combine practical insights with scalable
                                                                                            responses to humanity’s greatest challenges.
                                                                                           Through our multiple programmes, we translate
                          B E H I N D T H E CO V E R                                      our vision of economic, social and environmental
                                                                                                         prosperity into reality.
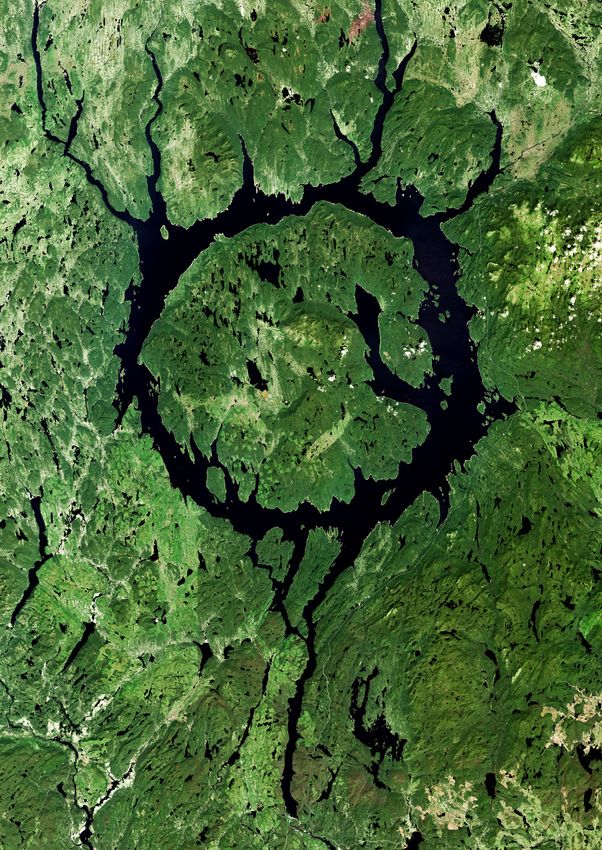
   The Manicouagan Reservoir was originally a meteorite crater; the fifth
   largest recorded on Earth, and is 214 million years old. Located in the
     Côte-Nord region, the crater, nicknamed ‘the eye of Quebec’, is the
emblem of the Manicouagan-Uapishka World Biosphere Reserve. Flooded
by the construction of the Daniel-Johnson Dam on the Manicouagan River
 in 1970, the reservoir, with a surface area of 2,000 square kilometres and
an average depth of 73 metres, is one of the largest reservoirs in the world
                        in terms of volume and depth.                                                REC YC- QUÉB EC
                                                                                             La Société québécoise de récupération et de
                                                                                         recyclage (RECYC-QUÉBEC) is a leader in responsible
                                                                                            waste management in Quebec. Since 1990, the
                                                                                            government-corporation has strived in making
                                                                                            Quebec a model for innovative and sustainable
                                                                                          waste management. Their mission is to promote a
                                                                                          circular economy and fight against climate change
                                                                                          by encouraging best practices in waste prevention
                                                                                                          and management.

                                                                                This report is published as an affiliate project of the Platform for Accelerating the
                                                                                 Circular Economy (PACE). PACE is a public-private collaboration mechanism and
                                                                               project accelerator dedicated to bringing about the circular economy at speed and
                                                                               scale. It brings together a coalition of more than 70 leaders and is co-chaired by the
                                                                                heads of Royal Philips and the Global Environment Facility. It was initiated at the
                                                                                World Economic Forum and is currently hosted by the World Resources Institute.
CIRCULARITY GAP REPORT - THE - Gouvernement du Québec
IN SUPPORT OF THE
CIRCULARITY GAP REPORT

                                     The first circularity index of the Quebecois economy is a
                                     concrete, effective and balanced measure that demonstrates                                             Post-covid-19 economic recovery represents an
                                     once again that the economy and environmental protection                                               unprecedented opportunity to make the transition
         BENOIT CHARETTE             are compatible. I commend RECYC-QUÉBEC’s leadership in                     HÉLÈNE L AUZON              to a more circular economy. From the extraction of raw
      Minister of the Environment    this area and invite all sectors of Quebec’s economy to work             President & CEO, Quebec       materials to the management of residual materials,
             and the Fight against   together to rise to the challenges that have been identified.              Business Council on the     Quebecois enterprises are showing ingenuity and creativity
                   Climate Change    Together, we must develop a long-term vision that will ensure                 Environment (CPEQ)       to develop innovative solutions in this regard. They will be
                                     our natural resources are managed in a way that respects the                                           present to ensure a large-scale deployment of
                                     environment, the health and quality of life of the population,                                         the circular economy.
                                     while drawing inspiration from best practices worldwide.

                                                                                                                                            Thanks to this report, Quebec now has clear data on which
                                                                                                                           C L AU D E       sectors to prioritise in order to accelerate the transition to
                                                                                                               M A H E U X- P I C A R D     the circular economy. This will make it easier to measure
                                     The strong presence of civil society organisations noted in            Executive Direc tor, Centre     the tangible impact of our actions. There is a lot of work
                                     the report is an important asset for reconciling economic,            de transfer t technologique
           BÉATRICE AL AIN                                                                                                                  ahead, but by combining our efforts, a quick increase in our
                                     environmental and social issues at the territorial level and           en écologie industrielle et
               Executive Director,                                                                                                          circularity index is possible. It is a societal project that we
                                     over the long-term. These actors—including the social                         territoriale (C T TÉI)
    Chantier de l’économie sociale                                                                                                          must all adhere to!
                                     economy movement—are key to deploying the circular
                                     economy to serve both individuals and communities.

                                                                                                                                            Private companies in the main sectors of Quebec’s green
                                                                                                              R I C H A R D M I M E AU      economy are natural allies in the transition to a circular
                                                                                                        Executive Director, Conseil des     economy. Although this transition has already begun, we will
                                     Through their proximity to citizens, businesses and                   entreprises en technologies      continue to work in collaboration with all the players in the
       ANDRÉ BELLAVANCE              institutions, cities are at the heart of the transition to the     environnementales du Québec         value chain our industry belongs to, in order to promote a
                                     circular economy. Many innovative projects are being                                     (CETEQ)       favourable environment where resources will be optimised
            Mayor, Victoriaville
                  President of the   deployed, particularly in my own city, but there is still an                                           and valued fairly.
         Environment Commission,     urgent need for action to create a greener, more resilient and
        Union des municipalités du   sustainable society. Together, let’s pool our strengths to bring
                   Québec (UMQ)      about these necessary changes.
                                                                                                                                            Making the economy more circular is an essential component
                                                                                                                                            of the necessary transformation to a more equitable,
                                                                                                             GENEVIÈVE MORIN                inclusive, green and efficient economy. This report reminds
                                                                                                         President & CEO, Fondac tion       us of the urgency to act in this direction and proposes an
                                                                                                                                            approach that will facilitate the convergence of all actors as
                                     The Circularity Gap Report Quebec marks a significant                                                  well as the measurement of our collective progress.
                                     contribution to our understanding of both the challenge
                JACK FROESE          and opportunity to prevent waste and accelerate Canada’s
        Director, Metro Vancouver    transition to a circular economy. It underscores the need to
                Board of Directors   work together and offers key insights and practical ideas for                                          The transition to the circular economy is an imperative that
              Chair, National Zero   business, government, and civil society leaders to create a                                            affects all the economies of the planet. Since 2014, Quebec
                                                                                                           DA N I E L N O R M A N D I N
                    Waste Council    prosperous and resilient future for all Canadians.                            Direc tor, Center for    has played a pioneering role on the Canadian level. That
                                                                                                                 Intersec toral Studies     said, the exercise conducted as part of this report has made
                                                                                                                   and Research on the      it possible to clearly reveal, for the first time, not only the
                                                                                                            Circular Economy (CERIEC)       scope of the challenge that is the circularisation of Quebec’s
                                                                                                                                École de    economy, but also to reveal opportunities.
                                                                                                               technologie supérieure

4                                                                                                                                              Th e Ci r c ul a r i t y G a p R e p o r t | Q u e b e c 2 02 1   5
CIRCULARITY GAP REPORT - THE - Gouvernement du Québec
E XEC U T I V E
SUMMARY

Quebec is 3.5% circular, with a Circularity Gap of          The impact of each scenario is limited, but when            The circular economy can help Quebec make
over 96%. This means that the majority of resources         combined, Quebec can become 9.8% circular—nearly            ‘building back better’ a reality. When realigned,
the economy uses to satisfy its needs and wants             a threefold increase—and, crucially, cut its material       Quebec’s economy can meet circular ambitions. It is
are not cycled. Quebec has a complex, largely               footprint by nearly half (48.2%), to 16.6 tonnes per        already nearly entirely sustained by renewable energy,
linear economy that is accustomed to high rates             person.                                                     and it has state of the art infrastructure, a skilled
of extraction, production, trade and consumption.                                                                       labour force, high government spending power and a
Around 271 million tonnes of resources and materials        Quebec’s economy is full of potential, but there            thriving community of circular grassroots organisations
funnel into the economy every year, amounting to 32         are limitations in how much we can increase its             to help drive the transition. The province also boasts
tonnes per person—higher than the average Canadian.         Circularity Metric. The province’s consumption              immense regenerative capacity, due to its swathes
Although a high rate of consumption, a hefty material       rates drive a huge amount of local virgin resource          of forest land that continuously sequester carbon
footprint and a low Circularity Metric are typical for an   extraction and waste, as well as extraction and waste       and offer the province a competitive advantage. Our
industrialised economy engaged in trade, it calls for       abroad as it consumes imported goods. Managing              analysis and circular roadmap can assist the Quebec
an approach that not only aims to increase circularity.     the circularity of imports is difficult. Also, Quebec’s     government and relevant stakeholders in crafting a
Therefore, in this study, we also highlight strategies      continued expansion of infrastructure such as roads         bold and full plan for a circular economy; all part of
to reduce the number of resources needed to fuel the        and (renewable) energy limits short-term opportunities      rebuilding a robust, resource-efficient and circular
economy in the first place: the material footprint.         to become more circular. While sometimes necessary,         post-Covid-19 economy.
                                                            these resources remain locked away in stock and
The material footprint behind the Quebecois needs           not available for cycling, thereby weighing down the
and wants. This study provides a first approximation        Circularity Metric. So, even by increasing the Metric
of how resource use is allocated across Quebec’s            from the current 3.5% to 9.8%, the economy will need
needs and wants, such as Mobility and Housing. We           to undergo massive change. It’s also crucial to note
see that the needs’ material footprints originate, to a     that the way we measure circularity is complex and
large extent, from outside of the province through its      has many components: our scenarios result in massive
imports—typical for a developed trade region. Quebec        changes to the economy—including almost halving
fully functions on renewable energy for electricity         the amount of resources it uses to fuel the needs of
but still relies heavily on imported fossil fuels for       the province—that are not reflected in our Circularity
transport. The agricultural sector produces unusually       Metric. Our global Circularity Gap Report 2021, for
large amounts of waste, but little is currently reused or   example, found that we only have to double the globe’s
recycled. Also, the goods and services the government       circularity, reaching a Metric of 17%, to limit global
invests in—from providing computers for a public            warming temperature to well below 2-degrees. So, in
school to contracting a company to build a bridge           moving from 3.5 to 9.8% circular, Quebec in fact will
(public procurement)—are highly resource-intensive.         see its economy transform.
These components of the economy are reflected in
how resource use is allocated across the province’s         The circular economy is a means to an end. Closing
needs and wants: Services is the second-highest             the Circularity Gap serves the higher objective of
contributor to the material footprint—on par with           preventing accelerated environmental degradation
Nutrition—while Housing leads the way.                      and social inequality, on both a local and global
                                                            level. Transformative measures to cut greenhouse
A circular roadmap to close the Circularity Gap             gas emissions are inherent in the circular economy.
in Quebec. To close the Gap, we explore six ‘what-          Circular business models and improved resource
if’ scenarios that apply core circular strategies           efficiency are also a means to enhance emission
to transform the economy. The scenarios are (1)             abatement and reduce extraction, thereby improving
Design circularity into stocks, (2) Prioritise conscious    supply security and price stability when materials are
consumables, (3) Strive for circular agriculture,           kept in the province. The circular economy is a means
(4) Leverage government procurement, (5) Make               to achieving the end goal of a world that is ecologically
manufacturing circular and (6) Make mobility clean.         safe and socially just.1

6                                                                                                                                                                                 Th e Ci r c ul a r i t y G a p R e p o r t | Q u e b e c 2 02 1   7
CIRCULARITY GAP REPORT - THE - Gouvernement du Québec
CONTENTS

                               1   INTRO DUC TI O N

                                   10 - 11

                               2   M E TR I C S FO R
                                   CIRCU L A R IT Y
                                   Regional circularit y and the
                                   Circularit y Gap

                                   12 - 19

                               3   S I Z IN G QU E B EC ’ S GA P
                                   T he resource realit y of meeting
                                   societ al needs and want s

                                   20 - 27

                               4   B R ID G IN G TH E GA P
                                   ‘ W hat if ’ scenarios for circularit y

                                   28 - 49

                               5
                                   TH E WAY FO RWA R D

                                   50 - 51
Photo by Regis Hari Bouchard

      8                                                                      Th e Ci r c ul a r i t y G a p R e p o r t | Q u e b e c 2 02 1   9
CIRCULARITY GAP REPORT - THE - Gouvernement du Québec
1. INTRODUCTION

The materials flowing through the global economy           T I M E TO U P DAT E T H E S YS T E M                         such as on minerals, waste management and agrifood.             A N E C O N O M Y F U L L O F P OT E N T I A L
surpass 100 billion tonnes a year—and only 8.6%                                                                          The Plan also lays out the target of reducing the
                                                           Certain industries in Quebec have been able to                                                                                While Quebec’s Metric sits approximately 5% below
are cycled, reported our global Circularity Gap                                                                          province’s greenhouse gas emissions by 37.5% (compared
                                                           flourish under the linear economy, leading to many of                                                                         the world average, the make-up of its economy is
Report 2020, which launched at the World Economic                                                                        to the 1990 baseline) by 2030.10 The elements explored
                                                           Quebec’s successes today: a generally high standard                                                                           rife with opportunity for a circular transformation.
Forum. 2 Our 2021 edition highlighted that the                                                                           by the Plan are also spotlighted in a variety of other policy
                                                           of living, booming trade industries in diversified                                                                            Our analysis finds that there are many avenues for
transition to a circular economy is necessary to                                                                         documents, from the Québec Plan for the Development
                                                           metal and mineral extraction and a prominent and                                                                              boosting Quebec’s Metric, from diverting wet organic
close the Emissions Gap and limit the effects of                                                                         of Critical and Strategic Minerals11 to the Plan d’action
                                                           profitable standing as a net exporter within the country      2019–2024 de la Politique québécoise de gestion des matières    waste (garden, food and sluge) from landfilling and
climate breakdown—and how doing so will require
                                                           and around the world. Annually, Quebec imports                résiduelles12 (Action plan of the Quebec Residual Materials     incineration without energy recovery, to integrating
almost doubling the global Circularity Metric from
                                                           approximately 110 million tonnes of resources from                                                                            circularity into all aspects of public procurement. The
8.6% to 17%. 3 Quebec’s Circularity Metric, at 3.5%,                                                                     Management Policy) and Politique Bioalimentaire (Biofood
                                                           abroad to satisfy the needs of its population, and it                                                                         province has a strong foundation for future action:
sits well below the global average. While Quebec                                                                         Policy).13
                                                           extracts so much that its rate of domestic resource                                                                           close to 100% of its electricity generation comes from
is hailed for its almost entirely renewable energy
                                                           extraction per capita tops 24 tonnes—coming in                                                                                renewable sources, which will allow for a smooth
production and vast swathes of forests, its economy                                                                      However, both Canada and the province of Quebec lack
                                                           sixth place globally. 5 However, linear industries                                                                            transition to electrified transport, while waste recovery
is characterised by high levels of consumption and                                                                       concrete circular plans or goals; such as the EU’s Circular
                                                           are dependent on unsustainable processes and                                                                                  volumes outrank those of Europe. It also touts high
imports, large volumes of virgin resource extraction                                                                     Economy Action Plan that sets out 54 actions across
                                                           consumption rates that outweigh the resource capacity                                                                         government spending power and a thriving community
and relatively low levels of cycling. The average                                                                        waste, landfill, reuse and recycling with end goals set for
                                                           of the earth. And now, globally, urgency is building.                                                                         of circular grassroots organisations. Nonetheless,
European has a material footprint of almost 20                                                                           2030 and 2035, or the Dutch government’s goal of full
                                                           Experts predict that climate breakdown—not                                                                                    Quebec’s consumption—leading to high levels of waste
tonnes 4 per year, while for the average citizen in                                                                      circularity by 2050. There is ample space for thorough
                                                           Covid-19—will be the biggest global health threat of the                                                                      within and beyond the province’s territorial bounds—
Quebec, it’s 32 tonnes per year. Our analysis reveals                                                                    plans to be implemented into Quebec’s strategies
                                                           century and a world operating under a linear system                                                                           leaves room for improvement. In this report we present
several avenues through which the Quebec economy                                                                         and policies moving forward—the iteration on the
                                                           is not resilient to change.6 Importantly, the scale of the                                                                    five scenarios that will almost triple its Circularity
can shift away from linearity and integrate into this                                                                    government’s sustainable development strategy (2022
                                                           solution needs to match the scale of the emergency.                                                                           Metric and cut its material footprint by half, making the
promising and hopeful global systems-shift: the                                                                          to 2027) serving as a good example. Our analysis can
                                                           Business-as-usual is no longer an option.                                                                                     most of the opportunities its economy provides and
circular economy.                                                                                                        provide a benchmark measure of circularity and
                                                                                                                                                                                         ingraining circularity every step along the way.
                                                                                                                         resource use for the province, which is integral for
                                                           This is where the circular economy comes in. By
THE RISKS OF THE LINEAR ECONOMY                                                                                          goal-setting and measuring progress.
                                                           designing out waste and pollution, keeping products
                                                                                                                                                                                         A I M S O F T H E C I R C U L A R IT Y
Much of the globe operates within the linear economy—      and materials in use, and regenerating natural systems,7
                                                                                                                         C OV I D -19 A N D B U I L D I N G B AC K B E T T E R           GA P R E P O R T Q U E B E C
characterised by ‘take-make-waste’ processes powered       a circular economy allows us to collectively reimagine
by fossil fuels. The linear economy relies on obtaining    and redesign our systems to ensure an ecologically safe       Many of the repercussions of Covid-19 on social and             1.    Provide a snapshot of how circular Quebec is by
large quantities of energy and materials through           and socially just space for us all. 8 As a multistakeholder   economic levels served to hold a magnifying glass to                  applying the Circularity Metric.
emission-heavy processes, that are quickly used to         model, the circular economy’s systems-thinking                the flaws in our system. As trillions of dollars funnel into    2.    Identify how materials flow throughout the
satisfy needs and wants—be it Nutrition or Mobility—       approach boosts capacity and capability to serve              economies to facilitate Covid-19 rescue and recovery                  economy and how they may limit or boost the
and then disposed of. This system has allowed some         universal societal needs in a way that functioning social     measures, calls for ‘building back better’ have been loud.            current Circularity Metric and the material
people, in some parts of the world and at certain times,   systems fall within healthy planetary boundaries.9            Within this, the circular economy is increasingly hailed              footprint.
to prosper and economies to grow.                          This circular framework aligns with a vision of a more        as the system that the globe must adopt if we are to
                                                                                                                         be prepared for future crises. In rolling out rescue and        3.    Spotlight possible interventions within significant
                                                           resource-aligned, people-centric future.
                                                                                                                         recovery measures, many see a valuable opportunity to                 industries that can aid Quebec’s transition to
The processes central to how we make and produce
                                                                                                                         review business-as-usual practices, models and markets                becoming circular and reducing its material
goods in this system quickly strip finite materials        N O C L E A R C I R C U L A R R OA D M A P
                                                                                                                         and to build a greener and low-carbon economy, which                  footprint.
of their value and lack efficiency. They also directly
                                                           Quebec’s Metric is 3.5%. This means, of the 271.1 million
contribute to climate breakdown, environmental                                                                           should be more resilient. Governments are now making            4. Communicate a call to action based on the above
                                                           tonnes consumed, 96.5% are not cycled back into the
degradation and biodiversity loss, and spur severe                                                                       decisions on how to set goals and spend capital.                   analysis, to inform future goal setting and agendas.
                                                           economy and are either locked into stock (such as
social repercussions and massive global inequalities—                                                                    The decisions national and subnational governments
                                                           infrastructure or machinery), dissipated, lost, or are
from food insecurity to poverty to restricted access to                                                                  make today will shape our future climate and the lives
                                                           considered circular biomass (see pages 26-27 for more
healthcare. Irrationally, these inequalities have been                                                                   of generations to come.
                                                           information). The Quebec government has launched the
able to increase concurrently with rising economic
                                                           2030 Plan for a Green Economy to replace its previous
wealth (GDP). Consistent and intensive extraction of                                                                     Quebec’s 2030 Plan for a Green Economy aims for the
                                                           Climate Change Action Plan that expired on
finite natural resources has also resulted in volatility                                                                 complete electrification of transport, and for buildings
                                                           the 31st of March 2021. It touts multiple policies related
across markets and resource scarcity and constraints.                                                                    and industrial activity to be increasingly powered by the
                                                           to a ‘green economy’ that include circular elements,
                                                                                                                         province’s renewable energy.

10                                                                                                                                                                                            Th e Ci r c ul a r i t y G a p R e p o r t | Q u e b e c 2 02 1   11
CIRCULARITY GAP REPORT - THE - Gouvernement du Québec
Measurements are critical to understanding the                systems include government institutions, businesses,
                                                     world around us. As it becomes more urgent to                 communities and markets.16 Provisioning systems are
                                                     adapt our economic system to become more                      the essential link between ecological and technical
                                                     circular, we need to provide a tactical approach              resource use and social outcomes. For example,
                                                     to measuring the transition—which can seem                    different forms of transportation infrastructure
                                                     abstract or complex. In the first edition of the              (railways versus motorways or car-sharing versus car
                                                     global Circularity Gap Report in 2018, Circle                 ownership) can generate similar social outcomes, but
                                                     Economy presented the Circularity Metric for the              at very different levels of material use. This is how
                                                     global economy. Since then, the Metric has formed             the circular economy can transform our economy

                         2
                                                     a milestone for global discourse on the circular              and enable us to thrive, yet with lower environmental
                                                     economy. This current analysis adapts the Metric              impact.
                                                     to suit a provincial profile. This section explains
                                                     how we assessed Quebec’s circularity using our                In this study we also consider the importance of
                                                     Circularity Metric and introduces supporting                  reducing consumption. This is because impact
                                                     metrics that help us understand the significant               prevention through reduction in demand is an
                                                     material flows that contribute to Quebec’s large              important first step to take before exploring
                                                     Circularity Gap. These additional insights aim                other mitigation options. This is reflected also by
                                                     to provide an answer to how the economy can                   environmental management hierarchies wherein
                                                     formulate a plan for moving toward circularity: it            reductions of production and consumption,
                                                     provides the initial assessment by locating circular          narrowing flows, is always the preferred and
                                                     opportunities and priorities in the material flows.           most effective strategy.
                                                     By measuring circularity in this way, businesses

METRICS
                                                     and governments can track their circular                      M AT E R I A L F LOW S A N D F O OT P R I N T S
                                                     performance over time and put trends into context,
                                                                                                                   In this analysis, we take the metabolism of a province—
                                                     as well as engage in uniform goal-setting and guide
                                                                                                                   how resources flow through the economy and are in
                                                     future action in the most impactful way.
                                                                                                                   long-term use—as the starting point for measuring
                                                                                                                   its level of circularity. Figure One, on the next page,
                                                     M E A S U R I N G C I R C U L A R I T Y: A M E A N S
                                                                                                                   provides a schematic depiction of the metabolism of
                                                     TO A N E N D
                                                                                                                   Quebec. It depicts the amounts of materials (divided

                         FOR
                                                     We need resources and materials to fuel our lifestyles.       into four key resource groups, which exclude water
                                                     However, the circular economy ensures that with               and air) embodied in inputs and outputs of highly
                                                     less material input and fewer emissions, we can still         aggregated industry groups. Due to the level of

                       CIRCU-
                                                     deliver the same, or better, output. But this requires        detail and intricacy of how materials flow through an
                                                     we break with the ‘take-make-waste’ tradition and             economy, we are not able to visualise all flows and
                                                     pivot towards a circular approach under which we              all sectors. Because the majority of materials flow
                                                     refrain from material extraction and optimise the use         through just a handful of sectors in an economy, we
                                                     of existing materials by minimising and eliminating           have limited our visualisation to show these. The left
                                                     waste. Ultimately, a world where circular strategies are      side shows the four resource groups as result of direct

                         L ARIT Y
                                                     dominant will be more socially just and ecologically          domestic extraction. These are minerals (limestone,
                                                     safe.                                                         copper, lithium, for example), metal ores (iron, cobalt,
                                                                                                                   titanium dioxide, for example), fossil fuels (petroleum,
                                                     Exactly how the circular transition can deliver more          for example) and biomass (food crops, forestry,
                                                     beneficial social and environmental outcomes is not a         manure, for example).
                                                     question with just one right answer, however. There is
                                                     no simple straight-line solution and the feedback loops       We also see on the left the volume of resources
                                                     in the system run in all directions.14 In particular, three   entering the provincial economy through imports.
                                                     connected spheres need to be taken into account: how          These are represented in terms of Raw Material
                         Regional circularit y and
Photo by Joanno Umes

                                                     resources are put to work to deliver social outcomes          Equivalents (RMEs)—the amount of material extraction
                         the Circularit y Gap        via provisioning systems. Provisioning systems                needed, anywhere in the world, to produce a traded
                                                     comprise physical systems such as road infrastructure,        product. Together, the domestic extraction and the
                                                     technologies, and their efficiencies15 and social             RME of imports comprise the total inputs

   12                                                                                                                 Th e Ci r c ul a r i t y G a p R e p o r t | Q u e b e c 2 02 1   13
CIRCULARITY GAP REPORT - THE - Gouvernement du Québec
(raw material input) of a provincial economy (read                                                                                                                                                                                 H OW W E C A LC U L AT E O U R                             •    Cycle flows—use again: The reuse of materials
more on page 18). Once in the economy, extracted                                                                                                                                                                                   CIRCUL ARIT Y METRIC                                            or products at end-of-life is optimised, facilitating
or traded raw materials, as well as the traded or                                                                                                                                                                                                                                                  a circular flow of resources. This is enhanced by
                                                                                                                                                                                                                                   In order to capture a single metric for circularity
domestically produced components, semi-products                                                                                                                                                                                                                                                    improved collection and reprocessing of materials
                                                                                                                                                                                                                                   in an economy, we need to reduce the complexity
and products, undergo operations that either                                                                                                                                                                                                                                                       and optimal cascading by creating value in each
                                                                                                                                                                                                                                   somewhat. Our starting point for this process is
transform them into end products or make them part                                                                                                                                                                                                                                                 stage of reuse. In practice: Design for recyclability
                                                                                                                                                                                                                                   measuring how resources flow through the economy
of the production process of another end product.                                                                                                                                                                                                                                                  (both technical and biological), design for
                                                                                                                                                                                                                                   and remain in long-term use. This approach builds on
These products then feed into satisfying the societal                                                                                                                                                                                                                                              disassembly, recycling, biomass waste-to-energy.
                                                                                                                                                                                                                                   and is inspired by the work of Haas et al. (2015)17 and
needs and wants of Quebec, such as Nutrition or
                                                                                                                                                                                                                                   continues the approach applied in all other national
Healthcare.                                                                                                                                                                                                                                                                                   If we effectively deploy strategies focused on
                                                                                                                                                                                                                                   Circularity Gap Reports.18 Taking an ‘X-ray’ of the
                                                                                                                                                                                                                                                                                              narrowing, slowing, cycling and regenerating the
                                                                                                                                                                                                                                   economy’s resource and material use, we consider six
                                                                                                                                                                                                                                                                                              flow of materials, we will ultimately require fewer
                                                                                                                                                                                                                                   fundamental dynamics of what the circular economy
                                                                                                                                                                                                                                                                                              materials to provide for similar needs. Because of
                                                                                                                                                                                                                                   transition aims to establish and how it can do so. This
                                                                                                                                                                                                                                                                                              this, fewer materials will be used by the economy,
                                                                                                                                                                                                                                   translates into two objectives and four strategies,
                                                                                                                                                                                                                                                                                              they will have longer lifespans and can be reused
                                                                                                                                                                                                                                   based on the work of Bocken et al. (2016).19 20
                                                                                                                                                                                                                                                                                              more effectively and with less harm caused to the
                                                                                                                                                                                                                                                                                              environment. For our Circularity Metric to capture
                                                                                                                                                                                                                                   The core objectives are:
                                                                                                                                                                                                                                                                                              this crucial process, we measure the share of cycled
                                                                                                                                                                                                                                   •   Objective one: Resource extraction from the
                                                                                                                                                                                                                                                                                              materials as part of the total material inputs into a
                                                                                                                                                                                                                                       earth is minimised and biomass production and
                                                                                                                                                                                                                                                                                              global economy. As such, it illustrates the current
                                                                                                                                                                                                                                       extraction is regenerative;
                                                                                                                                                                                                                                                                                              progress towards achieving the circular economy’s
                                                                                                                                                                                                                                   •   Objective two: The dispersion and loss of
                                                                                                                                                                                                                                                                                              ultimate goal of designing out waste through the four
      EXTRACTED, PROCESSED,                                                                                                                                                                                                            materials is minimised, meaning all technical
      PRODUCED ELSEWHERE                                                                                                                                                                                                                                                                      listed strategies.
                                                                                                                                                                                                                                       materials have high recovery opportunities, ideally
                                                                                                               S O C I E TA L N E E D S
                                                        RESOURCES

                                                                                                                                                                                                                    MANUFACTURED
                                                                                                                                                     HOUSING                C O M M U N I C AT I O N    SERVICES

                                                                                                                                                                                                                                       without degradation and quality loss; emissions to
                                                                                                                                                                                                                    GOODS

         IMPORT
                      IMPORT
                                                                    MINERALS   ORES   FOSSIL FUELS   BIOMASS
                                                                                                                                                                                                                                                                                              We capture circularity in one number, that we call
         FOOTPRINT                                                                                                                                   MOBILITY               HEALTHCARE                  NUTRITION
                                                                                                                                                                                                                                       air and dispersion to water or land are prevented;
                                                                                                                                                                                                                                                                                              the Circularity Metric. It is an ‘input-focused’ metric.
                                                                                                                                                                                                                                       and biomass is optimally cascaded.
                                                                                                                                                                                                                                                                                              Communicated as a percentage, it is a relative
                                                                                                                                                                                                                                                                                              indicator of how well global or national economies
                                                                                                                                                                                                                                   The four strategies we can use to achieve these
                                                                           PROVINCIAL ECONOMY                                             SOCIETAL
                                                                                                                                                                                                                                                                                              manage to sustain societal needs and wants with
                                                                                                                                                                                                                                   objectives are:
                                                                                                                                           NEEDS

                                                                                                                                                                                                                                                                                              materials that already exist. The value of this approach
                                                                                                                                                                PRODUCTS
                                                                                                                                                                                                                                   •   Narrow flows—use less: The amount of materials
      EXTRACTION                                                                                                                                                THAT LAST
                                                                                                                                                                                                       MATERIAL                                                                               is that it allows us to track changes over time, measure
                                 TOTAL MATERIAL INPUT

                                                                                                                                                                                                       STOCKS
                                                                                                                                                                                                                                       used or greenhouse gases (GHGs) emitted in the
                                                                                                                                                                                                                                                                                              progress and engage in uniform goal-setting, as well
                                                                                                                                                                                                                                       making of a product or in the delivery of a service
                                                                                                                                                                                                                                                                                              as benchmark countries’ circularity against each other
                                                                                                                                                                                                                                       are decreased. This is through circular design
                                                                                                                                                                                                                                                                                              as well as at the global level. Additionally, it should
                                                                                                                                                                                                                                       or increasing the usage rates of materials and
                                                                                                                                                                                                                                                                                              provide direction as to how Quebec can embrace its
                                                                                                                                                                                                                                       products. In practice: Sharing and rental models,
                                                                                                                                                                LOST

                                                                                                                                                                                                                                                                                              circular potential.
                                                                                                                                                                                                                                       material lightweighting, multifunctional products
                                                                                                                                                                                                                                       or buildings, energy efficiency, digitisation.
                                                                                                                                                                                                                                                                                              INSIDE THE CIRCUL ARIT Y GAP
                                                                                                                                                                                                                                   •   Slow flows—use longer: Resource use is
                                                                                                                                                                CYCLED

                                                                                                                                                                                                                                       optimised as the functional lifetime of goods is       To accelerate the transition toward a circular economy,
                                                                                                                                                                EXPORTED, STOCKED, WASTED,
                                                                                                                                                                                                                                       extended. Durable design, materials and service        we need to use data and data-driven insights in the
                                                                                                                                                                                                                                       loops that extend lifetimes, such as repair and
                                                                                                                                                                LOST OR CYCLED          ELSEWHERE

                                                                                                                                                                                                                                                                                              best way to support top-level decision making. To
                                                                                                                                                                                                                                       remanufacturing, both contribute to slowing rates      address the complexities and intricacies of a nation’s
                                                                                                                                                                                 EXPORT

                                                                                                                                                                                                                                       of extraction and use. In practice: Durable material   economy, it is our aim to provide as much information
                                                                                                                                                                 EXPORT
                                                                                                                                                                                 FOOTPRINT

                                                                                                                                                                                                                                       use, modular design, design for disassembly,           and context on how individual nations can better
                                                                                                                                                                                                                                       repair, remanufacturing, refurbishing, renovation,     manage materials to close their Circularity Gap. To
  NATIONAL ECONOMY                                                                                                                                                                                                                     remodelling.                                           understand a country or region’s Circularity Gap,
                                                                                                                                                                                                                                   •   Regenerate flows—make clean: Fossil fuels,             we must consider 100% of inputs into the economy:
                                                                                                                                                                                                                                       pollutants and toxic materials are replaced with       circular inputs, non-circular inputs and inputs that add
                                                                                                                                                                                                                                       regenerative sources, thereby increasing and           to reserves and stocks. These categories are based on
Figure One shows a schematic over view of the material                                                                                                                                                                                 maintaining value in natural ecosystems. In            the work of Haas et al. (2020). 21
footprint and metabolism of a region. Note: material stock                                                                                                                                                                             practice: Regenerative material use, renewable
and c ycled material flows are not scaled to propor tion.
                                                                                                                                                                                                                                       energy, regenerative agriculture.

14                                                                                                                                                                                                                                                                                                Th e Ci r c ul a r i t y G a p R e p o r t | Q u e b e c 2 02 1   15
CIRCULARITY GAP REPORT - THE - Gouvernement du Québec
Circular inputs (29.5%)                                     scale-up of biomass production were to become the              *We believe this share is much larger than what we repor t

1. Socioeconomic cycling (3.5% in Quebec)                                                                                  here. And this is due to our uncer tainties in our life- c ycle
                                                            norm, circularity could greatly increase. And what’s
                                                                                                                           approach. What this means is that life- c ycle based flows of
    This refers to the share of secondary materials         more, ecological cycling does play a crucial role in           r e s o u r c e s ( R M E s) a n d a n a t i o n a l s y s t e m b o u n d a r y a r e n o t e a s y
    in the total consumption of an economy: the             circularity: many of our scenarios, presented in               to reconcile in a coherent mass balance. Because of this , the
    Circularity Metric. These materials are items that      Chapter Four, promote bio-based materials in sectors           split bet ween ‘added to reser ves’ and ‘non-renewable materials’
    were formerly waste, but now are cycled back into       as diverse as housing and consumables—yet the                  i s d i f f i c u l t t o m e a s u r e a c c u r a t e l y. I t i s l i k e l y t h a t a b i g c h u n k
                                                                                                                           o f n o n - r e n e w a b l e i n p u t s i s a c t u a l l y a l l o c a t e d t o s t o c k s (19 % ) ,
    use, and includes recycled materials from both          impacts of such interventions are not reflected in the
                                                                                                                           however our current methodolog y limits our abilit y to assess
    the technical (such as recycled cement and metals)      Metric, but rather by a shift in ecological cycling. In this   t h i s i n a m o r e g r a n u l a r m a n n e r. W e a c k n o w l e d g e t h i s l i m i t a t i o n
    and biological cycles (such as manure and wood).        manner it can be said that the impact of our proposed          i n d a t a q u a l i t y, h o w e v e r, i t d o e s n ’ t d i r e c t l y i n f l u e n c e t h e M e t r i c .
    In Quebec, this number is well below the global         circular strategies is greater than the Metric may
    average of 8.6%, totalling 3.5% of total material       showcase.
    input.
                                                            Non-circular inputs (53%)
2.   Ecological cycling (26% in Quebec)                     1. Non-circular inputs (17% in Quebec)
     This is the share of renewable primary biomass              Fossil-based energy carriers, such as gasoline,
     (wood, food crops, agricultural residues) in                diesel and natural gas that are burned for energy
     the total consumption of an economy. To be                  purposes and emitted into the atmosphere are
     considered circular, biomass should be wholly               inherently non-circular: the loop cannot be closed
     sustainable: it must re-enter the cycle and                 on fossil fuels. In Quebec, the high share of
     contribute to new plant growth, allowing the                renewable energy lowers this rate, but fossil fuels
     ecosystem biocapacity to remain the same; but               are still imported and used for energy, heat and
     this is not often the reality. Therefore, to be             mobility.
     considered circular, primary biomass must at the
     very least guarantee full nutrient cycling and         2.   Non-renewable inputs (36% in Quebec)
     be carbon neutral. Because detailed data on the             Non-renewable inputs into the economy that are
     sustainability of primary biomass is not available,         neither fossil fuels nor ecologically cycled include
     the estimation of the ecological cycling potential          uncycled materials such as metals, plastics and
                                                                                                                                                                                                                                                   CIRCULARITY
     needs to rely on a broader approach: if the amount          glass. These are often embodied in consumer                                                                                                                                       GAP
     of elemental carbon from land use, land-use                 products, ranging from furniture and sports                                                                                                                                       96.5 %
     change and forestry (LULUCF) emissions is at                goods to aircraft components and machinery for
     least the same as the carbon content of primary             a range of sectors. Although these inputs to the
     biomass in the total consumption of an economy,             economy can in principle be cycled, 36% of these                                                                   %                                                                                              NON-RENEWABLE
                                                                                                                                                                               19
     then all the consumed biomass can be considered             inputs in Quebec are not and therefore cannot be                                                                                                                                                 36 %             INPUTS ( non-renewable
                                                                                                                                                                           k
                                                                                                                                                                                                                                                                                   materials )

                                                                                                                                                                      c
     carbon neutral. The huge volume of forested area            considered circular.

                                                                                                                                                                    o
                                                                                                                                                                 st
     in Quebec provides a significant basin for carbon

                                                                                                                                                               d
                                                                                                                                                           an
     sequestration, meaning that Canadian LULUCF            Added to reserves and stocks (19%)                                                                                                                                                                                     NON-CIRCULAR
                                                                                                                                                                                                                                                                  17 %

                                                                                                                                                        es
     emissions are certainly negative (-13 million tonnes   The vast majority of materials that are ‘added’ to the                                                                                                                                                                 FLOWS (fossil fuels)

                                                                                                                                                      rv
                                                                                                                                                    se
     for Canada), and the biomass consumed within its       reserves of an economy are ‘net additions to stock’.

                                                                                                                                                  re
     borders can be considered carbon neutral.              Countries are continually investing in new buildings                                                                                                                                                                   ECOLOGICAL CYCLING

                                                                                                                                                to
                                                                                                                                                                                                                                                                  26 %
However, while carbon neutrality is a necessary             and infrastructure, in order to provide Housing and                                                                                                                                                                    (carbon neutral biomass)

                                                                                                                                              ed
condition for biomass to be considered sustainable—it       Mobility, as well as renewable energy. This stock

                                                                                                                           QUEBEC

                                                                                                                                            Add
is not the only condition: nutrients (including both        build-up is not inherently bad; many countries need to
mineral and organic fertilisers) must be fully circular     invest to ensure that the local populations have access

                                                                                                                                                                                                                                        3.5
as well. As of yet, we have methodological limitations      to basic services, as well as build up infrastructure                                                                                                                                            SOCIO-ECONOMIC
in determining nutrient cycling, and to that end, have                                                                                                                                                                                                       CYCLING (circular
                                                            globally to support renewable energy generation,
                                                                                                                                                                                                                                                             technical materials)
not included ecological cycling in our calculation of       distribution and storage capacity. These resources do,                                                                                                                             %
Quebec’s Circularity Metric—even though this would          however, remain locked away and are not available
boost the province’s circularity rate to an impressive      for cycling, and therefore weigh down the Circularity                                  VIRGIN                                            CYCLED
29.5%. We take a precautionary stance with its              Metric.*                                                                               MATERIALS                                         MATERIALS
                                                                                                                                                   entering Quebec                                   entering Quebec
exclusion, with the knowledge that its impact on the
Metric may not be totally accurate. However, we do
                                                                                                                           F i g u r e Tw o s h o w s t h e f u l l p i c t u r e o f c i r c u l a r a n d n o n - c i r c u l a r
see great potential for the future: if the sustainable
                                                                                                                           materials that make up Quebec’s Circularit y Gap.

16                                                                                                                                                                                                                                                 Th e Ci r c ul a r i t y G a p R e p o r t | Q u e b e c 2 02 1   17
CIRCULARITY GAP REPORT - THE - Gouvernement du Québec
A C O M P L E X U N D E R TA K I N G : S C O P I N G A N D   country (aggregated by resource group). Because                 •   Quality loss and material degradation. The Metric
T R A D E DY N A M I C S                                     the GCI includes waste for recycling and partially                  focuses on materials that re-enter the economic
                                                             also secondary materials, we assume that this is a                  system once cycled, but does not consider in what
Applying the Circularity Metric to the global economy
                                                             good proxy for the estimation of the total amount of                composition, or to what level of quality. In this way,
is relatively simple, largely because there are no
                                                             secondary materials in the system. The underlying                   a plastic HDPE bottle may re-enter the economy
exchanges of materials in and outside of planet earth.
                                                             assumption is that—although varying in terms of                     as a recycled material. Its quality will determine
For countries and regions, however, the dynamics
                                                             volume—the imports of every country have the same                   whether it is used for building park benches or
of trade introduce complexities for which we must
                                                             average share of secondary materials per resource                   other products, for example. This variance would
adapt our Metric, resulting in certain methodological
                                                             group.                                                              not be documented in the Metric but has strong
choices. 22
                                                                                                                                 implications regarding material degradation.
                                                             To understand the amount of secondary materials                 •   Relative compared to absolute numbers. The
In assessing a country or region, we can either take
                                                             that are consumed domestically, rather than are                     Circularity Metric offers a percentage of the total
a production or consumption perspective. In a
                                                             exported, we make our second assumption: the share                  circularity performance by considering the relative,
production perspective, we consider all the materials
                                                             of secondary materials in the total consumption of                  or percentage-based, amount of cycled materials
involved in any sort of processing of production
                                                             raw materials is equal to the share of imported and                 as a share of the total material input. This means
activity, regardless of whether they are exported or
                                                             domestically cycled secondary materials in the total                that as long as the amount of cycled materials
consumed domestically. In a consumption perspective,
                                                             input of raw materials. 23                                          increases relative to the extraction of new materials,
we consider only the materials that are consumed
                                                                                                                                 we see the statistic improving, even though more
domestically. Whether we apply the Metric from a
                                                             P R AC T I C A L C H A L L E N G E S I N Q UA N T I F Y I N G       virgin resources are being extracted. This would
consumption or production perspective will yield
                                                             CIRCUL ARIT Y                                                       show progress, despite a key objective of the
different results. Our Circularity Gap Reports take
                                                                                                                                 circular economy not being met. To extrapolate the
a consumption perspective in a bid to generate               •   There is more to circularity than cycling. A                    Metric and avoid these uncertainties, it must be
actionable insights for the economy and consumption              circular economy strives to retain the value and                accompanied by contextual numbers for the full
on the ground, and to enable comparison between                  complexity of products for as long as possible,                 story.
countries.                                                       with minimal degradation. The socioeconomic
                                                                 cycling measured in the Circularity Metric is only          For a more exhaustive look into the methodology behind
Secondly, when considering what Quebec citizens                  one component of circularity. The Metric does not           the Circularity Gap Report, you can visit our website.
consume to satisfy their needs, we must apply a                  explicitly consider other strategies (slow, narrow
nuanced lens to direct imports; meaning we work                  and regenerate) that are core to building a circular
out the full material footprints of the products.                economy, such as asset sharing, reuse, lifetime
To account for the material footprint of raw materials           extension or remanufacturing. By reducing the
is straightforward, but this is not the case with                need for new products, they reduce the overall
semi-finished and finished goods. A motor vehicle, for           material footprint and waste that is available
example, may weigh one tonne when imported, but all              for cycling. So, what is a benefit for the circular
the materials used to produce and transport it across            economy, may not always show up as such in the
global value chains can weigh as much as 3.4 tonnes—             Metric.
its actual material footprint. To represent actual           •   Lack of consistency in data quality. Whilst
material footprints in imports and exports, we apply             data on material extraction and use are relatively
so-called raw material equivalents (RMEs) in this study.         robust, data on the end-of-use stage—landfill,
                                                                 incineration or composting, for example—are
Finally, the Circularity Metric considers all secondary          weaker. Although Quebec’s was above average,
materials as adding to a country’s level of circularity.         challenges nonetheless remain in quantifying
These secondary materials can be part of those cycled            national and provincial material flows and
within the country, as well as those that are imported           stocks. The weakness of the data is in part due
or exported, either as waste destined for recycling or           to the complexity of waste: it’s heterogeneous,
as secondary materials embedded in traded products.              geographically spread out, categorised differently
However, estimating the shares of traded secondary               across statistical sources and sometimes
materials is a difficult undertaking, so we introduce            not measured at all. Difficulties also occur in
an important assumption: in order to estimate the                calculating how waste materials are reused—
volume of secondary materials imported, we apply                 precluding an accurate analysis of for which goods
the average Global Circularity Index (GCI)—calculated            virgin materials are replaced by cycled waste.
per resource group—to the net direct imports of the

18                                                                                                                                                                                        Th e Ci r c ul a r i t y G a p R e p o r t | Q u e b e c 2 02 1   19
Quebec is 3.5% circular. This section investigates           The pressure on Shift countries—and Quebec—is to
                                                               the province’s resource metabolism: how they                 move away from over-consumption of the planet’s
                                                               are used, at what proportions, and to serve which            resources in servicing their relatively affluent and
                                                               societal needs and wants, such as Nutrition and              comfortable lifestyles. Their role in terms of global
                                                               Manufactured Goods. It also assesses how raw                 circularity is also prominent—the true impact of Shift
                                                               materials are processed and assembled to become              countries extends far beyond their national borders,
                                                               the products that address local needs. Visualising           with much of the environmental and social costs
                                                               what happens at end-of-use sheds light on the                incurred elsewhere.
                                                               accumulation of materials in products, goods
                                                               and the environment around us. Furthermore, it               DIFFERENT COUNTRIES, COMMON NEEDS
                                                               reveals that Quebec is a highly-consuming province,
                                                               with resource-intensive activities in the mining,            Despite clear divergences between countries, suitable
                                                               agriculture and forestry sectors. These observations         circular economy strategies can be developed
                                                               provide a clear starting point, so we can better             based on discernible common needs. Based on the
                                                               understand where sectors and supply chains should            two dimensions of Social Progress—indicated by a
                                                               focus their strategies as they move toward a circular        Human Development Index (HDI) score and Ecological
                                                               economy.                                                     Footprint—countries fall into three broad profiles:

                           3
                                                               G LO B A L C I R C U L A R I T Y: F R O M B A D
                                                               TO W O R S E

                                                               Circle Economy’s 2020 edition of the global Circularity
                                                               Gap Report revealed that circularity has wilted—the             Build—A low rate of material consumption
                                                               global rate of circularity shrank from 9.1% to 8.6% in          per capita means Build countries currently
                                                               just one year. What’s more, 2020 saw more than 100              transgress few planetary boundaries, if any
                                                               billion tonnes of materials entering the world’s economy        at all. But they are struggling to meet all
                                                               for the first time in history, bringing global resource         basic needs, including HDI indicators such as
                                                               use to new heights. Our 2021 report combined the                education and healthcare. Country examples:
                                                               twin agendas of the circular economy and climate                India, Bangladesh, Ethiopia.
                                                               change, ultimately bringing a message of hope: while

                         SIZING
                                                               consumption is spinning out of control and circularity
                                                               is in reverse, a circular roadmap has the power to close        Grow—These countries are manufacturing
                                                               the Emissions Gap by 2032. This would set us on a path          hubs, hosting an expanding industrial sector
                                                               to limit warming to well-below 2-degrees—and, crucially,        and leading the way when it comes to building.
                                                               meet the targets set out in the Paris Agreement.                This rapid industrialisation, as well as a growing
                                                                                                                               middle class, have occurred concurrently with
                                                               Our analysis also highlighted the key role of countries         rising living standards. Country examples:
                                                               in the race to leave linear behind: all nations have a          China, Brazil, Morocco.

                           QUEBEC’S                            role to play and a different road to take. Based on our
                                                               2020 report, which introduced three broad country
                                                               profiles (see the textbox for more information)—Build,

                          GAP
                                                               Grow, Shift—it’s clear that Quebec falls into the Shift         Shift—Home to a minority of the global popula-
                                                               profile. It enjoys a high score on the United Nations’          tion, material consumption in Shift countries is
                                                               Human Development Index, but has a large ecological             ten times greater than in Build. Their extraction
                                                               footprint: if everyone on our planet were to live like the      of fossil fuels is relatively high, as is their
                                                               Quebecois, we would require a volume of resources               participation in global trade. So despite high
                                                               that would take three and a half Earths to provide. 24          HDI scores that result in comfortable lifestyles,
                                                               Our analysis finds that Quebec’s material extraction            these countries have a way to go in consuming
Photo by Steven Wright

                                                               and domestic consumption both exceed that of the                resources in line with what the planet can pro-
                                                               Netherlands (found to be 24.5% circular)25 and is instead       vide. Country examples: US, Germany, Japan.
                           The res ource realit y of meeting
                                                               more on par with the extraction and consumption
                           s ocietal needs and want s
                                                               patterns of Norway (found to be 2.4% circular). 26

   20                                                                                                                          Th e Ci r c ul a r i t y G a p R e p o r t | Q u e b e c 2 02 1   21
products and materials after their functional use in
     S E V E N SO CIE TA L N E E DS & WA NT S                                                                       T H E M AT E R I A L F O OT P R I N T S AT I S F Y I N G
                                                                                                                                                                               our economy (End-of-use). This is mostly related to
                                                                                                                    S O C I E TA L N E E D S I N Q U E B E C
                                                                                                                                                                               the 271.1 million tonnes of material consumption:
     Here we describe the seven key societal needs and wants and which products and                                 The figure on the next page builds on the schematic        Quebec’s consumption footprint. In Quebec, the total
     services they include, as well as the volume of materials it takes to fulfil them from                         material footprint diagram in Figure One on page 14. It    amount of waste generated amounted to 16.2 million
     Quebec’s material footprint of 271.1 million tonnes. Since various products can be                             dives into the material metabolism of Quebec;              tonnes, of which an estimated 7.6 million tonnes
     allocated differently, here we make our choices explicit. For example, ‘radio, television                      linking how four resource groups (minerals, metal          came from Products that Last and 8.6 million tonnes
     and communication equipment’ can be classified either as part of Communication, or                             ores, fossil fuels and biomass) satisfy the seven key      from Products that Flow (see more information on
     as Manufactured Goods. We decided to subsume it under ‘Communication’.                                         societal needs and wants shown on the previous             page 37). The high contribution of Products that Flow
                                                                                                                    page. From left to right, the figure shows the domestic    consists of sludges that come from industrial and
                                                                                                                    extraction of resources (Take) which amounts to 199.1      municipal activities.
     HOUSING                                                       S E RV I C E S                                   million tonnes, through the mining of minerals or
     The biggest category in terms of resource                                                                      the production of crops in agriculture or forestry to      Of the total 16.2 million tonnes of waste being
                                                                   The delivery of services to society ranges
     use is Housing. The construction                                                                               produce timber for construction, for example. These        treated, 10.4 million tonnes (64.2%), are either
                                                                   from education and public services, to
     and maintenance of houses and                                                                                  extraction processes result in raw materials like wood     materially or energetically recovered or directly
                                                                   commercial services like banking and
     infrastructure accounts for 88 million                                                                         or sand. However, in a national context, domestic          reused, whereas the other 5.8 million tonnes are
                                                                   insurance. The related material footprint is
     tonnes (34%) of the province’s material                                                                        extraction represents only one of the inputs into the      lost indefinitely. Of the latter, 5.3 million tonnes
                                                                   the third largest, 43 million tonnes (16%)
     footprint.                                                                                                     economy, that include also direct imported products,       end up landfilled while the other 0.5 million tonnes
                                                                   in total, and typically involves the use of
                                                                                                                    66.3 million tonnes (not shown in the figure) as well as   is either incinerated or treated in unspecified ways.
                                                                   professional equipment, office furniture,
                                                                                                                    imports of secondary materials, 3.3 million tonnes.        Remarkably, about 65% of the eliminated waste27 is
                                                                   computers and other infrastructure.
     NUTRITION                                                                                                                                                                 made of wet organic waste. Next to this, aside from
                                                                                                                    When considering not just the direct imports, but also     materials going to waste, 52.1 million tonnes are
     Agricultural products such as crops and
                                                                                                                    the Raw Material Equivalents (RMEs), as previously         added to reserves and stock (Net Stock Additions)
     livestock require 42.5 million tonnes                         H E A LT H C A R E                               introduced on page 18, we see that Quebec’s RME            in the form of capital investments such as buildings
     (16%) per year. Food products have
                                                                                                                    of imports amount to 203.3 million tonnes (this            and infrastructure, machinery and equipment.
     short life cycles in our economy, being                       With an expanding, aging and, on average,
                                                                                                                    would be 206.6 million tonnes if imported secondary        Another 19.9 million tonnes are released into the
     consumed quickly after production.                            more prosperous population, healthcare
                                                                                                                    materials were accounted for): 41.2 million tonnes from    environment as elemental carbon mostly of fossil
                                                                   services are increasing globally. Buildings
                                                                                                                    Canada and 162.1 million tonnes from the rest of the       origin (this corresponds to 90.7 million tonnes of
                                                                   aside, typical resource groups include use
                                                                                                                    world, coming to a total raw material input of 402.4       CO2e). The remaining 1.2 million tonnes are dispersed
     MOBILIT Y                                                     of capital equipment such as X-ray machines,
                                                                                                                    million tonnes. The raw materials typically undergo        into the environment as a deliberate, or unavoidable
                                                                   pharmaceuticals, hospital outfittings (beds),
     A considerable resource footprint is                                                                           processing (Process), for example in the production        consequence of product use. This includes fertilisers
                                                                   disposables and homecare equipment.
     taken up by the need for mobility; 36.6                                                                        of metals from ores, cement from limestone, or             and manure spread on fields, or salt, sand and other
                                                                   This accounts for 7.7 million tonnes (3%)
     million tonnes (14%). In particular, two                                                                       refined sugar from beets. Subsequently, these              thawing materials spread on roads and the erosion
                                                                   in Quebec.
     resource types are used: the materials                                                                         refined materials can be used for the manufacturing        of metals. Finally, an estimated 110.3 million tonnes
     used to build transport technologies and                                                                       (Produce) and assembly of products like busses             are made of all resources extracted in other countries
     vehicles like cars, trains and airplanes;                                                                      from metals, plastics and glass, or the construction       for the production of Quebec’s imports, which end
     plus, predominantly, the fossil fuels used                    C O M M U N I C AT I O N                         of roads and houses. These finished products can, in       up either embodied in stocks wasted, emitted or
     to power them.                                                                                                 turn, be distributed and delivered to provide services     dispersed in the production process abroad.
                                                                   Communication is becoming an evermore            (Provide) and access to products that can satisfy
                                                                   important aspect of today’s society, provided    societal needs and wants locally or be exported. In
     M A N U FAC T U R E D G O O D S                               by a mix of equipment and technology             2017, Quebec exported some 64.3 million tonnes of
                                                                   ranging from personal mobile devices to          final products with an associated RME of 141.2 million
     Consumables are a diverse and complex                         data centres. Increased connectivity is also     tonnes. According to our estimates, a total of 4.2
     group of products—such as refrigerators,                      an enabler of the circular economy, where        million tonnes of secondary materials were exported
     clothing, cleaning agents, personal-care                      digitisation can make physical products          in the same year, which leads to a total volume of
     products and paints—that generally have                       obsolete, or enable far better use of existing   approximately 271 million tonnes of materials
     short to medium lifetimes in society.                         assets, including consumables, building          consumed by Quebecers, of which 9.4 million tonnes
     Textiles including clothing also consume                      stock or infrastructure. Resource use in this    were either secondary materials (amounting to 7.3
     many different kinds of resources such as                     group is less intense, standing at 9.4 million   million tonnes), or reused, downcycled waste.
     cotton, synthetic materials like polyester,                   tonnes (4%).
     dye pigments, and chemicals. They
                                                                                                                    Essential to identifying and addressing opportunities
     account for 34.7 million tonnes (13%)
                                                                                                                    for a more circular economy is what happens to
     worth of resources.

22                                                                                                                                                                                Th e Ci r c ul a r i t y G a p R e p o r t | Q u e b e c 2 02 1   23
X-R AY OF QUEBEC ’ S                                                                                                                                 Process                                                    Produce                                     Provide                                 Outputs

ECONOMY
                                                                                                                                                                                                                                                                                                       S O C I E TA L
                                                                                                                                                                                                                                                                                                         NEEDS
                                                                                                              Take                                                                                                                                                                                       271 Mt
                GLOBAL IMPORTS
                164.9 Mt

                                                                                                                                                                                                                                                                         RAW MATERIAL CONSUMPTION
                                                                                                                                                                                                                                                                                                                                 Outputs from
                                                                                                                                                                                                                                                                                                                                 extraction abroad
                                            38.9 Mt
                                                                                                                                                                                                                                                                                                                                 110.3 Mt
                                            42.7 Mt

                                            25.9 Mt
                                            54.8 Mt
                                                                                                                                                                                                                                                                                                                                Emitted 21.2 Mt
                                            Cycled                                                                                                     Food                                                                                                                                                                     Dissipated 2.2 Mt
                                            Materials                                                                                                industry                                                                                               Services                                                            Net Added
                                            2.65 Mt                                                                                                                                                                                                         industry                                                            to Stock
                                                                                                                                                                                                                                                                                                                                52.1 Mt
                                                                                                                                                                                                                                                                                                                                Lost 5.8 Mt

                IMPORTS FROM CANADA                                                                                                                                                                                          Manufacturing                                                                              Wa s t e d 1 6 . 2 M t

                41.85 Mt                                                                                                                                                                                                     industry
                                                                                                                                                                                                                                                                                                                                  M i n i n g Wa s t e
                                                13.5 Mt                                                                                                                                                                                                                                                                           71.3 Mt

                                                7. 1 M t
                                                                                                                                                                                                                                                          Construction                                                                     Cycled
                                                4.1 Mt                                                                                                                                                                                                                                                                                    10.4 Mt
                                                                                                                                                                                                                                                            industry
                                                16.5 Mt
                                                                                                                                                                                                                                                                              Provincial economy of Quebec
                                                Cycled
                                                Materials
                                                0.65 Mt
                                                                                                    Agriculture and                                                                                                                                                                                   EXPORTS TO CANADA
                                                                                                        forestry                                                                                                                                                                                      24.2 Mt
                                                                                                                                                  Processing
                                                                                                                                                   industry                                                                                                                                                4.7 Mt
                EXTRACTED RESOURCES
                                                                                                                                                                                                                                                                                                           0.03 Mt
                199.1 Mt
                                                                                                                                                                                                                                                                                                           10.9 Mt
                                                                                                       Mining and                                                                                                                                                                                          7. 9 M t
                                                                                                       quarrying                                                                                                                                                                                           Cycled
                                                            EXTRACTED & CYCLED

      29.1 Mt                                                                                                                                                                                                                                                                                              Materials
                                                                                                                                                                                                                                                                                                           0.7 Mt
                                                                RESOURCES

       0.3 Mt

                                                                                                                                                                                                                                                                                                      GLOBAL EXPORTS
      99.4 Mt
                                                                                                                                                                                                                                                                                                      121 Mt
      70.3 Mt
                                                                                                                                                                                                                                                                                                           11.3 Mt

                                                                                                                                                                                                                                                                                                           0.07 Mt
     Cycled                                                                                                                                                                                                                                                                                                88.9 Mt
     10.4 Mt
                                                                                                                                                                                                                                                                                                           1 7. 3 M t

                                                                                                                                                                                                                                                                                                           Cycled
                                                                                                                                                                                                                                                                                                           Materials
                SO CI E TA L NE E DS

                                                                                                                                                                                                                                                                                                           3.5 Mt
                                                                                                                                                                 RE SO U RCE S

                                                                                                                                                                                                                                        CYCLED
                                                                                                                                                                                 199.1 Mt

                                                                                                                                                                                            MINERALS   ORES   FOSSIL FUELS   BIOMASS   M AT E R I A L S
                                                      HOUSING           C O M M U N I C AT I O N   MOBILITY   HEALTHCARE   SERVICES   MANUFACTURED   NUTRITION
                                       271 Mt

                                                                                                                                         GOODS
                                                      88.1 Mt                    9.4 Mt            36.6 Mt      7. 7 M t    43 Mt       34.7 Mt       42.5 Mt

24                                                                                                                                                                                                                                                                            Th e Ci r c ul a r i t y G a p R e p o r t | Q u e b e c 2 02 1            25
H I G H C O N S U M P T I O N AC R O S S N E E D S          continues to grow: for Quebec’s Circularity Metric to      THRIVING BIOMASS: FORESTS
A N D WA N T S                                              meet the global figure of 8.6%, its material footprint     A N D FA R M L A N D
                                                            would have to shrink by 60%, assuming levels of
Quebec’s Circularity Metric is well below the global                                                                   While Quebec’s overall volumes of waste and cycling
                                                            cycling and thus secondary materials input remain
average of 8.6% at 3.5%—this is largely due to the                                                                     are quite low, especially in comparison to the
                                                            constant. In another hypothetical scenario where
relatively high levels of consumption of the residents.                                                                Netherlands, biomass features heavily in the waste
                                                            material recovery increases to a more reasonable
Annually, 271.1 million tonnes of virgin and secondary                                                                 breakdown. Quebec is famed for being a ‘land of
                                                            85%, a material footprint reduction of almost one-half
materials are consumed, which amounts to 32 tonnes                                                                     forests’, with more than half its total area home to
                                                            would still be needed to bring Quebec’s circularity in
per capita. Quebec’s per capita material footprint,                                                                    one of the largest woodland areas in the world.40 The
                                                            line with the global rate.
based on consumption, also ranks sixth for the                                                                         pulp and paper, forest products and agriculture and
countries analysed28 —one place before the rest of                                                                     food industries are all key players in the province’s
Canada, partly owing to its urbanised nature.               M I N I N G F O R R AW M AT E R I A L S                    economy—resulting in an unusual waste composition
                                                            Along with Ontario, Quebec sits at the forefront of        dominated by biomass (51%). While some biomass
Quebec’s high material footprint is linked to its           Canada’s mining industry as the province with the          waste is recycled—just over 1 million tonnes from
position as a dominant trader to the US and the rest        most diversified extraction—and ranks sixth globally       industry and slightly under half a million tonnes
of Canada, exporting billions of Canadian dollars           for investment attraction in the sector. 32 Not only       from municipal sources—the lion’s share is landfilled
worth of aluminium, aluminium alloys, iron ores and         does the province boast a wealth of metals—gold,           (approximately 3.5 million tonnes from all sources).
concentrates and renewable electricity. 8% of the           iron, nickel, titanium, niobium, copper and zinc—it
province’s output relates to interprovincial trade—         is a world-leading 33 producer of the rarer minerals       Our analysis also finds that a significant portion—close
four times the rest of Canada, making Quebec a net          niobium, titanium dioxide, cobalt and platinum. While      to 1.5 million tonnes—is used for energy production;
exporter within the country. Imports—primarily              one-fifth of Canada’s raw material extraction occurs       and indeed, the provincial government has poured
aviation equipment, electricity, petroleum, and natural     in Quebec, for some metal categories it accounts for       millions of Canadian dollars into furthering this,
gas 29 —also flow into Quebec’s economy, mainly from        more than half the country’s total extraction in both      funding a forestry-waste-to-biofuel plant in late 2020.41
the US with a significant portion sourced from China.       weight and value. 34                                       While energy recovery can be a useful application for
In the last five years, oil supplies in the US and Canada                                                              forest or food waste, it is regarded as downcycling and
have increased—accounting for a nearly even split           The high rate of extraction results in Quebec, with        ranks only above disposal on the waste hierarchy;42 as
in Quebec’s imports. 30 The province’s large import         a population of approximately 8.5 million, having a        such, some theorists don’t believe waste-to-energy can
footprint is a key determinant of the province’s high       rate of resource extraction that tops 24 tonnes per        play a role within the context of a circular economy.43
consumption impact and thus of a low Circularity            capita—coming sixth place globally. 35 For metal ores,     There are higher value applications for these materials,
Metric. Large volumes of resources (about 110.3             the province shoots to second place, only trailing         such as in construction materials that can store
million tonnes) are extracted abroad to satisfy             behind Australia with an extraction rate of 12 tonnes      carbon.
Quebec citizens demands: part of these resources            per capita. Extraction rates seem unlikely to slow
become embodied in stocks and part of them are              down: the provincial government’s Strategic Vision for     Significant opportunities emerge to bolster Quebec’s
released as waste and emissions in the producing            Mining Development in Québec 2016–2021, for example,       circularity through the diversion of wet organic waste,
country. The challenge for industrialised and high-         aimed to mobilise stakeholders wishing to advance          including organic sludges from landfilling—which
income countries and provinces, like Quebec, is to          the interests of the industry, and encourages further      represents over one-third of the province’s total waste
lower this as much as possible, while steering the          exploration and development. 36 The Québec Plan for        disposal—and energy recovery, almost entirely from
sustainable management of waste abroad resulting            the Development of Critical and Strategic Minerals 2020-   biomass, which represents 9%. Read more on our
from the demand of their citizens. They can do this         2025 sets the goal of Quebec becoming a leader in the      suggestions in Chapter Four.
by, for instance, favouring imports of secondary            production—and recycling—of critical and strategic
over primary materials. This is characteristic of most      minerals, framing such a development as a major
Shift countries (see page 21), where the low Metric is      contributor to a green economy. 37 38
also the result of raw material consumption topping
domestic material consumption: in other words,              Quebec comes second to another Canadian province—
Quebec is a net importer of resources and thus an           Ontario—for both imports and exports; mineral
exporter of impacts. 31                                     trade has grown consistently in recent years, with
                                                            Quebec accounting for 15.7% of the country’s total
Our analysis indicates that an increase in Quebec’s         imports and 23.3% of the exports, based on value. 39 Its
already-high rate of recovery from 64% to a utopian         substantial contribution to the mineral trade industry
100% would only boost its circularity to 6%—still below     both domestically and abroad serves the economy’s
the global average. Increased cycling contributes little    linear take-make-waste model of consumption, as its
if consumption (reflected in the material footprint)        abundance of metal ores and minerals are funneled
                                                            into meeting key societal needs.

26                                                                                                                                                                                 Th e Ci r c ul a r i t y G a p R e p o r t | Q u e b e c 2 02 1   27
You can also read