City of Gallup, New Mexico MARKET STUDY2020 - Gallup MainStreet Arts & Cultural District
←
→
Page content transcription
If your browser does not render page correctly, please read the page content below
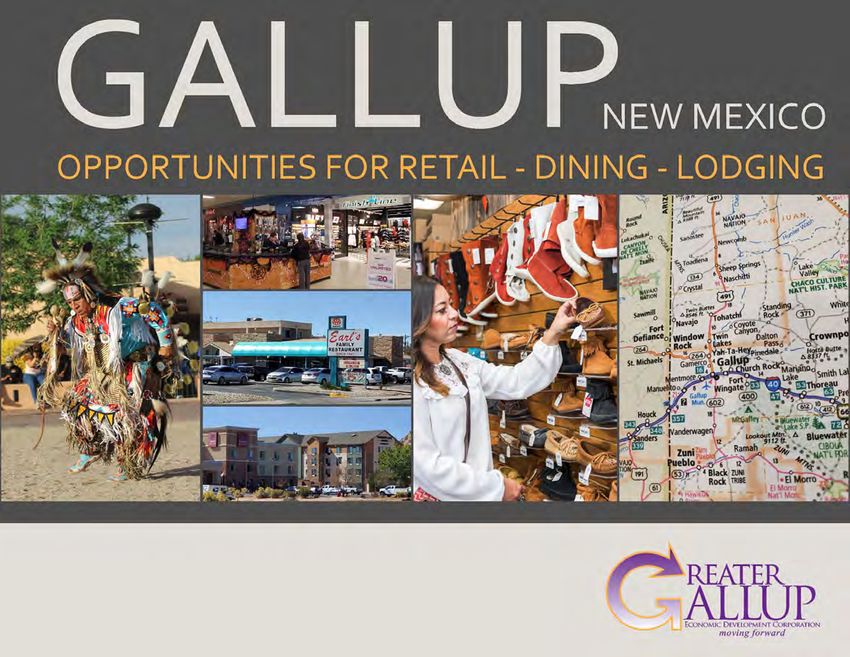
City of Gallup, New Mexico

MARKET STUDY                 2020
CONTENTS
Contents .................................................................................................................................................................................................................................. iii
Introduction.............................................................................................................................................................................................................................. 1
   Approach to the analysis ........................................................................................................................................................................................................ 1
   Significant findings ................................................................................................................................................................................................................ 2
   Attraction targets ................................................................................................................................................................................................................... 2
Market area characteristics ......................................................................................................................................................................................................... 4
   Defining a trade area ............................................................................................................................................................................................................. 4
   Demographics ....................................................................................................................................................................................................................... 5
Impact of the informal economy ............................................................................................................................................................................................6
     Adjusting disposable income ..................................................................................................................................................................................................6
     Gallup’s commercial districts ..................................................................................................................................................................................................7
Visitor market ......................................................................................................................................................................................................................... 10
     Visits to Gallup .................................................................................................................................................................................................................... 11
     Visitor market potential ....................................................................................................................................................................................................... 13
Retail market analysis .............................................................................................................................................................................................................. 15
     Retail market performance .................................................................................................................................................................................................. 15
     Targeted retail chains ........................................................................................................................................................................................................... 21
Dining market analysis ............................................................................................................................................................................................................. 22
     Dining market conditions .................................................................................................................................................................................................... 22
     Targeted restaurant chains.................................................................................................................................................................................................... 23
Lodging market analysis ........................................................................................................................................................................................................... 25
     Existing room inventory ...................................................................................................................................................................................................... 26
     Lodging market trends ......................................................................................................................................................................................................... 28
     Market forecast .................................................................................................................................................................................................................... 30
     Potential for a new hotel ..................................................................................................................................................................................................... 31
Recommendations .................................................................................................................................................................................................................. 33
     Visitor market development ................................................................................................................................................................................................. 33
     Independent businesses ........................................................................................................................................................................................................ 33
     Districts, sites, and buildings................................................................................................................................................................................................. 33
     Stakeholder discussion ......................................................................................................................................................................................................... 34
     Recommendations .............................................................................................................................................................................................................. 36
Appendix A: Economic Roundtable ........................................................................................................................................................................................ 38
     Proceedings ......................................................................................................................................................................................................................... 40
     Background and purpose ..................................................................................................................................................................................................... 41
     Themes from the roundtable discussions .............................................................................................................................................................................. 43

iv
Cross-cutting themes ........................................................................................................................................................................................................... 43
   Roundtable feedback........................................................................................................................................................................................................... 47
   Next steps & recommendations ........................................................................................................................................................................................... 48
   Consultant Recommendations............................................................................................................................................................................................. 50
Appendix B: Targeted Business Information ............................................................................................................................................................................ 52
Appendix C: Responding to the COVID-19 Crisis ................................................................................................................................................................. 60
   Understanding the impacts .................................................................................................................................................................................................. 60
   Recovery priorities for the commercial sector ...................................................................................................................................................................... 60
   Recommended strategies ..................................................................................................................................................................................................... 61
   Available funding programs for small businesses.................................................................................................................................................................... 63
Appendix D: Marketing Sheets................................................................................................................................................................................................ 65
INTRODUCTION
Gallup is an often-overlooked location for expand-          This study was completed in 2020 to evaluate the          selection. In the era of Big Data, retail companies
ing retail and dining chains. Using typical assump-         potential for commercial and lodging development          have a great deal of internal and external data to use
tions and data, it appears that the city has a relatively   in the City of Gallup, to identify specific targets for   in considering store locations. While local govern-
small market, and one that is predominantly low in-         recruitment or business development, and to de-           ments, commercial brokers, property owners, and
come. What is usually missed is the size of the city’s      velop marketing resources that used to conduct a          consultants may have access to external sources,
trade area, the city’s strong visitor traffic, and the      retail attraction campaign.                               they do not have the much richer in-store and
peculiarities of income and spending within the                                                                       online sales data, loyalty program data, and in-store
large Native American communities making up a               Approach to the analysis                                  tracking data available to the chains.
majority of trade area population. All of these help
                                                            The methods used in this analysis were guided by          Organizations without access to retail chain data are
to paint a much more attractive market oppor-
                                                            an understanding of the current practice of retail site   at a disadvantage when performing market analyses.
tunity.
                                                                                                                      While the analysis may identify the right businesses
                                                                                                                                                                        1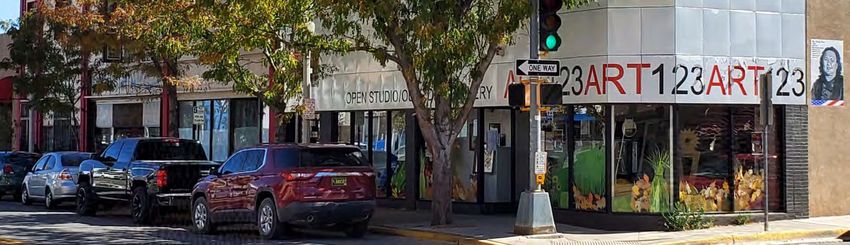
to target, how can it provide value in marketing the substantial. This is especially true for eating and Torrid
site, when the chains have better data to assess the drinking, where the visitor market potential ex-
Zapaterias Pedrito
opportunity? The answer lies in providing external ceeds that of trade area residents.
information that is not available, or obvious to the Cavender’s
Aside from developing a program for retail, dining,
chains. PetSense
and lodging business attraction, the City and the
In the case of Gallup, the demographic databases Gallup EDC can take other measures to develop a Petco
used to screen opportunities omit significant infor- more vibrant commercial sector, including devel-
mation, casting the city in an unfavorable light as a oping and packaging sites and buildings, encourag- Savers
location. These databases underestimate the true in- ing business formation, and capitalizing on Historic Salvation Army Thrift Store
come available within the market, and do not con- Route 66.
sider the sizable contributions of visitor spending. Burlington
By adding in the income produced in the under- Attraction targets TJ Maxx
ground economy, additional disposable income re-
The following businesses were identified as priority Marshall’s
sulting from health care and housing services pro-
vided at no cost to tribal members, and visitor targets for a retail attraction campaign.
Ross Stores
spending, the City of Gallup can be seen as a far Advance Auto Parts
Target
more attractive target for new store development.
Big O Tires
C-A-L Ranch Supply
Significant findings Discount Tire
Big R
Gallup has significant opportunities to attract new American Home Furniture and Mattress
Costco
retail, dining, and lodging establishments through a Carpet One Floor and Home
combination of chain business attraction and Sam’s Club
startups. Chain businesses play an important role in Flooring America
Aldi should be viewed as a long-term prospect as
retaining trade area customers who might otherwise Floor Trader of Farmington the chain develops a presence in the western states.
leave the city to shop in communities where these
Kiva Carpet and Tile Restaurant chains that may be considered for attrac-
businesses are located. When they stay to shop lo-
tion include the following.
cally, they will also tend to spend more with local Lloyd’s Carpet and Draperies
independent retail businesses and restaurants. Cattle Baron
Lowe’s
The city’s trade area is very large, extending more Chipotle
Bashas’
than an hour from the city center, or further. This
Culver’s
takes in much of the Navajo and other reservation El Super
lands, and Native Americans make up about four of Dunkin
Aldi*
five trade area residents. Great Harvest Bread Company
Christopher and Banks
Over six million visitors pass through the city every IHOP
year, but fewer than half of them stop, even just for Buckle
a short time. The potential of this market is Old Chicago
2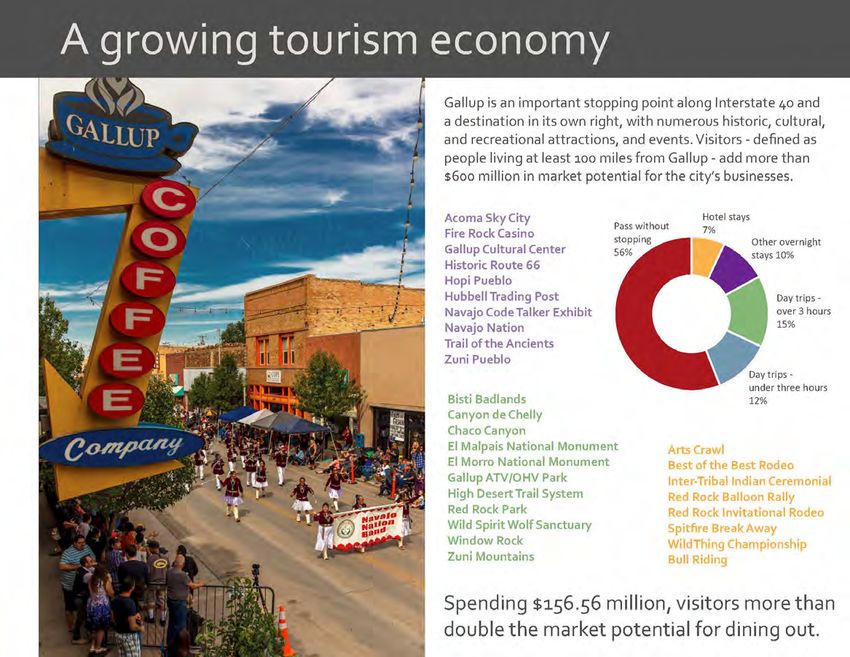
Panera number of new rooms that have been added in re- Country Inn & Suites (Radisson)
cent years. This will likely take two to four years.
Perkins Courtyard by Marriott
The need for new rooms will be at the upper mid-
Qdoba scale or higher tier, and could include remodeling Drury Inns & Suites
Ruby Tuesday of one or more motor courts as a Route 66-themed Lastly, there are numerous opportunities for exist-
historic inn. Lodging chains not presently found in ing businesses to capture greater market share, and
Taco John’s Gallup include: for startup businesses in both the retail and dining
Village Inn Cambria (Choice Hotels) segments.
Whiskey Creek Candlewood Suites (IHG)
The opportunity for additional lodging develop- Clarion (Choice Hotels)
ment will open as demand grows to occupy the
Cobblestone Inns & Suites
3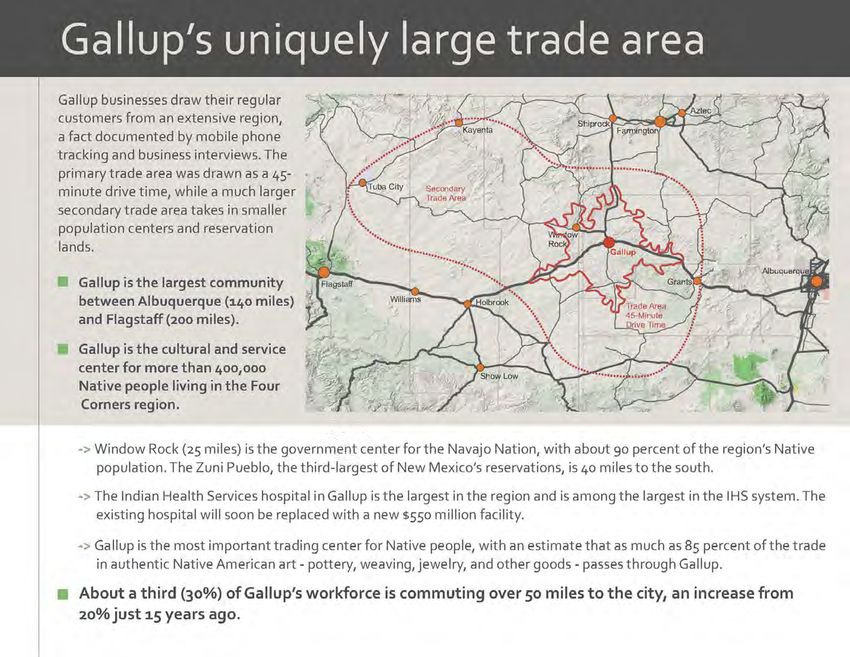
MARKET AREA CHARACTERISTICS
Gallup has several qualities that make it stand out signal a greater potential for the city to attract retail
from other places, and may call for added measures and dining businesses. Defining a trade area
when performing a market analysis. These include: Gallup is the largest community between Flagstaff,
The reasoning and methodology for incorporating
An unusually large trade area these issues into the market analysis will be ex- three hours to the west, and Albuquerque, two
plained in this chapter, which will define the trade hours to the east. There are no significant popula-
A sizable underground economy tion centers to the south, while Farmington lies
area and demographics of the city’s market. Key sta-
Differing household expenditures tistics from this analysis will be contrasted against about two hours to the north.
A very strong visitor market data from ESRI Business Analyst to demonstrate Distance and competition are only two factors that
how adding visitor spending and adjusting income need to be considered in defining the city’s trade
The effect is to generate far more market potential figures results in more accurate estimates of market area. The surrounding reservations, and Native
than what is shown in a less careful analysis, and to potential. American culture need to be taken into
4consideration. The largest of these is the Navajo represents the area in which residents will consider Demographics
Nation, with its government center located a half Gallup their primary destination for the majority of
hour north of Gallup in Window Rock. While the their shopping, service, and dining needs. Gallup is the major population center in a very large
need to interact with the government already brings region, with a total population estimated at 22,063
A secondary trade area was drawn extending further
356,890 Navajo close to Gallup, the city’s substan- persons. Race is the most significant factor in de-
in all directions, but especially to the south and to
tial, historic pattern of trade and cultural ties rein- scribing this population, with a nearly even split be-
the northwest, to represent an area from which
forces connections between Gallup and not only tween white (41.3 percent) and American Indian
Gallup businesses will often draw customers, alt-
the Navajo, but most other tribes within the region. (41.8 percent). Persons of two or more races,
hough the city may not be their primary location
mainly white and American Indian, make up the
The approach taken here draws two trade areas. for meeting shopping and dining needs. This sec-
largest number of the remainder. A significant
The first is drawn to include an area covered within ondary trade area takes in all, or portions of the
number of residents (34.7 percent) claim Hispanic
a 45-minute drive from the corner of 2nd Street and Navajo and Hopi Reservations, Zuni Pueblo, and
descent. Outside of the city, the population is over-
Historic Route 66 in downtown Gallup. This Acoma Pueblo.
whelmingly Native American, and much of the
city’s trade area is comprised of reservation lands.
Gallup’s Primary and Secondary Trade Areas The population of Gallup and the trade area is pro-
jected to decrease slowly over the coming decade,
with the trade area losing less than 500 residents by
2024, or 0.73 percent of the total.
Demographic Summary
TRADE
GALLUP AREA
Population 22,063 65,269
Median age 29.5 32.0
White 41.3% 15.7%
American Indian 41.8% 76.2%
Median income* $43,598 $31,515
Per capita income $19,633 $14,914
Households 6,891 17,726
Avg. household size 3.14 3.65
Owner occupied 60.0% 73.9%
Renter occupied 40.0% 26.1%
* This figure has not been adjusted to consider the under-
ground economy
5The income profile of the region is lower than av- earning $19,000 annually. This study used households in the primary trade area – 4,052 in total
erage, although Gallup fares better due to the wider a conservative figure of 20 percent partici- – earn additional, unreported income through par-
availability of jobs. The Census paints an incom- pation in the underground economy. ticipation in the underground economy. On aver-
plete picture, though, in that there is a large under- age, they are making $18,000 annually, adding an
While not specific to the Navajo or other area
ground economy. aggregate $72,939,000 in household income.
tribes, two other studies can help provide insight
into the size of the underground economy.
Impact of the informal economy Adjusting disposable income
In 2019 the Heard Museum surveyed its
There is widespread recognition that there is a sub- vendors to determine that the average ven- Aside from the impact of an underground econ-
stantial underground economy on the Navajo res- dor earned $16,572 through participation omy, there are nuances of Native American house-
ervation and other reservations in New Mexico and in its annual vendor program and art fair. hold income that are missed in many market anal-
the broader Four Corners region. The trade in arts yses. While a typical household has substantial costs
and crafts is a substantial part of this underground A study on the Pine Ridge Reservation associated with health care (8.1 percent of house-
economy, as are food stands, small farms, flea mar- found that as many as 30 percent of tribal hold spending), enrolled members of federally-rec-
ket booths, and other ventures. While there have adults met criteria as practicing or potential ognized tribes receive many health services at no
been several attempts to estimate the scale of the artists. Slightly over half (51 percent) of cost. Indian Health Services estimates that 60 per-
underground economy, data limitations have led to households had a home based business, cent of health care costs are covered by the service,
only broad estimates. Some of the available analysis with 79 percent of them involving the arts. substantially reducing the costs paid by households,
includes: Most (61 percent) earned less than $10,000 who can then dedicate the funds to other spending.
annually.
Several versions of the Navajo Nation A similar condition exists with regard to some
Comprehensive Economic Development The University of New Mexico prepared a housing, as the Native American Housing Assis-
Strategy (CEDS) that estimate the total un- report on the state’s creative economy in tance and Self Determination Act sets guidelines,
derground economy at 22.2 to 24.4 per- 2014, reporting the average income of self- implemented through tribal housing authorities,
cent of the overall economy. employed artists in the state at $17,299, and that limit housing costs to no more than 30 percent
estimating 30 to 40 percent of Native of household income. In the western region of the
A 2004 Study by the Navajo Division of American households engaged in produc- United States, housing averages 33.5 percent of
Economic Development that estimated at ing and selling pottery, jewelry, weavings, household income.
least 60 percent of households engaging in or other works of art.
arts and crafts trade. This analysis uses an estimate of 60 percent of health
This is important for the market analysis in that care costs and rent are covered through services
The 2011 Navajo Nation Visitor Survey, work done in the informal economy is generally provided through the tribal governments. In 2018,
conducted by the Arizona Hospitality Re- not reported. It will not be reflected in the numbers the average rent paid was $4,247 and the average
search & Resource Center, which esti- reported by federal agencies, and will not make its cost of health care was $4,968. This includes insur-
mated a $20.4 million arts economy on the way into estimates provided by vendors like ESRI ance costs as well as the cost of services and pur-
Navajo Nation. or Environics. chases. There were 13,507 Native American house-
A 2018 Diné Policy Institute study of flea A conservative approach is taken in this analysis. It holds in the primary trade area, with an average of
markets, finding the average vendor is estimated that 30 percent of the Native American $5,529 in savings, or $74,680,000 in total.
6There are several undeveloped lots remaining Anchor uses within this corridor include the his-
Gallup’s commercial districts within the first three-quarters of a mile west of the toric El Rancho Hotel, Albertson’s and Lowe’s,
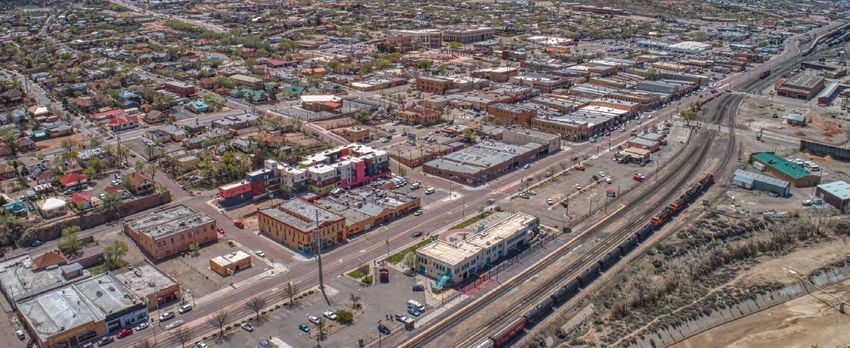
There are four primary commercial areas in Gallup, interchange, as well as along Church Rock Street, Butler Office Supply, and Walgreen’s.
including the eastern and western segments of His- which runs parallel to the interstate. A theater was
Downtown Gallup
toric Route 66, the downtown, and Highway 491 built on Church Rock Street about a decade ago,
on the north side. There is an additional small dis- but no other uses have since located in the area. Downtown Gallup serves as a specialty retail dis-
trict located along 2nd Street on the city’s south side. Competition from the Highway 491 area and a trict, visitor destination, and center of government.
This area is serving what is described as a neighbor- large number of vacancies along East Route 66 The district is generally considered to lie between
hood level of commercial activity. contribute to the lack of new development. McKinley Drive and Highway 62, from the river
south to Mesa Street.
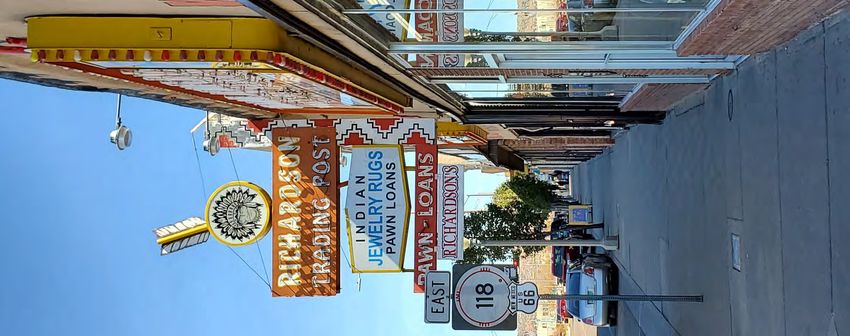
East Route 66 Many of the buildings along East Route 66 were
built between the 1940’s and 1980’s, and would not The core pedestrian-oriented portion of the district
This segment of Historic Route 66 stretches 3.8 meet modern expectations for design and landscap- stretches for several blocks along Historic Route
miles from the eastern Interstate 40 interchange to ing. There are vestiges of the heyday of Route 66, 66, and up to four blocks south (Mesa Street). Es-
the downtown. The railroad lies immediately north but these are not leveraged to define the corridor pecially along Route 66 and Coal Avenue, it has a
of the road, except for a portion near Ford Drive. and attract visitors. There has been almost no plan- traditional development pattern of two-story brick
Commercial uses line most of the south side of the ning or investment in streetscaping that would de- buildings, some with historic character. There are
street, serving both a resident and a visitor market. fine the district. few vacancies, and at the edges of the district,
Most of the newer hotels have been constructed in homes have been converted to office and retail uses.
Along with some vacant buildings, there are several
this corridor, including a cluster just east of the in- commercial lots that are minimally developed, and A large number of businesses selling Native Amer-
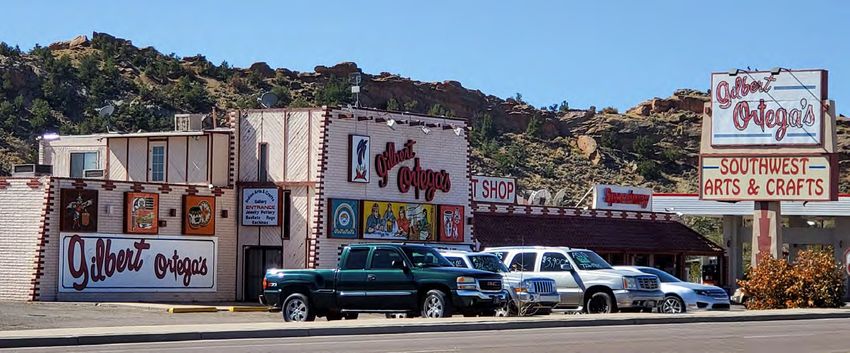
terchange. Other visitor-serving uses include a large might offer opportunities for redevelopment. ican goods (frequently pawn) are located along
number of restaurants, gas stations, and a handful of Route 66, and others on Coal Avenue. Galleries,
stores selling Indian goods. craft supply, and other related businesses are also
7found in the district. These uses are complemented immediately to the north for the first 3.1 miles, only As with the eastern highway segment, there are a
by the cultural center, visitor center, plaza, and Rex allowing commercial development on both sides of large number of vacancies. Multiple sites are avail-
Museum. Business hours are inconsistent, and sev- the road nearer to the interchange. The airport lies able for development, particularly between the air-
eral were closed during normal business hours. to the south near the center of the corridor, pre- port and the interchange.
venting much development in that area. As a result,
The broader downtown area offers several potential Highway 491 / north side
the corridor might be considered as two separate
redevelopment opportunities for commercial,
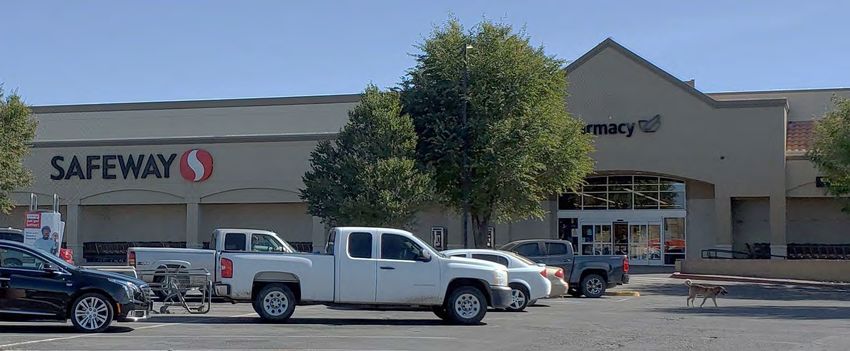
districts. Neither contains the concentration of res- The city’s most significant commercial area extends
mixed use, and multifamily residential projects.
ident-serving or visitor- oriented uses found in the north along Highway 491 and east along Maloney
This includes city-owned property between the
eastern segment of the highway. Avenue, parallel to the interstate. The Rio West
railroad and the river, several large sites on the west
Mall (with Beall’s, JCPenney, and Hobby Lobby),
end of downtown, and smaller infill or renovation Reflecting its lower status as a commercial corridor,
Walmart Supercenter, Home Depot, Tractor Sup-
sites on the east side of the district. Commercial uses the majority of the city’s economy hotels are found
ply Company, Big Lots, and Safeway anchor the
will tend to prefer the sites closer to Highway 66. along this stretch of highway. There are fewer res-
district. There are a large number of hotels, restau-
taurants, and Sonic, Taco Bell, and McDonald’s are
West Route 66 rants, and smaller retail businesses.
the only national chains, aside from those located in
From the downtown, West Route 66 stretches 5.2 the truck stops. Family Dollar is the most significant The Highway 491 frontage has been developed
miles to the city’s western interchange with Inter- retail chain in the district. within three-quarters of a mile of the interstate, to
state 40. As with East Route 66, the railroad lies where difficult topographic conditions and distance
PRIMARY COMMERCIAL DISTRICTS IN THE CITY OF GALLUP
8from the city make it less desirable for commercial occupying a significant amount of that space. Beall’s
uses. Development has also occurred along the was closing at the time this analysis was prepared in
Maloney Avenue frontage for three-quarters of a October of 2019, but was expected to reopen as
mile, although there may be the potential for some Gordman’s. The mall is performing better than
infill on the Rio West Mall’s extensive parking lot. many in comparably-sized communities, though it
lacks many of the national chain apparel or other
There are few vacancies aside from the in-line space
retailers usually found in malls.
in the Rio West Mall. These include the former
Payless Shoes and some remaining space in the for-
mer Walmart, where Tractor Supply Company is
now located. Several vacancies exist within the
mall, although Ashley Home Store will be
9VISITOR MARKET
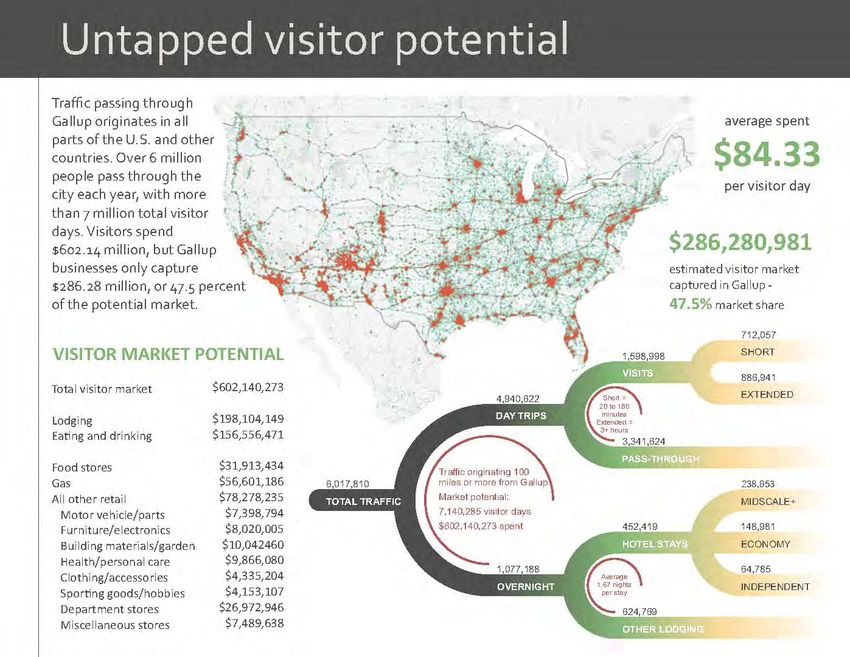
Gallup has a very strong tourism sector, drawing include recreational travelers, business travelers, and the largest community between Albuquerque and
visitors from across the United States and interna- even truck drivers and others who stop in the city Flagstaff, Gallup is well positioned to serve travelers
tionally. These visitors contribute significantly to for fuel, food, or an overnight stay. A lesser number on Interstate 40. As examples, the City may look to
the market potential available to businesses located of visitors actually make the city a destination, often similarly-situated communities such as Kearney,
in the city. In total, they spend over $600 million, for an experience of Historic Route 66, cultural and Nebraska, Mitchell, South Dakota, Hays, Kansas,
and Gallup businesses capture just under half of that other events, as a base for trips to regional attrac- or Rock Springs, Wyoming. These places lever-
total. tions, or to visit with family and friends. aged their highway location as a catalyst for com-
mercial development. Arguably, Gallup has a
For many of the people visiting Gallup, the city is a Over time, tourism will provide one of the best op-
stronger position as it has historic, cultural, and
waypoint en route to another destination. These portunities to grow the retail and dining sector. As
10recreational assets that make the city a destination STATE OF NEW MEXICO MOBILE PHONE DATA SUMMARY
in its own right. ESTIMATED 2018 VISITOR SPENDING
Unique visits in sample 495,129
Visits to Gallup Accommodations $80 million
Located over 100 miles away 375,354
The State of New Mexico provides limited infor- Food and beverage $62 million 75.8%
mation about tourism and visitors at a local level. In Recreation $21 million Day trips 308,077
2018 it estimated the impact of tourism in McKin- 82.1%
ley County at $242 million in total spending, bro- Retail $47 million
ken out into five broad categories. Overnight trips 67,277
Transportation $33 million
17.9%
The state does not provide an estimate of the total
number of visitors to the county. Statewide, there Based in United States 371,016
In addition to gathering data for the city as a whole,
were 37.5 million visitors in 2018, split between 98.8%
nine sub-areas were defined to understand what
20.4 million day trippers (54.4 percent), and 17.1 parts of the city or surrounding area may have been Day trips 304,501
overnight visitors (45.6 percent). Most (88.8 per- a part of a visit. The sub-areas are: 82.1%
cent) traveled by motor vehicle. Included in that
sum are 6.6 percent who traveled by recreational Downtown Gallup Overnight trips 66,515
vehicle (either towed or a motor home). 17.9%
Historic Route 66 East
Based abroad 4,338
Mobile tracking data sample Historic Route 66 West
1.2%
To better define the visitor market, this analysis Highway 491 (except Walmart and mall)
used a sample of mobile phone tracking data for all Day trips 2,814
Walmart 64.9%
of 2018. Mobile phones send a signal to nearby
towers, recording their location and the date and Rio West Mall Overnight trips 1,524
time at which the signal was sent. This data is avail- Fire Rock Navajo Casino 35.1%
able for phones whose users have authorized their
North of the city Day trips over three hours 55,306
device to be tracked.
18.0%
Each phone is assigned an anonymous identification South of the city
number, and there is a separate record for every sig- Day trips over 20 minutes 99,707
More detailed information about these nine areas is 32.4%
nal. The data make it possible to determine the included in an appendix to this report, while city-
phone’s common evening location (home), along wide data is discussed in this chapter.
with duration of stay in the study area. Using this still include anyone who simply drove through,
information, it is possible to infer whether the visit Breakdown of visits by type stopped only for gas or a meal, or spent a night. It
likely included an overnight stay. Defining the number of “visitors” is not easy. Con- does not provide insight into who actually partook
ceptually, a visitor might be thought of as anyone in events or attractions in the city or surrounding
who is not a resident or living nearby. That may area. Still, the available information can help in
11estimating the potential size of the visitor market, overnight stay, leaving 17.9 percent as overnight About a third of visits lasted three hours or longer,
and market penetration for visitor spending. visitors. This varied from 17.9 percent of visitors which would be enough time to suggest the poten-
from elsewhere in the United States, to 35.1 per- tial that the visitor is attending an event or taking
There were 495,129 unique visits recorded in the
cent of international travelers. in one or more attractions.
sample of 2018 mobile phone data. Of these rec-
ords, 375,354 have a home location more than 100 There were 166,780 people, or 44.4 percent of the Estimating total visitation
miles from Gallup, with 371,016 based in the total, whose time within the city totaled 20 minutes
There were an estimated 452,419 overnight stays in
United States, and 4,338 located abroad. These can or longer. This represents the percentage of visitors
Gallup hotel rooms during 2018. According to the
be considered the “visitor market”. It includes who may be using some services in the city.
annual US Consumer Expenditure Survey, 42 per-
those who passed through without stopping, but Twenty minutes might be considered the mini-
cent of trips include a lodging expenditure, suggest-
present an opportunity to capture additional sales if mum length of time needed to stop to top off a gas
ing that to arrive at the estimated number of room
they did stop. tank or pass through a drive-through for a meal, and
stays, there would have been a total of 1,077,188
continue through the city on a trip.
About four out of five people (82.1 percent) in the overnight stays. Most of these would have been
visitor market made trips that did not include an nights spent with family or friends, but would also
include vacation homes, rentals, RV parks, and
campground stays.
Since overnight visits make up 17.9 percent of the
observations in the mobile phone data sample, the
total visitor market could be estimated at 6,017,810.
Using the information contained in the mobile
phone records, it is possible to further break down
visits based on the type and duration of stays.
The largest number of people traveling through
Gallup, from a distance of over 100 miles, do not
stop. These 3.34 million travelers are a missed op-
portunity that can be marketed to, in order to cap-
ture more spending on lodging, dining, gas, and
other retail goods.
The roughly 1.6 million day visitors can be split
into 712,057 short stays between 20 minutes and
three hours in duration, and 886,941 stays over
three hours (and not including an overnight stay).
The shorter stays approximate the number of visi-
tors who may be only using local services and per-
haps making brief visits to tourist-oriented retail
12TRAFFIC-BASED VISITOR ESTIMATE which would help to determine demand for retail NORTHERN ARIZONA
goods or dining. ESTIMATED 2018 VISITOR SPENDING
An alternate set of data can also be used
to estimate the number of Gallup visitors. Some of that information is available for northern Accommodations 32.9%
Traffic counts east and west of the city vary Arizona. The State of Arizona reports 2018 spend-
ing averaging $637 per travel party, made up of Food services 26.0%
from about 19,000 to 23,000, averaging
three persons staying an average of 2.5 nights. This Food stores 5.3%
closer to 22,000. This leads to an annual
come to $84.33 per visitor day.
estimate of a little over 8 million cars. Local transportation/gas 9.4%
Given its adjacency to Gallup, the data for northern
Applying the percentage of visitors origi- Arts/entertainment/rec. 12.7%
Arizona can be applied to Gallup with a degree of
nating from over 100 miles away (75.8 per-
confidence, and will allow an estimation of visitor Retail 13.0%
cent), taken from the mobile phone data,
spending and the market potential available through
there would be an estimated 6.08 million Air transportation 0.6%
tourism.
annual visitors to Gallup. This compares
nicely to the lodging-based estimate. Visitor expenditures $ spent per visitor day $84.33
Only 4.1 percent of visits to Gallup include a stay
stores. Those staying over three hours are more of more than one night. The average overnight stay Gallup’s total visitor market – those passing through
likely to be visiting an attraction or attending an lasts 1.67 days. When applied to the estimated num- the city, whether or not they stop – comes to a total
event in the city. ber of overnight visits to the city, the result is an of 7,140,285 visitor days. The market potential
estimate of 1,795,772 visitor days among overnight generated by these potential visitor days totals
Visitor market potential visitors, and 3,394,770 total annual visitor days. The $602,140,273. The city is currently capturing a
amount of visitor spending captured in Gallup is es- 47.5% share of this market.
The New Mexico Department of Tourism esti- timated at $286,280,981. This aligns relatively
mates a 2018 total of $242 million in travel related closely with the state’s estimate, and the difference
spending within McKinley County. Unfortunately, can be attributed in part to how “visitor” is defined
the state does not provide information offering in each approach.
much additional detail about visitor spending,
13ORIGINS OF 2018 VISITORS TO GALLUP – ALL TRAFFIC THROUGH THE CITY 14
RETAIL MARKET ANALYSIS
Gallup’s retail businesses capture about three-tenths     groups are under-represented and offer an oppor-          businesses are estimated to be capturing $623.93
of the market available to them from the combined         tunity for new business development.                      million in annual sales, leaving a gap of $1.24 billion
primary and secondary trade areas, and visitors.                                                                    being captured elsewhere. Much of this will be sales
While it can’t be expected that the businesses will       Retail market performance                                 lost to Albuquerque, Flagstaff, and Farmington,
capture all of the available potential, especially from                                                             which lie outside of the secondary trade area and
the secondary trade area, there is room for im-           The market available to Gallup’s retail businesses        have a greater concentration of retail businesses
proved performance. That can be achieved through          exceeds $2.03 billion in annual sales potential, split    than does Gallup.
expanding existing businesses, new business starts,       among the primary trade area ($611.85 million),
and retail business attraction. Several industry          secondary trade area ($1.26 billion), and visitor traf-
                                                          fic ($166.79 million). Meanwhile, Gallup’s retail

                                                                                                                                                                     15
OVERALL MARKET PERFORMANCE
TOTAL TOTAL TRADE AREA VISITOR TOTAL
PRIMARY ADDED PRIMARY SECONDARY ADDED PO- SECONDARY MARKET MARKET MARKET ESTIMATED GAP OR MARKET
TRADE AREA POTENTIAL TRADE AREA TRADE AREA TENTIAL TRADE AREA POTENTIAL POTENTIAL POTENTIAL SALES (SURPLUS) SHARE
$464,234,000 $147,619,000 $611,853,000 $759,082,000 $497,270,000 $1,256,352,000 $1,868,204,000 $166,792,855 $2,034,996,855 $623,934,000 $1,244,270,254 30.7%
Not all retail industries are performing equally well, There is local demand for recreational vehicles, Furniture and electronics
depending on the nature of the specific industry, motorcycles, and other motor vehicles such as
Furniture stores are well represented in Gallup, as
Gallup’s retail business mix, and competition in ATVs. A small number of businesses are meeting
these businesses are rarely found in smaller commu-
smaller communities within the trade areas, or part of this demand. The market size is not large
nities. Within Gallup, most stores are focused on
larger urban areas around the periphery. enough to support recreational vehicle sales, how-
the lower end of the market. Included in the anal-
ever, more of the demand for motorcycles and
Motor vehicles and parts ysis are Aaron’s and Rent-A-Center, which are not
ATVs can be met locally, either through expansion
technically classified as retail stores, but as rental
Sales of motor vehicles are as may be expected. of a local business or as a new venture (startup or
businesses.
While most of the major brands are represented in branch establishment).
Gallup, several of the smaller brands (ex., Hyundai, The opening of Ashley HomeStore will help to im-
Parts and accessories sales are strong, but there is an
Kia, Subaru, and luxury brands) are found only in prove the share of the market being captured in
opportunity for growth. The greatest threat to this
the region’s larger cities. Without a presence in the Gallup, both through the sales it records, and by
retail industry is from increasing online sales that cut
market, these are sales that will continue to be lost. encouraging a greater number of people to search
into bricks and mortar expenditures. Chain targets
Also, in the secondary trade area in particular, the local furniture stores before traveling elsewhere to
will include:
presence of a larger number of dealers in Albuquer- shop. That may also include online sites. A large
que and Flagstaff will tend to be more of a draw for Advance Auto Parts number of furniture buyers are meeting their needs
many customers. The potential for an existing Big O Tires elsewhere due to the limited local selection.
dealer to add an additional brand can be explored
Discount Tire American Home Furniture and Mattress is a re-
as a potential strategy for expansion.
gional chain that may be targeted. They have five
MOTOR VEHICLES AND PARTS
TOTAL TOTAL TRADE AREA VISITOR
PRIMARY ADDED PRIMARY SECONDARY ADDED SECONDARY MARKET MARKET TOTAL MARKET ESTIMATED GAP OR MARKET
DESCRIPTION TRADE AREA POTENTIAL TRADE AREA TRADE AREA POTENTIAL TRADE AREA POTENTIAL POTENTIAL POTENTIAL SALES (SURPLUS) SHARE
New car dealers $77,106,000 $24,518,000 $101,624,000 $136,574,000 $82,593,000 $219,167,000 $320,791,000 $0 $320,791,000 $76,000,000 $244,790,758 23.7%
Used car dealers $8,993,000 $2,860,000 $11,853,000 $15,929,000 $9,633,000 $25,562,000 $37,414,000 $0 $37,414,000 $13,150,000 $24,264,396 35.1%
Recreational vehicle dealers $1,723,000 $548,000 $2,271,000 $5,473,000 $1,846,000 $7,319,000 $9,591,000 $1,117,281 $10,708,281 $0 $9,590,566 0.0%
Motorcycle, boat, and other motor vehicle dealers $4,952,000 $1,575,000 $6,527,000 $15,728,000 $5,305,000 $21,033,000 $27,560,000 $3,210,778 $30,770,778 $0 $27,560,103 0.0%
Automotive parts and accessories stores $6,208,000 $1,974,000 $8,182,000 $9,455,000 $6,650,000 $16,105,000 $24,287,000 $1,930,182 $26,217,182 $9,954,000 $14,333,287 38.0%
Tire dealers $3,668,000 $1,166,000 $4,835,000 $5,587,000 $3,929,000 $9,516,000 $14,351,000 $1,140,553 $15,491,553 $4,925,000 $9,426,288 31.8%
16FURNITURE AND
FOOD AND ELECTRONICS
BEVERAGES
TOTAL TOTAL TRADE AREA VISITOR
PRIMARY ADDED PRIMARY SECONDARY ADDED SECONDARY MARKET MARKET TOTAL MARKET ESTIMATED GAP OR MARKET
DESCRIPTION TRADE AREA POTENTIAL TRADE AREA TRADE AREA POTENTIAL TRADE AREA POTENTIAL POTENTIAL POTENTIAL SALES (SURPLUS) SHARE
Furniture stores
Supermarkets and other grocery stores $7,073,000
$66,122,000 $2,249,000
$21,026,000 $9,322,000 $120,649,000
$87,148,000 $9,898,000 $7,577,000
$70,827,000 $17,475,000
$191,476,000 $26,797,000
$278,624,000 $2,020,618
$28,951,288 $28,817,618
$307,575,288 $6,000,000
$72,875,000 $20,796,818
$205,749,145 20.8%
23.7%
Floor covering
Meat markets stores $2,811,000
$766,000 $894,000
$244,000 $3,705,000
$1,010,000 $3,934,000
$3,476,000 $3,011,000
$821,000 $6,945,000
$4,297,000 $10,649,000
$5,307,000 $803,103
$551,437 $11,452,103
$5,858,437 $450,000
$50,000 $10,199,470
$5,256,969 3.9%
0.9%
Other
Fish home
and furnishings
seafood marketsstores $4,172,000
$224,000 $1,327,000
$71,000 $5,499,000
$296,000 $8,248,000
$1,018,000 $4,469,000
$240,000 $12,717,000
$1,258,000 $18,216,000
$1,554,000 $1,683,780
$161,502 $19,899,780
$1,715,502 $0 $18,215,634
$1,554,280 0.0%
Appliance,
Fruit television,
and vegetable and other electronics stores
markets $12,367,000
$420,000 $3,933,000
$133,000 $16,300,000
$553,000 $14,477,000
$1,904,000 $13,247,000
$450,000 $27,724,000
$2,354,000 $44,024,000
$2,907,000 $2,955,394
$302,051 $46,979,394
$3,209,051 $7,100,000
$0 $36,924,197
$2,906,905 15.1%
0.0%
Computer
Other and software
specialty stores
food stores $1,961,000
$766,000 $624,000
$244,000 $2,584,000
$1,010,000 $2,295,000
$3,476,000 $2,100,000
$821,000 $4,395,000
$4,297,000 $6,980,000
$5,307,000 $468,511
$551,408 $7,448,511
$5,858,408 $0
$900,000 $6,979,874
$4,406,691 0.0%
15.4%
Camera
Beer, and and
wine, photographic supplies stores
liquor stores $371,000
$4,211,000 $118,000
$1,339,000 $489,000
$5,549,000 $434,000
$3,373,000 $397,000
$4,510,000 $831,000
$7,883,000 $1,320,000
$13,433,000 $88,599
$1,395,748 $1,408,599
$14,828,748 $0
$1,075,000 $1,319,842
$12,357,533 0.0%
7.2%
BUILDING MATERIALS LAWN ANDCARE
HEALTH AND PERSONAL GARDEN SUPPLIES
TOTAL TOTAL TRADE AREA VISITOR
PRIMARY ADDED PRIMARY SECONDARY ADDED SECONDARY MARKET MARKET TOTAL MARKET ESTIMATED GAP OR MARKET
DESCRIPTION TRADE AREA POTENTIAL TRADE AREA TRADE AREA POTENTIAL TRADE AREA POTENTIAL POTENTIAL POTENTIAL SALES (SURPLUS) SHARE
Home centers
Pharmacies and drug stores $20,140,000
$27,728,000 $6,404,000
$8,817,000 $26,545,000 $41,705,000
$36,545,000 $22,218,000 $21,574,000
$29,701,000 $43,792,000
$71,406,000 $70,336,000
$107,952,000 $4,535,673
$8,513,829 $74,871,673
$116,465,829 $28,500,000
$15,000,000 $41,836,195
$92,951,683 38.1%
12.9%
Paint and wallpaper
Cosmetics, stores and perfume stores
beauty supplies, $1,311,000
$1,398,000 $417,000
$445,000 $1,728,000
$1,843,000 $1,447,000
$2,103,000 $1,405,000
$1,497,000 $2,852,000
$3,600,000 $4,580,000
$5,443,000 $295,396
$429,315 $4,875,396
$5,872,315 $800,000
$1,400,000 $3,780,222
$4,042,963 16.4%
23.8%
Hardware
Optical stores
goods stores $2,900,000
$1,061,000 $922,000
$337,000 $3,822,000
$1,398,000 $3,199,000
$1,595,000 $3,106,000
$1,136,000 $6,305,000
$2,731,000 $10,128,000
$4,129,000 $653,057
$325,610 $10,781,057
$4,454,610 $10,750,000
$2,525,000 ($622,367)
$1,604,057 99.7%
56.7%
building
Other health material
and personaldealers
care stores $17,146,000
$1,946,000 $5,452,000
$619,000 $22,599,000
$2,564,000 $18,915,000
$2,926,000 $18,367,000
$2,084,000 $37,282,000
$5,010,000 $59,880,000
$7,575,000 $3,861,385
$597,326 $63,741,385
$8,172,326 $0
$1,050,000 $59,880,137
$6,524,612 0.0%
12.8%
Outdoor power equipment stores $955,000 $304,000 $1,259,000 $684,000 $1,023,000 $1,707,000 $2,965,000 $139,635 $3,104,635 $150,000 $2,815,420 4.8%
Nursery, garden center, and farm supply stores $3,812,000 $1,212,000 $5,024,000 $2,730,000 $4,083,000 $6,813,000 $11,837,000 $557,313 $12,394,313 $325,000 $11,512,275 2.6%
current locations in Albuquerque along with one in The appliance, television, and electronics industry of businesses, the sole opportunity in this industry
Farmington. is among those most impacted by online sales. may be to target Lowe’s for attraction.
Companies that had been opening stores in small
Floor covering stores are underrepresented in Gal- Food and beverages
markets (ex., Hastings or Radio Shack) have largely
lup. These businesses sell carpet, tile, and wood
closed. Demand in places such as Gallup is being Several individuals expressed interest in additional
flooring, along with related items like draperies and
captured by stores such as Home Depot or grocery stores as part of stakeholder and shopper in-
home décor or upholstering services. The best pro-
Walmart, and quasi-retail businesses like Aaron’s terviews conducted in Gallup as part of the research
spects for attraction may be stores located in Farm-
and Rent-A-Center. This is not seen as a viable tar- for this analysis. Most centered on a desire for more
ington and other communities that already capture
get for recruitment. fresh and specialty items, and often included men-
some of the trade area business, such as:
tions of chains like Sprouts, Whole Foods, or
Carpet One Floor and Home Home improvement
Trader Joe’s. Gallup’s demographic profile is not
Flooring America Home Depot dominates the home improvement one that is well matched to those chains. There re-
industry within Gallup. The store is benefitting mains an opportunity and the prospect of attracting
Floor Trader of Farmington from relatively light local competition (Lowe’s is one or more additional grocery stores to the city.
Kiva Carpet and Tile not located in the city, but is in the larger commu-
The best prospects for attraction will be those that
nities around Gallup), and from gaps in other retail
Lloyd’s Carpet and Draperies cater to Gallup’s trade area demographics, and those
industries, such as those selling floor coverings and
that have a distribution system that enables them to
appliances. Aside from attracting these other kinds
17support a Gallup location. Fry’s Food Stores is an The La Montañita Coop could expand to meet this rather than filled by local pharmacies and home
Arizona regional chain, but its nearest location is need. The Coop is based in Albuquerque where it health stores. This will account for the small num-
Flagstaff, which would mean that a Gallup store is has five locations, along with one location each in ber of pharmacies in the city.
well beyond its current distribution limit. A better Santa Fe and Gallup. The Gallup store is small and
There is an opportunity within the cosmetics and
prospect would be Bashas’, which has stores in its current site would not allow it to easily expand.
beauty supply segment. Two of the three major
Window Rock and Crownpoint. Other locations could be identified in the down-
chains, Sephora and Sally Beauty, are already lo-
town or elsewhere in the city. The Coop could
El Super is a San Diego-based chain with a location cated in the city. The third is Ulta Beauty, which
serve an addition, important role in promoting food
in Albuquerque. This chain serves a Hispanic cus- has stores in Farmington and Albuquerque.
business entrepreneurship through its partnering to
tomer that is closely aligned with the Native Amer-
distribute products from emerging businesses. Bath and Body Works is also included in this retail
ican population, in terms of many of the foods
industry group. It is similarly located in Farmington
stocked by the chain. Health and personal care and Albuquerque, but does not have a Gallup loca-
Although Aldi is not yet in New Mexico and adja- The unique character of the local market is proba- tion. This personal care segment, focused on soaps,
cent states, its expansion plans do target these areas. bly creating a situation in which the potential for fragrances, lotions, oils, and similar products, is on
The chain is similar to Trader Joe’s, yet is more this industry is over-estimated. With a very large that is attractive to many independent businesses
likely to locate in markets with a lower income pro- portion of the population covered by Indian Health which often source much of their product line from
file. This can be considered a long term target. Services, prescriptions and some other health care local makers, along with small producers.
needs will be provided though hospitals and clinics,
GASOLINE STATIONS
TOTAL TOTAL TRADE AREA VISITOR
PRIMARY ADDED PRIMARY SECONDARY ADDED SECONDARY MARKET MARKET TOTAL MARKET ESTIMATED GAP OR MARKET
DESCRIPTION TRADE AREA POTENTIAL TRADE AREA TRADE AREA POTENTIAL TRADE AREA POTENTIAL POTENTIAL POTENTIAL SALES (SURPLUS) SHARE
Gasoline service stations with convenience stores $41,586,000 $13,224,000 $54,810,000 $66,000,000 $44,545,000 $110,545,000 $165,355,000 $41,861,511 $207,216,511 $116,200,000 $49,154,893 56.1%
Other gasoline stations $14,643,000 $4,656,000 $19,299,000 $23,239,000 $15,685,000 $38,924,000 $58,222,000 $14,739,675 $72,961,675 $0 $58,222,394 0.0%
APPAREL AND ACCESSORIES
TOTAL TOTAL TRADE AREA VISITOR
PRIMARY ADDED PRIMARY SECONDARY ADDED SECONDARY MARKET MARKET TOTAL MARKET ESTIMATED GAP OR MARKET
DESCRIPTION TRADE AREA POTENTIAL TRADE AREA TRADE AREA POTENTIAL TRADE AREA POTENTIAL POTENTIAL POTENTIAL SALES (SURPLUS) SHARE
Men's clothing stores $873,000 $278,000 $1,151,000 $539,000 $935,000 $1,474,000 $2,625,000 $110,034 $2,735,034 $0 $2,624,900 0.0%
Women's clothing stores $4,188,000 $1,332,000 $5,520,000 $2,584,000 $4,486,000 $7,070,000 $12,591,000 $527,508 $13,118,508 $350,000 $12,240,641 2.7%
Children's and infant's clothing stores $737,000 $234,000 $971,000 $454,000 $789,000 $1,243,000 $2,214,000 $92,681 $2,306,681 $0 $2,213,824 0.0%
Family clothing stores $10,734,000 $3,413,000 $14,147,000 $6,622,000 $11,498,000 $18,120,000 $32,267,000 $1,351,842 $33,618,842 $7,325,000 $24,941,933 21.8%
Clothing accessories stores $616,000 $196,000 $812,000 $380,000 $660,000 $1,040,000 $1,852,000 $77,575 $1,929,575 $550,000 $1,301,724 28.5%
Other clothing stores $1,102,000 $350,000 $1,453,000 $680,000 $1,181,000 $1,861,000 $3,313,000 $138,818 $3,451,818 $200,000 $3,113,404 5.8%
Shoe stores $2,968,000 $944,000 $3,911,000 $4,649,000 $3,179,000 $7,828,000 $11,739,000 $949,066 $12,688,066 $5,850,000 $5,889,262 46.1%
Jewelry stores $3,178,000 $1,011,000 $4,189,000 $5,079,000 $3,405,000 $8,484,000 $12,673,000 $1,036,848 $13,709,848 $3,350,000 $9,322,702 24.4%
Luggage and leather goods stores $156,000 $49,000 $205,000 $249,000 $167,000 $416,000 $621,000 $50,832 $671,832 $0 $620,895 0.0%
18Gasoline stations more accessible islands to enable easy access by large city. Additionally, the percentage of apparel sold
vehicles such as motor homes and trucks towing online is growing and will continue to eat into the
Gallup’s interstate location, the distance to other
trailers. Additionally, they should accommodate potential available to brick and mortar stores.
significant cities, and the remote location of many
larger convenience stores and dining opportunities.
trade area residents contribute to create a very large Suitable targets for Gallup include national chains
While most will be fast food, there is also the po-
market for gas stations. Gas consumption in rural found in the malls of similar communities, such as:
tential to develop a full service restaurant in a truck
areas is higher than in urban centers. This suggests Christopher and Banks
stop.
the probability that the market demand estimates,
based on lower national averages, underestimate the Apparel and accessories Buckle
market available. Torrid
This segment of the retail market has made up the
There has been turnover in gas stations within the largest share of losses in retail stores over the past Other prospects may include regional, western-
past several years. Several of Gallup’s older stations, decade. The stores most impacted are those that themed stores such as Zapaterias Pedrito (with two
including those in the “historic” stretch of Route have typically located in mall settings. Mall visita- locations in Albuquerque) and Cavender’s, which
66, do not meet modern expectations for site design tion has been declining since the 1990’s, leading to has multiple locations in the southwestern states.
and the capacity to house a convenience store, declining sales and the struggle or closure of many
along with other uses. These gas stations are finding malls. Sporting goods, hobbies, toys, games,
it harder to compete as new stations have been built music, and books
Rural malls, such as the Rio West Mall, were af-
closer to the interchanges on Interstate 40. For a community of its size, Gallup is well served
fected earliest, as they never had the customer
The new stations often have uses such as fast food counts to attract many apparel retailers. While Rio by these types of stores. Several of the chain stores
restaurants or even souvenir shops in them, making West Mall has filled a significant part of its formerly (Big 5, Hibbett Sports, Hobby Lobby) are relatively
them more attractive as a place for customers to vacant space, it has not been with stores selling new additions to the community, while a large part
stop. Both Loves and TA (Travel Centers of Amer- clothing. of the market is served by independent retailers.
ica) operate truck stops in the city. The new sporting goods stores are meeting much
While there is a loss of sales from the combined
The opportunity for this retail segment lies in mod- trade areas, some of this will be picked up by other of the existing demand, while competition in the
ernization of existing stations, or in developing new retailers. This is especially true of Walmart and to a larger cities surrounding Gallup will draw those
truck stops. Both of these approaches will provide lesser extent, the other department stores in the looking for items not available locally. This is a
SPORTING GOODS, HOBBIES, TOYS, GAMES, MUSIC, AND BOOKS
TOTAL TOTAL TRADE AREA VISITOR
PRIMARY ADDED PRIMARY SECONDARY ADDED SECONDARY MARKET MARKET TOTAL MARKET ESTIMATED GAP OR MARKET
DESCRIPTION TRADE AREA POTENTIAL TRADE AREA TRADE AREA POTENTIAL TRADE AREA POTENTIAL POTENTIAL POTENTIAL SALES (SURPLUS) SHARE
Sporting goods stores $4,736,000 $1,506,000 $6,241,000 $9,587,000 $5,073,000 $14,660,000 $20,901,000 $1,957,129 $22,858,129 $5,275,000 $15,626,113 23.1%
Hobby, toy, and game stores $2,694,000 $857,000 $3,551,000 $5,454,000 $2,886,000 $8,340,000 $11,891,000 $1,113,402 $13,004,402 $4,375,000 $7,515,533 33.6%
Sewing, needlework, and piece goods stores $822,000 $261,000 $1,083,000 $1,664,000 $881,000 $2,545,000 $3,628,000 $339,696 $3,967,696 $1,000,000 $2,627,968 25.2%
Musical instruments and supplies stores $711,000 $226,000 $937,000 $1,440,000 $762,000 $2,202,000 $3,139,000 $293,967 $3,432,967 $650,000 $2,489,292 18.9%
Book stores and news dealers $2,104,000 $669,000 $2,773,000 $1,716,000 $2,253,000 $3,969,000 $6,742,000 $350,311 $7,092,311 $300,000 $6,442,098 4.2%
Prerecorded tape, compact disc, and record stores $592,000 $188,000 $780,000 $483,000 $634,000 $1,117,000 $1,897,000 $98,602 $1,995,602 $600,000 $1,296,559 30.1%
19You can also read