City of Johannesburg URBAN INVESTMENT PARTNERSHIP CONFERENCE - 27-28 August 2015 - National Treasury
←
→
Page content transcription
If your browser does not render page correctly, please read the page content below
City of Johannesburg
URBAN INVESTMENT PARTNERSHIP CONFERENCE
            27-28 August 2015
Agenda
                                2

     1     Strategic Overview

     2   Flagship Programmes

     3
         Financial Analysis

     4   Treasury Management

     5
            Questions
City of Johannesburg
STRATEGIC OVERVIEW
Our Promise this Term of Office and Beyond …….
                                                                               6

• During this term of office we have outlined the policy that was translated
  into GDS 2040

                                     Eradicate
                                      poverty

                                                     Building
                      Good                         and growing
                    Governance                     an inclusive
                                                     economy

                                      GDS
                                      2040
                      Ensuring                        Social
                      resource                      inclusion
                    security and                     through
                   environmental                   support and
                    sustainability                 enablement
                                      Building
                                     Sustainable
                                       human
                                     settlements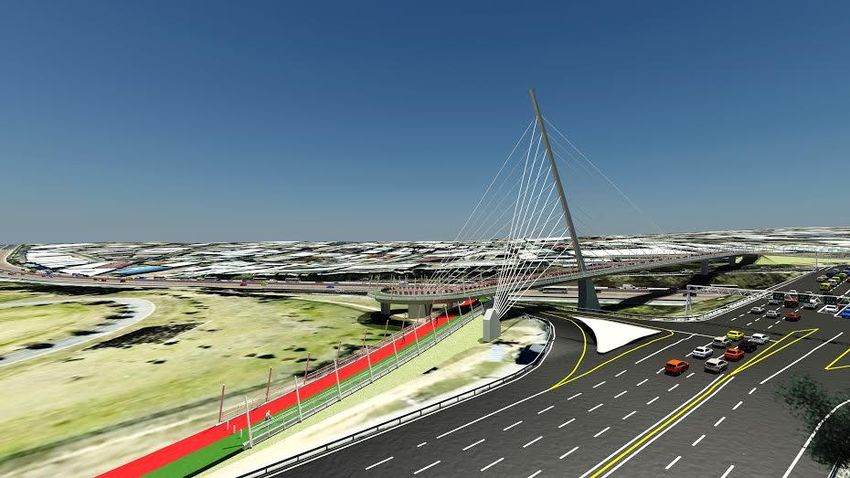
Vision, key outcomes and priorities
                                                                                                  7

                                                                        Decade 1: Priorities

                                                                        Priority 1: Financial
                                          Outcomes                      sustainability and resilience
                                                                        Priority 2: Agriculture and
                                                                        food security
                                  Improved quality of life and          Priority 3: Sustainable
                                  development-driven resilience         Human Settlements
                                  for all.
                                                                        Priorities 4, 8 and 9:
                                                                        Economic Growth – as
                                  A sustainable city which              constituted of:
        Vision                    protects its resources for future               SMME and
                                  generations and a city that is                 entrepreneurial
                                  built to last and offers a healthy,            support
To be “a World Class African      clean and safe environment.
                                                                                  Investment
City of the Future – a                                                           attraction, retention
vibrant, equitable African        An inclusive, job-intensive,                   and expansion
city, strengthened through        resilient and competitive                      The green
its diversity; a city that        economy that harnesses the                     economy
provides real quality of life;    potential of citizens’.
                                                                        Priority 5: Engaged and
a city that provides                                                    active citizenry
sustainability for all its        A high-performing metropolitan        Priority 6: Resource
citizens; a resilient and         government that proactively           sustainability
adaptive society” (Joburg         contributes to and builds a
                                  sustainable, socially inclusive,      Priority 7: Smart City
2040).
                                  locally integrated and globally       Priority 10: Safer City
                                  competitive Gauteng City Region
                                  (GCR)’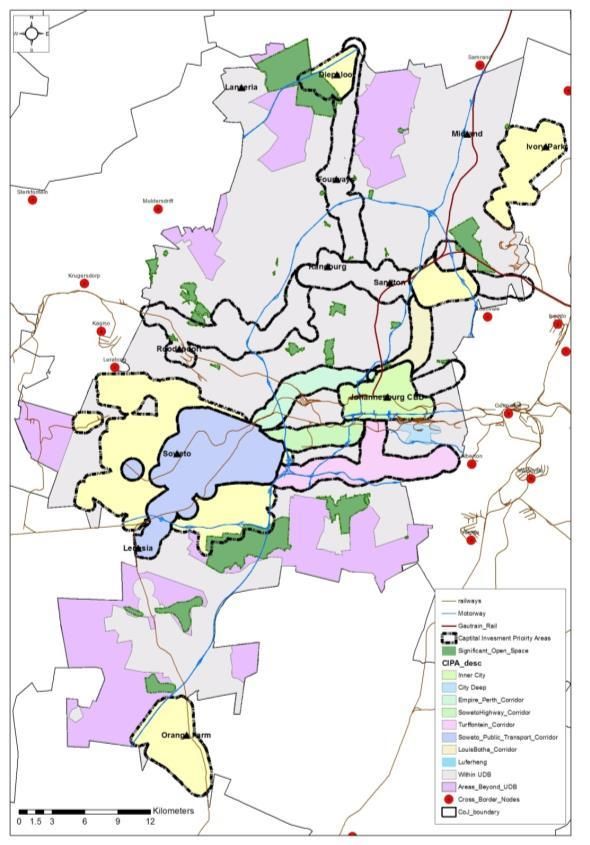
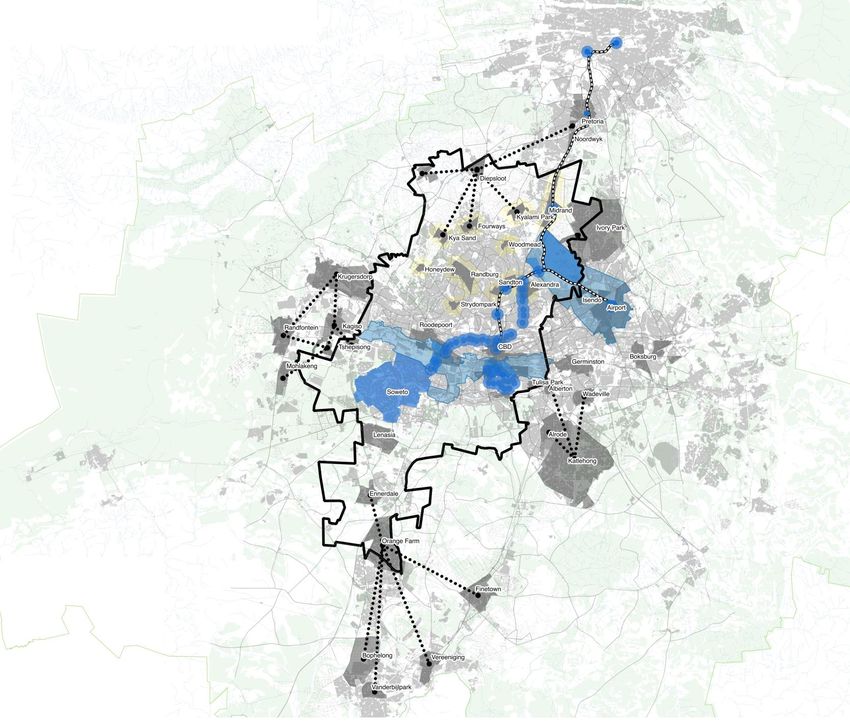
An understanding of COJ Urban Form
                                                                                8

A City Region Logic – Polycentric City Form Vs Johannesburg City Form

                            Polycentric City
                                  VS
                             Actual Joburg

    Johannesburg metropolitan structure is unique and inherited from its
  complex history. It displays inverted polycentricity, purposefully designed
       with satellites urban areas much larger than the core of the city.
The Spatial Development Framework 2040
                                                        9

Emerging spatial concepts – key transformative areas

Key spatial transformation areas:
⁻ Positioning the inner city as
   the core
⁻ Unlocking the mining belt
⁻ Connecting the airport
⁻ Urbanising Soweto
⁻ Addressing marginalization
⁻ Consolidating public
   transport backbone

How we treat the rest of the city
in support of spatial planning
objectives- current & planned
major developments
Capital Investment Priority Areas
                                                    11
                        7.5%

                                             5.2%
                        0.5%

                              3.0%    5.7%
                                 8.1%
                3.2%
                       7.1%
                              16.2%
       16.1%
               15.2%
                              6.0%

         5.4%
11
11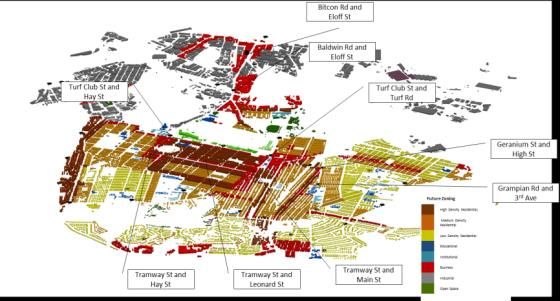
High Level Capital Expenditure Split
                                            12

12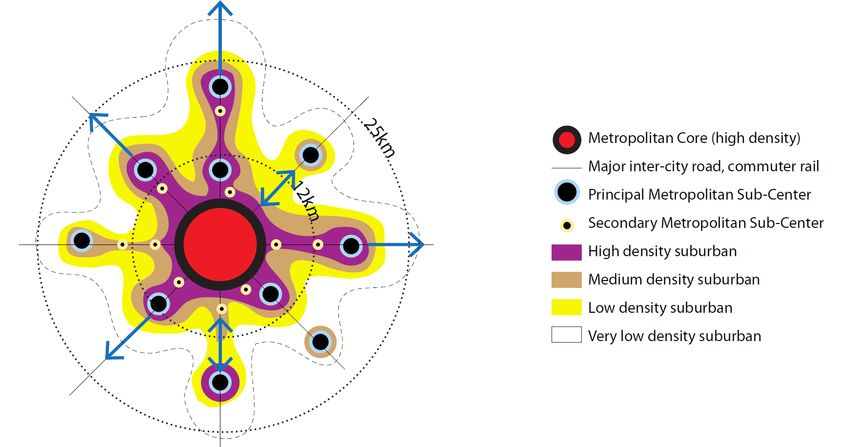
City of Johannesburg
     FLAGSHIP PROGRAMMES
Corridors of Freedom/Lanseria Node/ Waste to Energy
Flagship Programme 1 – Corridors of Freedom(CoF)
14
The figure below represents the life cycle of the Corridors namely Soweto to
CBD along Empire/ Perth, CBD to Alexandra along Louis Botha, Turffontein
node, Mining Belt and Soweto and in the longer term Sandton/Randburg to
Diepsloot and Alexandra to Ivory Park .
BRT Campus
6 Parks Construction Square
Sky Walk
3 New Infrastructure
Clinics
Partial Realising the
Great complete vision
NEW NMT
Library Walk
Future City
Model
Projects Implementation process
October May June October November June
2012 2013 2014 2014 2014 2016 2040
MTEF
Approved Strategic Area
State of the
City Address Frameworks
Approved Implementation
Action Plan
Approved
AFD Loan
Backed by
Corridors
Embedding the Corridors of
FreedomCorridors of Freedom(CoF) – Medium Term City Priorities
15
Soweto
Louis Botha
Empire-Perth
TurffonteinCorridors of Freedom(CoF) MTREF Capital Expenditure
16
The table below shows that the City’s capital expenditure on the Corridors of
Freedom is expected to be R3.3 billion over the next three years
2015/2016 Medium Term Revenue & Expenditure Framework
Corridor
Budget Year 2015/2016 Budget Year 2016/2017 Budget Year 2017/2018
Turffontein 296 496 912 461 250 000 503 050 000
Louis Botha 340 218 983 273 750 000 225 884 000
Perth 259 295 404 646 006 000 342 684 532
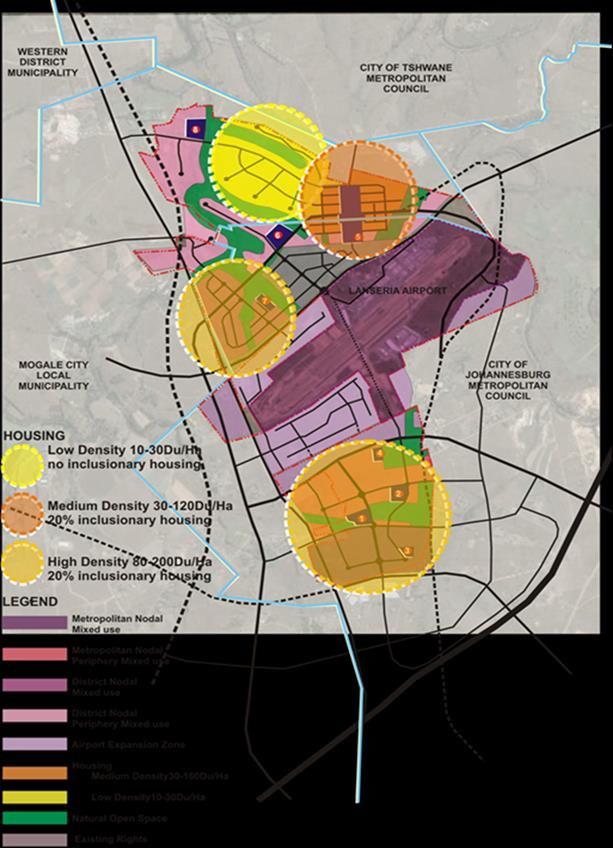
TOTAL 896 011 299 1 381 006 000 1 071 618 532Flagship Programme 2 – Lanseria Node
17
Lanseria Node
Approximately 900Ha located around the
Lanseria International Airport within City of
Joburg and Mogale City Municipality.
COJ Lanseria UDF 2020
Lanseria Development Framework identifies
the Lanseria airport as a major business and
commercial node within the precinct.
The development framework directs the
future development of the area, effectively
unlocking the inherent development
opportunity, provided that its directives are
met and that policy is complied with.
Mogale City SDF
Similarly the Mogale City spatial development
framework identifies Lanseria airport as an
opportunity, allowing for mixed use
development in the vicinity of the airport.Lanseria Economic Node-Land Use Budget & Engineering Services
18
Land Use Budget Availability of Engineering Services
A preliminary gross Land Use Budget Sewer
has been established for the plan. This Master planning for waste water treatment has
been executed on behalf of Johannesburg Water.
is in accordance with the Lanseria Various pump stations, rising mains, gravity sewers
Development Framework 2020 of the and waste water treatment plants are proposed.
City of Johannesburg. It is estimated
that the development in total will yield Water
the following: Water master planning has been executed on behalf
of Johannesburg Water for the “Lanseria Corridor”.
It is envisaged to provide regional water storage
-750,000m² of retail reservoirs for the purposes of water reticulation.
-2,5 million m² of business / office
-3,7 million m² of residential Electricity
-1,2 million m² of industrial / The Node will be serviced via the existing Lanseria
commercial substation
-200,000 m² of tourism / leisure
-An approximate total of 8,2 million Rail
m². The proposed node is large enough to warrant rail
connection. This could be located within one of the
road reserves. The rail could take the form of a
Gautrain Spur or an extension of one of the
Spoornet lines. Feasibility study to determine
alignment is being undertaken.Flagship Programme 3 – Waste to Energy
19
Project Type Resource Sustainability
Project Name Waste to Energy
Purpose and To implement a further waste minimisation initiatives to address the problem of
Objective of escalating waste generation and fast diminishing landfill space. A first of its kind
Project project on gasification will be implemented with the added benefit of producing
energy and creating jobs by 2040 and also reduce waste to landfill by 80%.
Project Public Private Partnership (PPP) which will be a vehicle to fund, build, operate and
Structure maintain the infrastructure.
The project will be ring fenced with gate fees as main source of income. The City will
offer a site and guarantee feedstock waste from Material Recovery Facilities. This
project is still being investigated at feasibility study level.
Current Status Detailed technical studies with regards to waste categorisation and alternative
technologies are available. Financial modelling has also been undertaken.
Compliance Environmental compliance and PPP procurement compliance is required
Risks A project of this nature has not been done in South Africa before.
The potential outcome from NERSA, the Minister of Energy, and the impact on the
IRP and REIPPP are not predictable at this stage.
The TA also notes that there is a reliance on external parties for Project
authorisations namely:
• National and Provincial Treasuries, DCOG, DOE, and DEA for MFMA views and
recommendation;
• DEA: Site Environmental Impact Assessment and waste storage and treatment;
• NERSA and DOE: Electricity generation licence and tariff determination;Flagship Programme 3 – Waste to Energy
20
Project Type Resource Sustainability
Project Name Energy and Water Demand Management
Purpose and This project is intended to:
objective of • Provide funding mechanisms for the private sector (households and business) to
project address energy and water demand measures. Short term funding (payback over
5 years) to be paid back from savings.
o Undertake initiatives that will introduce solar geysers, retrofitting, load
management, photovoltaic and electricity storage devices.
o Introduce water saving devices, rainwater harvesting and re-use of grey
water.
o This option is also available to informal settlements where off-grid solutions
are the only means to services such as water, sanitation and energy.
Project Private loan funding to business and households.
Structure The City will promote and endorse the project. The City wants to partner with the
objective to apply demand side measures but more importantly to stimulate the
local economy with regards to technology development, manufacturing,
installation and maintenance services.
Current Status Project still at conceptual stage
Compliance Project still at conceptual stage
Risks Project still at conceptual stageCity of Johannesburg FINANCIAL ANALYSIS
Our key achievements: Governance
                                                         22

             •   Unqualified audit opinion and 4 MEs with
                 clean audit opinion
             •   95% capital expenditure
             •   Attainment of critical ratios: current ratio,
                 remuneration to expenditure, cash
                 coverage
             •   94% revenue collection with respect to
                 billing
             •    Successful roll out of Community Based
                  Planning in all 7 Regions, projects already
                  in implementation in Region E
             •    Extensive regional based community
                  engagements as lead by political
                  leadership
             •    Intelligent Operations Centre (IOC)
                  through automation of processes –
                  already seeing reduction in crime in areas
                  with cameras
             •    Smart City WiFi hotspots BRT Stations &
                  Selected Stadias
Financial Review
23
• The City of Johannesburg has achieved the following in the year 2013/2014:
• A strong financial position with a surplus of R4,2 billion
• Healthy liquidity levels with closing cash balance of R5,3 billion (2013 R5,4 billion) and
successful redemption of bonds and other liabilities
• Raised R1,458 billion in bonds
• Spent 95% of capital expenditure budget which has increased from R4,5 billion in
2012/2013 to R7,3 billion in 2013/2014
• A progressive increase in the City’s total assets by 5%
• Increase in total income by 13%
• Revenue collection rate of 94% was achieved for the year under review
• Maintained its respectable credit ratings with Fitch and Moody’s at AA-zaf (/F1+.ZAF)
with a stable outlook and A2.za (P-1.Za) with a stable outlook respectively until year
end.
• An unqualified audit opinion in 2013/2014 and 2012/20132013/2014 Annual Financial Performance
24
Revenue Surplus Assets Capital
Expenditure
• Revenue has increased from R35 billion to R39 billion
• Surplus has increased from R3,5 billion to R4,2 billion
• Assets have increased from R60 billion to R67 billion
• Capital expenditure has increase from R4,3 billion to R7,3 billionPrudential Ratios
25
Current ratio Solvency ratio
1.08
1.08
1.06
2.13
2.15
1.04
2.10
1.02 1 1 1
2.05 2 2.02 2
1
0.98 2.00
0.96 1.95
Actual Target Actual Target 1.90
30-Jun-14 30-Jun-13 Actual Target Actual Target
30-Jun-14 30-Jun-13
Debt: Revenue Ratio
46.00% 45% 45%
44.00%
42.00%
40.00% 39.00%
38.00%
38.00%
36.00%
34.00%
Actual Target Actual Target
30-Jun-14 30-Jun-13Credit Rating Opinion
26
The City’s Credit rating has remained stable in the 2013/2014 Financial year.
Agency Rating Outlook
Fitch AA-.zaf/F1+.zaf Stable Outlook
Moody’s A2.za/P-1.za Stable OutlookCity of Johannesburg TREASURY MANAGEMENT
Long Term Debt
                                                                          28

        Funding Sources
         Finance
         Leases
           3%
                                       • The City Successfully Raised
                                           the first ever R1,458b Green
                              BANKS
                               29%
                                           Bond in 2013/2014, which
                                           was oversubscribed by 150%

                                       • Total liability book for
                                           2013/14 financial year is
                                           R13,8billion

                                       • The City has to date issued a
                                           total of about R9.9 billion
BONDS                         DFI
 58%                          10%          institutional bonds and R2.2
                                           billion thereof were
                                           redeemed successfully, with
                                           the outstanding amount
                                           being about R7.7 billion
Financing Governance Strategies
29
Two strategies are utilized, namely:
- 3 year Budget Plan &
- 10 year Financial Development Plan
Budget Plan
- The plan outlines 3 year rolling Medium Term Revenue and Expenditure
Framework.
- All Capital Expenditure projects are assumed to be funded within the plan.
- The plan is updated semi-annually
Financial Development Plan(FDP)
- It’s a 10 year rolling financing approach plan and acts as an input to the
Budget Plan.
- The FDP seeks to proactively monitor the progress on 10 year CAPEX so as
to achieve a stable and sustainable finances that are able to withstand
internal and external risks or increased delivery pressures.
- The plan is constantly updated with both external and internal inputs which
affect capital expenditure(GDP, Revenue Sources, Collection rate, etc)FDP and Budget Plans Interaction
30
Below is an illustration of the interaction between Budget and FDP. The
objective is to make sure that Financial Ratio targets are maintained.
3 yr Budget 10 yr FDP
Capital expenditure Actuals Adj Budget
R'000 2013/14 2014/15 2015/16 2016/17 2017/18 2018/19 2019/20 2020/21 2021/22 2022/23 2023/24
Transfers recognised - capital 34% 25% 28% 29% 33% 28% 25% 23% 30% 28% 19%
Public contributions & donations* 3% 2% 3% 3% 3% 6% 7% 9% 11% 12% 13%
Borrowing 43% 30% 40% 25% 32% 28% 27% 30% 28% 25% 28%
Internally generated funds 20% 42% 30% 42% 31% 38% 41% 38% 31% 35% 40%
Total capex 100% 100% 100% 100% 100% 100% 100% 100% 100% 100% 100%Diversified Financing Activities
31
• Other funding activities the City has explored include: Project Finance
(Landfill gas to energy project); Export Credit Agency “ECA” which was used
to finance phase 1 A of the Bus Rapid Transit system
• In addition the funding activities previously engaged in, the City is looking
into exploring in the near future other innovative funding activities such as:
− Pooled Financing
− Project Finance
− Tax Increment Financing
− Public Private Partnerships “PPP”Medium Term Capital Funding
32
Budget Budget Budget Budget
Funding Source 2013/14 2014/15 2015/16 2016/17
R 000 R 000 R 001 R 002
Loan Funding 1 458 631 3 276 000 3 940 000 2 506 000
CRR & Surplus Cash 3 147 604 4 530 718 2 777 803 4 059 299
Grants and Contributions 3 094 028 3 021 231 3 039 653 3 170 193
Total 7 700 263 10 827 949 9 757 456 9 735 492
• Spending R30,1 billion of the R100 billion capital program over a period of 3 years
from 2012/2013 financial Year
• Launched Green bond in the 2013/2014 year in support of Climate Change
Initiatives
• The City remains committed to ensuring that most of its Capital expenditure is
funded through Internally Generated Funds.33
Questions
33You can also read