City of Peoria - City of ...
←
→
Page content transcription
If your browser does not render page correctly, please read the page content below
City of Peoria
       SOLID WASTE UTILITY
         RATE AND COST OF
            SERVICE STUDY
                         FINAL REPORT

                        February 2021

                                      Washington
                   7525 166th Avenue NE, Ste. D215
                               Redmond, WA 98052
                                     425.867.1802
                                              Oregon
                 4000 Kruse Way Pl., Bldg. 1, Ste 220
                            Lake Oswego, OR 97035
                                       503.841.6543
                                           Colorado
                               1320 Pearl St, Ste 120
                                  Boulder, CO 80302
                                       719.284.9168
                                 www.fcsgroup.com
Firm Headquarters                             Established 1988
                                                    Redmond Town Center                   Washington | 425.867.1802
                                                    7525 166th Ave NE, Ste. D-215            Oregon | 503.841.6543
                                                    Redmond, Washington 98052              Colorado | 719.284.9168

February 16, 2021

Ben Beutler, Budget Coordinator
City of Peoria, AZ
8401 W. Monroe St.

Peoria, AZ 85345

Subject: Final Report for Solid Waste Utility Rate and Cost of Service Study

Dear Ben,
FCS GROUP is pleased to submit this final report of the Solid Waste Utility Rate and Cost of Service
Study. The report summarizes the methodology, findings, and recommendations for each of the core
elements of the rate study.
It has been a pleasure working with you and other City of Peoria staff on this effort. Please let me
know if you have any questions or need additional information on this report. I can be reached at
(425) 336-4157.

Sincerely,

Angie Sanchez-Virnoche                          Matt Hobson                         Sam Ault
Principal and Vice President                    Project Manager                     Analyst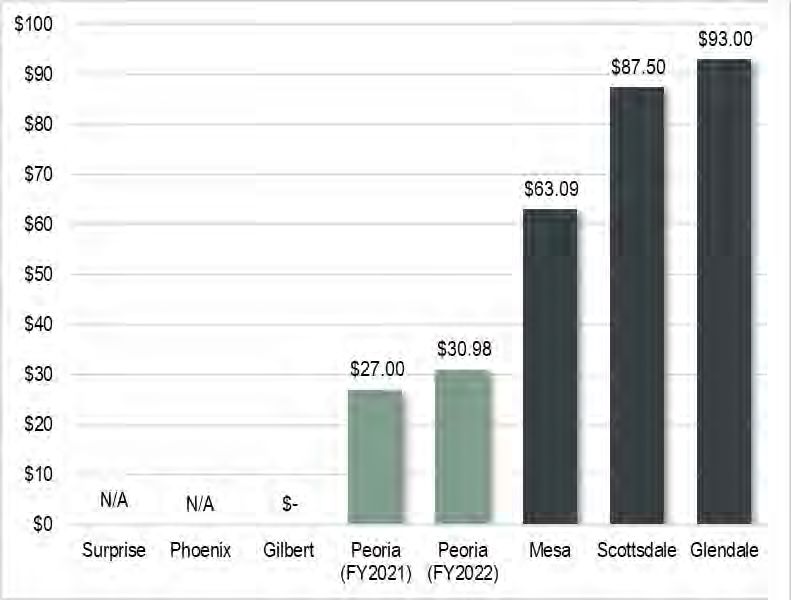
City of Peoria, AZ                                                                                                                                         February 2021
Solid Waste Utility Rate and Cost of Service Study                                                                                                                 page i

                                                                                        TABLE OF CONTENTS
Table of Contents ............................................................................................................................................ i

Section I.               Executive Summary .............................................................................................................. 1
   I.A.        Study Objectives ............................................................................................................................................ 1
   I.B.        Residential Solid Waste Study Results ........................................................................................................... 1
   I.C.        Commercial Solid Waste Study Results .......................................................................................................... 2

Section II.              Rate Setting Principles and Methodology .............................................................................. 5
   II.A.       Overview ....................................................................................................................................................... 5
   II.B.       Fiscal Policies ................................................................................................................................................ 6
   II.C.       Revenue Requirement ................................................................................................................................... 7
   II.D.       Cost of Service .............................................................................................................................................. 7
   II.E.       Rate Design ................................................................................................................................................... 8

Section III.             Residential Solid Waste Utility ............................................................................................... 9
   III.A.      Introduction.................................................................................................................................................... 9
   III.B.      Revenue Requirement ................................................................................................................................... 9
   III.C.      Cost of Service ............................................................................................................................................ 15
   III.D.      Rate Design ................................................................................................................................................. 18

Section IV.              Commercial Solid Waste Utility ........................................................................................... 20
   IV.A.       Introduction.................................................................................................................................................. 20
   IV.B.       Revenue Requirement ................................................................................................................................. 20
   IV.C.       Cost of Service ............................................................................................................................................ 24
   IV.D.       Rate Design ................................................................................................................................................. 28

Section V.               Rate and Operating Cost Benchmarking Survey .................................................................. 33
   V.A.        Introduction.................................................................................................................................................. 33
   V.B.        Service Area ................................................................................................................................................ 33
   V.C.        Solid Waste Services ................................................................................................................................... 34
   V.D.        Other Measures ........................................................................................................................................... 36
   V.E.        General Observations .................................................................................................................................. 39

Section VI.              Summary ............................................................................................................................ 40
   VI.A.       Study Objectives .......................................................................................................................................... 40
   VI.B.       Residential Solid Waste Study Results ......................................................................................................... 40
   VI.C.       Commercial Solid Waste Study Results ........................................................................................................ 40

                                                                                                                                              www.fcsgroup.com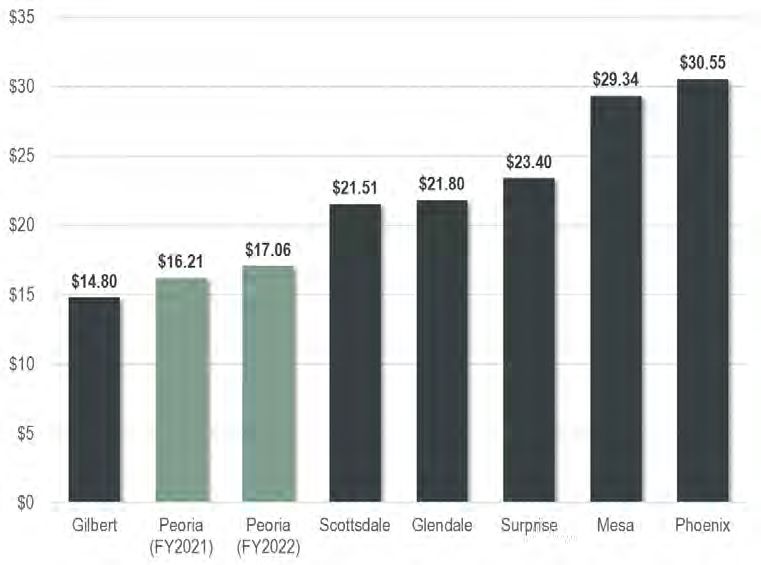
City of Peoria, AZ                                                                           February 2021
Solid Waste Utility Rate and Cost of Service Study                                                  page 1

                     Section I.                      EXECUTIVE SUMMARY
I.A.          STUDY OBJECTIVES
The City contracted with FCS GROUP to complete a comprehensive rate and cost of service study
for the residential and commercial solid waste utilities. The results of this study establish a blueprint
for achieving strong financial performance in the future while delivering efficient and effective
services to the customers. The scope of the project included the following key elements:
⚫   Assess revenue needs for a five-year rate setting period (FY 2022 to FY 2026) that includes
    adequate funding for operations and maintenance, debt service, and other program activities.
⚫   Forecast long-term capital needs and incorporate these needs into a long-term funding forecast.
⚫   Develop planning level cost and rate estimates for a residential green waste collection program.
⚫   Use industry standard methodologies to establish a defensible basis for assigning “cost shares”
    and establishing “equity” for solid waste customers.
⚫   Develop and recommend rate structures that generate sufficient revenue to meet the utility’s
    financial obligations on a standalone basis.
⚫   Conduct an operating and rate benchmarking survey of comparative city solid waste services.

I.B.          RESIDENTIAL SOLID WASTE STUDY RESULTS
Collection, disposal, and capital expenditures are anticipated to outpace revenue at existing rate s.
Annual rate revenue adjustments of 5.25 percent are projected each year from FY 2022 to FY 2026.
Annual rate adjustments are assumed to be implemented mid-year in each fiscal year (January).
Combined with available financial reserves, these adjustments would generate adequate funding to
meet the utility’s ongoing expenditures and maintain compliance with reserve funding policies
established by the City’s Principles of Sound Financial Management.

                                                                                      www.fcsgroup.com
City of Peoria, AZ                                                                           February 2021
Solid Waste Utility Rate and Cost of Service Study                                                  page 2

                                            Exhibit 1.1
                       Revenue Requirement Analysis for Residential Solid Waste

The proposed rate revenue adjustments would be assessed to the monthly fixed charge and the
optional monthly charge for additional refuse collection. Annual rate revenue adjustments are
assumed to be implemented mid-year in each fiscal year (January). The proposed rates for residential
solid waste service over the rate-setting period are summarized in Exhibit 1.2.
                                                 Exhibit 1.2
                                    Proposed Residential Solid Waste Rates
                                        Existing     FY 2022   FY 2023   FY 2024   FY 2025      FY 2026
  Standard Service                       $16.21       $17.06    $17.96    $18.90    $19.89       $20.93
   Change from Prior Year                              $0.85     $0.90     $0.94     $0.99        $1.04
   Percent Change from Prior Year                     5.24%     5.28%     5.23%     5.24%        5.23%

  Additional Refuse Service              $13.28      $13.98    $14.71    $15.48    $16.29        $17.15
   Change from Prior Year                             $0.70     $0.73     $0.77     $0.81         $0.86
   Percent Change from Prior Year                    5.27%     5.22%     5.23%     5.23%         5.28%

I.C.          COMMERCIAL SOLID WASTE STUDY RESULTS
Annual rate revenue adjustments of 2.50 percent are projected each year from FY 2022 to FY 2026.
These adjustments would generate adequate funding to meet the utility’s ongoing expenditures and
maintain compliance with reserve funding policies established by the City’s Principles of Sound
Financial Management. Annual rate revenue adjustments are assumed to be implemented mid-year in
each fiscal year (January).

                                                                                   www.fcsgroup.com
City of Peoria, AZ                                                                                 February 2021
Solid Waste Utility Rate and Cost of Service Study                                                        page 3

                                             Exhibit 1.3
                        Revenue Requirement Analysis for Commercial Solid Waste

I.C.1.          Cost of Service Analysis
The cost of service results indicate that existing rate revenues generated from the front load refuse
service are within the cost to provide this service. Existing rate revenues for roll -off service exceed
the cost of service by approximately $83,000 in the test year. Meanwhile, existing rate revenues for
front-load recycling service generate just $89,000 compared to a cost of service of $242,000 – a
difference of 172 percent.

The cost of service results were reviewed with City staff. Based on these discussions, a seven-year
strategy was developed to transition front-load recycling service towards cost of service. Because
roll-off service rates are currently above cost of service, the phase-in strategy would also hold roll-
off rates at existing levels to improve the alignment of rates to cost of service. Exhibit 1.4
summarizes the seven-year rate revenue strategy for each class of service.
                                         Exhibit 1.4
          FY 2022 to FY 2028 Commercial Solid Waste Cost of Service Phase-In Strategy

         Customer Class             FY 2022      FY 2023      FY 2024   FY 2025   FY 2026     FY 2027   FY 2028

 Front Load Refuse                  3.06%             3.01%    2.66%     2.23%     2.01%       1.31%     0.82%
 Front Load Recycling               10.00%           10.00%   15.00%    20.00%    20.00%      25.00%    25.00%
 Compactor                           2.50%            2.50%    2.50%     2.50%     2.50%       2.50%     2.50%
 Roll-Off                            0.00%            0.00%    0.00%     0.00%     0.00%       0.00%     0.00%
Total                                2.50%            2.50%    2.50%     2.50%     2.50%       2.50%     2.50%

I.C.2.         Rate Design
The City evaluated several rate structure changes to commercial solid waste rates including:
⚫   High Density MSW Premium – A monthly premium charge assessed to front load refuse customers
    who routinely generate high density solid waste (e.g., manure and glass). The City does not

                                                                                            www.fcsgroup.com
City of Peoria, AZ February 2021
Solid Waste Utility Rate and Cost of Service Study page 4
weigh individual containers at time of collection, so the analysis for this type of rate structure
was based on assumptions for standard and high density solid waste.
» The cost of service analysis indicated that the premium would be approximately $0.60 per
cubic yard of service. A one cubic yard container serviced weekly would be assessed a
monthly premium of $2.60 ($0.60 x 1 cubic yard x 4.33 pickups per month).
⚫ Differential Rates for Front Load Recycling Containers – Recycling customers currently pay the same
rate for container sizes ranging from 90 gallons to 8 cubic yards. The City is proposing higher
rate increases to larger containers to account for the higher cost of service for these containers
(e.g., recycling processing expenses). Existing rates would be transitioned over a seven-year
period consistent with the cost of service phase-in strategy.
» The FY 2022 rate revenue target increase for front load recycling is 10 percent. A 2 cubic
yard container would increase 4 percent while an 8 cubic yard container would increase 15
percent.
» The FY 2026 rate revenue target increase is 20 percent. A 2 cubic yard container would
increase 14 percent while an 8 cubic yard container would increase 25 percent.
» By FY 2026, the monthly rate for an 8 cubic yard recycling container would be $66.00
compared to $111.50 for a similar level of City refuse service. Existing rates for similar
recycling service at the City of Scottsdale and City of Mesa are $87.50 and $63.09,
respectively. The rate for the City of Mesa is for cardboard recycling only.
⚫ Restructured Roll-Off Rates –The City is proposing to assess a $75 monthly charge on roll-off
service for customers that do not schedule at least one container pull per month. This charge is in
addition to the $50 monthly rental charge.
» Based on a review of roll-off customer billing charges in FY 2019, approximately 74 percent
of accounts that rent roll-off containers in a month do not request a container pull within the
same month (equivalent to approximately 30 accounts per month). The new rate is estimated
to generate $32,000 in rate revenue in FY 2022.
Commercial solid waste rate schedules for the FY 2022 to FY 2026 rate period are detailed in
Exhibit 4.9 of the report.
www.fcsgroup.comCity of Peoria, AZ February 2021
Solid Waste Utility Rate and Cost of Service Study page 5
Section II. RATE SETTING PRINCIPLES
AND METHODOLOGY
II.A. OVERVIEW
The methods used to establish user rates are based on principles that are generally accepted and
widely followed throughout the industry. These principles are designed to produce rates that
equitably recover costs from each class of customer by setting the appropriate level of revenue to be
collected from ratepayers and establishing a rate structure to collect those revenues.
The three key analyses completed as part of the rate study process are listed below:
⚫ Revenue Requirement. This analysis identifies the total revenue requirement to fully fund the
residential and commercial solid waste utilities on a standalone basis, considering operating and
maintenance expenditures, capital funding needs, and fiscal policy objectives.
⚫ Cost of Service. This analysis equitably distributes costs to customer classes based on their
proportional demand and use of the system.
⚫ Rate Design. This analysis includes the development of rate structures that generate sufficient
revenue to meet each system’s revenue requirement forecast and to address the City’s pricing
objectives.
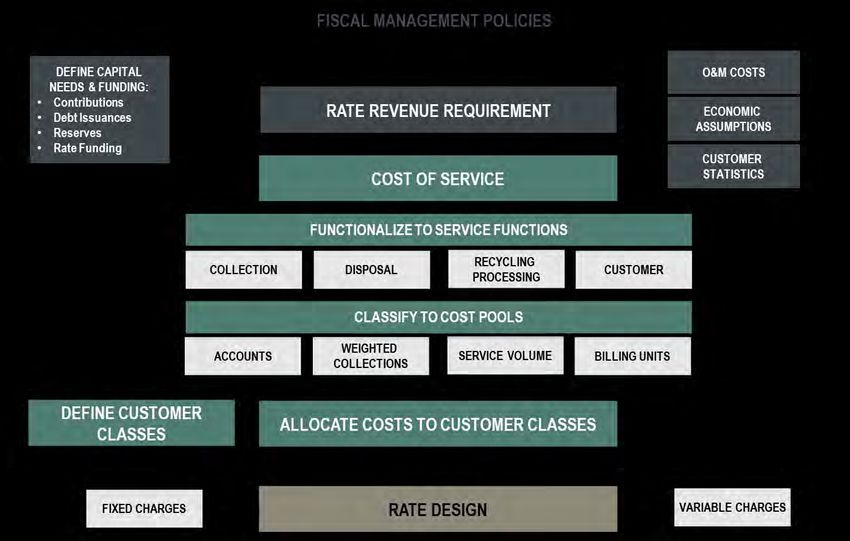
Exhibit 2.1 illustrates the entire rate study process.
Exhibit 2.1 Overview of the Rate Study Process
www.fcsgroup.comCity of Peoria, AZ February 2021
Solid Waste Utility Rate and Cost of Service Study page 6
II.B. FISCAL POLICIES
The basic framework for evaluating utility revenue needs is founded on a set of fiscal policies. These
policies, which can address a variety of topics including cash management, capital fundi ng strategy,
financial performance, and rate equity, are intended to promote long-term financial viability for the
City’s solid waste utilities. The City’s fiscal policies are formalized in its Principles of Sound
Financial Management. Topics addressed in the fiscal policy resolution include financial reserves,
capital improvement plan management, debt management, revenue sufficiency, and rate equity.
II.B.1. Utility Reserves
Reserves are a key component of any utility financial strategy, as they provide the flexibility to
manage variations in costs and revenues that could otherwise have an adverse impact on ratepayers.
The rate study included the following financial reserves:
⚫ Operating Reserve – Operating reserves are designed to provide a liquidity cushion to ensure that
adequate cash will be maintained to deal with significant cash balance fluctuations such as
seasonal fluctuations in billings and receipts, unanticipated cash expenses, or low er than expected
revenue collections. Industry standard is to maintain a minimum balance in the operating reserve
equal to 30 to 60 days of operations and maintenance (O&M) expenses for a municipal solid
waste utility. These, of course, are guidelines and actual levels should be established based upon
each jurisdiction’s unique needs and tolerance for risk. The current operating reserve target for
the solid waste enterprise funds is 20 percent of O&M expenses (equivalent to about 70 days). It
is assumed that any operating funds above this target are available for capital projects.
⚫ Equipment Replacement Reserve – An equipment replacement reserve is a best practice in municipal
fleet management. The reserve is a funding mechanism for future fleet replacement costs. Each
solid waste utility is assessed an annual charge that is transferred to an equipment replacement
reserve fund. The City accumulates a reserve over the lifecycle of a solid waste vehicle so that
funding is available to replace that vehicle at the end of its useful life. The annual transfer from
each utility to the Equipment Replacement Reserve is based on the planned lifecycle (in years) of
each vehicle, anticipated salvage revenues, and an assumed rate of inflation for the vehicle’s
replacement. The annual charge for the residential and commercial solid waste funds is $1.4M
and $0.3M respectively in FY 2021. Future contributions to the reserve fund are based on a
vehicle replacement schedule provided by the City.
Reserves should fluctuate above and below targets, and such experience does not reflect on the
quality of budgeting or management. In fact, if a reserve remains static for extended periods of time
without use, this may indicate that it is not set appropriately, or is unnecessa ry. Utility reserves are
intended to absorb fluctuation in revenues or expenditures without abrupt rate impacts. As reserve
levels vary, a policy structure can define the mechanisms for regulating those levels and returning
them to intended targets.
II.B.2. Debt Management
Debt issuance is a valuable tool for the City to use to finance certain costs, as it allows the City to
spread a relatively large capital project cost over several years. Debt repayment structures can be
quite flexible (e.g. deferred principal repayment), allowing the City to “shape” its cost structure and
facilitate a stable progression of moderate rate adjustments. When developing its capital funding
strategy, the City must weigh the pros and cons of issuing debt to pay for a project . Too much debt
www.fcsgroup.comCity of Peoria, AZ February 2021
Solid Waste Utility Rate and Cost of Service Study page 7
issuance may limit the City’s ability to manage its rates. However, excessive aversion to issuing debt
can also create problems, shifting the burden of funding capital investment to existing customers. It
is prudent to consider policies related to debt management as part of a broader utility financial policy
structure. Common debt management policies may include the level of acceptable outstanding debt,
debt repayment terms, bond coverage and total debt coverage targets.
II.C. REVENUE REQUIREMENT
A revenue requirement analysis forms the basis for a long-range financial plan and multi-year rate
management strategy for the residential and commercial solid waste funds. It also enables the City to
set utility rate structures which fully recover the total cost of operating each utility: capital
improvement and replacement, operations, maintenance, general administration, fiscal policy
attainment, cash reserve management, and debt repayment. Linking rate levels to a financial plan
such as this helps to enable not only sound financial performance for the City’s solid waste funds, but
also establishes a clear and reasonable relationship between the rates imposed on utility customers
and the costs incurred to provide the service.
A revenue requirement analysis establishes the total annual financial obligations of the utility by
bringing together the following core elements:
⚫ Fiscal Policy Analysis. Identifies formal and informal fiscal policies of the City to ensure that
current policies are maintained, including reserve levels, rate funded capital and debt service
coverage.
⚫ Capital Funding Plan. Defines a strategy for funding each utility’s capital improvement program,
including an analysis of available resources from rate revenues, debt financing, and any specia l
resources that may be readily available (e.g., grants, outside contributions, etc.).
⚫ Operating Forecast. Identifies future annual non-capital costs associated with the operation,
maintenance, and administration of the system.
⚫ Sufficiency Testing. Evaluates the sufficiency of revenues in meeting all financial obligations,
including any coverage requirements associated with long-term debt.
⚫ Strategy Development. Designs a forward-looking strategy for adjusting rates to fully fund all
financial obligations on a periodic or annual basis over the planning period.
II.D. COST OF SERVICE
The purpose of a cost of service analysis is to provide a rational basis for distributing the full costs of
each utility service to each class of customers in proportion to the demands they place on the system.
Detailed cost allocations, along with appropriate customer class designations, help to sharpen the
degree of equity that can be achieved in the resulting rate structure design. The key analytical steps
of the cost of service analysis are as follows:
⚫ Functional Cost Allocation. Apportions the annual revenue requirement to the major functions of
each solid waste utility:
» Residential: customer, refuse collection, recycling collection, bulky trash collection, green
waste collection, disposal, recycling processing, and green waste processing.
» Commercial: customer, front load collection, roll-off collection, disposal, and recycling
processing.
www.fcsgroup.comCity of Peoria, AZ February 2021
Solid Waste Utility Rate and Cost of Service Study page 8
⚫ Cost Classification. Establishes a rational relationship between functions (activities) and costs. For
example, the cost of disposing waste at an area landfill is determined by the tonnage sent to the
landfill and the tipping fee per ton assessed at the landfill. An allocation of these disposal costs to
a particular customer class would be based on the tons generated by that customer class. Billings,
tonnage, and collection statistics are developed to allocate the cost of service to customers
classes.
⚫ Customer Class Designation. Identifies the customer classes that will be evaluated as part of the
study. Existing as well as new or revised customer classes or class definitions may be considered.
It is appropriate to group customers that exhibit similar usage characteristics and service
requirements.
⚫ Cost Allocation. Allocates the costs from the functional cost allocation to different customer
classes based on their unique demands for each service as defined through the cost classification
process. The results identify shifts in cost recovery by customer class from that experienced
under the existing rate structure.
II.E. RATE DESIGN
The principal consideration of rate design is for the rate structure to generate sufficient revenues for
the system which are reasonably commensurate with the cost of providing service. The pricing
structure is largely dictated by the objectives of the utility. Most residential solid waste programs that
offer only one garbage container size assess a uniform monthly rate to each customer. Residential
solid waste programs with multiple garbage container sizes may implement a “pay-as-you-throw”
rate structure in which larger container service is provided at a higher monthly rate. Due to the
variation in the amount and type of waste generated from non-residential sectors, commercial solid
waste programs generally charge variable rates to customers based on the size of container and
frequency of service. This type of rate structure ensures that the variable rate recovers the variable
costs to collect and dispose of solid waste from each customer account.
Other considerations of rate design include understandability by the rate payer; administrative ease;
revenue stability; interclass and intraclass customer equity; sustainability goals; and affordability.
www.fcsgroup.comCity of Peoria, AZ February 2021
Solid Waste Utility Rate and Cost of Service Study page 9
Section III. RESIDENTIAL SOLID WASTE
UTILITY
III.A. INTRODUCTION
The City of Peoria owns and operates the solid waste utility that is responsible for residential and
commercial solid waste collection and disposal. The residential solid waste program provid es refuse,
recycling, bulk trash, and household hazardous waste collection services to approximately 60,000
residential customers within the City’s service area. Through its residential solid waste program, the
City offers a once per week refuse pickup service in which it collected nearly 55,000 tons of
municipal solid waste (MSW) in FY 2019. Weekly recycling collection is also provided to residential
customers – City crews collected approximately 16,000 tons of material through its recycling
program in FY 2019.
The City operates and maintains a collection fleet of approximately 60 solid waste vehicles. Through
multiple intergovernmental agreements and service contracts, the City disposes of waste at the
Glendale Landfill, the Waste Management Deer Valley Transfer Station, and the Waste Management
Northwest Regional Landfill. Material collected from the recycling program is transported to the City
of Phoenix Municipal Recycling Facility (MRF) for sorting, baling, and marketing.
III.B. REVENUE REQUIREMENT
A revenue requirement analysis forms the basis for a long-range financial plan and multi-year rate
management strategy. The analysis is developed by completing an operating forecast that identifies
future annual operating costs and a capital funding plan that defines a strategy for funding the capital
improvement needs of the solid waste utility.
III.B.1. Operating Forecast
The purpose of the operating forecast is to determine whether the existing rates and charges are
sufficient to recover the costs the City incurs to operate and maintain the residential solid waste
program. The FY 2021 budget formed the baseline for this forecast. A long-term operating forecast
was developed for the FY 2022 through FY 2036 time period with the rate study focused on
establishing residential solid waste rates for the FY 2022 to FY 2026 rate-setting period. The
following list highlights some of the key assumptions used in the development of the residential solid
waste program operating forecast.
III.B.1.a Operating Revenue
⚫ Retail Rate Revenue was based on actual detailed customer accounts and usage statistics from the
City’s billing system for FY 2019. Billing data was then adjusted to reconcile to FY 2020
reported rate revenues.
⚫ Non-Rate Revenue consists of late fees, new service fees, special haul fees, interest earnings and
other miscellaneous service revenues. Representing only two percent of total utility revenues,
www.fcsgroup.comCity of Peoria, AZ February 2021
Solid Waste Utility Rate and Cost of Service Study page 10
these revenues are not expected to see significant changes in the future and were therefore
forecast with minimal to no increase. Interest earnings are projected forward based on a 1.50
investment earnings rate and available fund balances for each year.
⚫ Customer Growth was forecast at 2.25 percent annually from FY 2021 to FY 2036, based on
discussions with City staff and in alignment with internal building permit forecasting as well as
customer growth assumptions for the water and wastewater utility rate studies .
III.B.1.b O&M Expenses
⚫ General Cost Inflation was set at 2.00 percent based on feedback from City staff and in alignment
with internal City forecasting practices.
⚫ Construction Cost Inflation (CCI) was already included in the construction costs provided by the City,
no additional escalation was included.
⚫ Labor Cost Inflation was set at 3.50 percent for all years in the study period based on feedback from
the City.
⚫ Benefit Cost Inflation was set at 4.00 percent for all years in the study period based on feedback
from the City.
⚫ Fuel Cost Inflation was assumed to be 4.60 percent for all years in the study period based on the 25-
year annualized growth rate of west coast diesel fuel price as reported by the U.S. Energy
Information Administration.
⚫ Equipment Acquisition Inflation was assumed to be 3.86 percent for all years in the study period
based on projected equipment replacement costs forecasted in the City’s Solid Waste
Replacement Payment Schedule from FY 2022 to FY 2041.
⚫ General Fund Service Charge Inflation was assumed to be 3.00 percent for all years in the study
period based on feedback from City staff.
⚫ Tonnage Growth was set at 2.25 percent, in-line with customer growth forecasts, for all years in the
study period.
⚫ Material Disposal and Processing Cost Inflation: Cost increases based on contract terms from existing
disposal and recycling processing contracts as well as feedback from City staff.
» City of Glendale Landfill: Based on tipping fee schedule in the Intergovernmental Agreement
with the City of Glendale. The tipping fee per ton is expected to increase to $29 per ton in FY
2022 and $30 per ton in FY 2024. In FY 2020, Peoria received a $2.2 million Special
Investment Credit that is applied against tipping fees. The credit is forecast to expire in FY
2023. The current contract expires in FY 2025 – the tipping fee beyond FY 2025 is assumed
to increase at general inflation (2.00 percent).
» Waste Management Transfer & Disposal: Based on the City’s current contract with Waste
Management, the tipping fee is escalated by 2.00 percent annually until the contract expires
in FY 2023. Disposal expenses are escalated based on general inflation (2.00 percent) after
contract expiration.
» City of Phoenix Recycling Processing Fee: The processing fee is increased to $85.50 in FY 2022
and then 2.00 percent annually for all years thereafter based on feedback from City staff. The
current processing fee is $77 per ton. As part of the agreement, processing fees are currently
being offset by a $1.0 million special investment credit. This credit is projected to expire in
www.fcsgroup.comCity of Peoria, AZ February 2021
Solid Waste Utility Rate and Cost of Service Study page 11
January 2021, at which point the City will be paying the processing fee. The existing
agreement is scheduled to expire December 31st, 2023.
» Average Quarterly Outbound Blended Rate (AQOBR): Processing fees are offset each month by
revenue generated from the sale of recyclable commodities. The value of these
commodities is calculated based on the average quarterly outbound blended rate or
AQOBR. The AQOBR is defined as the average sales price per ton for all material sorted
and sold at the North Gateway MRF during a quarter. The City’s processing fee is
discounted by the AQOBR each month. For example, the January 2020 MRF processing
fee was $70.00 and the AQOBR for that month was $27.18, so the City’s net processing
fee to the City of Phoenix was $42.82 per ton. If the AQOBR exceeds the processing fee,
the City would receive 75.00 percent of the AQOBR above the processing fee. The
AQOBR is assumed at $34.59 per ton throughout the forecast based on feedback from
City staff.
⚫ Additional O&M Expenses - The operating forecast includes new FTEs, non-labor expenses, and
collection vehicles to respond to customer account growth. Estimates for new positions and
equipment were determined based on new customer accounts over the forecast and existing
collection route sizes for garbage and recycling service. Cost estimates detailed below are in
current dollars and are adjusted by inflation for each year of the forecast.
» One new equipment operator position in FY 2022, FY 2024, and FY 2026 (three total);
$73,000 per position inclusive of salaries and benefits.
» One new automated sideload truck in FY 2022, FY 2024, and FY 2026 (three total);
$330,000 per truck.
» One garbage and one recycling container for all new customer accounts; $60 per container.
» Maintenance, repair, replacement, and fuel expenses for new collection trucks
» Maintenance and Repair: $30,000 per collection truck annually
» Replacement Charge: $47,000 per collection truck annually
» Fuel: $16,000 per collection truck annually
III.B.1.c Debt Service
⚫ Existing Debt Service:
» The residential solid waste program does not carry any existing debt.
⚫ New Debt Service:
» The forecast includes $3.1 million in new debt issued in FY 2024 to support the replacement
of the City’s fleet maintenance shop. Debt service is based on a 20-year term at a 4.00
percent annual interest rate.
III.B.1.d Equipment Replacement Reserve Charges
⚫ Annual charges are based on the City’s equipment replacement reserve financial model. An nual
charges are projected to increase from $1.4 million in FY 2021 to $1.7 million in FY 2026.
III.B.2. Capital Funding Plan
The residential solid waste program is anticipating $17.9 million in capital costs from FY 2021
through FY 2026 (including escalation). The majority of plan expenditures support the utility’s
www.fcsgroup.comCity of Peoria, AZ February 2021
Solid Waste Utility Rate and Cost of Service Study page 12
equipment replacement program ($12.1 million). Other plan costs include new equipment ($1.8
million) and contributed funding for the City’s fleet shop replacement ($3.2 million).
Funding for the capital plan comes from the following sources:
⚫ Cash balances (including interest) and rate-funded capital: Cash balances and rate-funded capital
include the beginning capital fund balance and available cash flow after meeting the Principles of
Sound Financial Management (PSFM) reserve target. Rate-funded capital is forecast to fund 15
percent of the capital plan from FY 2021 to FY 2026 or $5.8 million.
⚫ Proceeds from Debt : Proceeds from City general obligation bonds total $3.1 million to support the
residential solid waste fund’s contribution for the replacement of the fleet maintenance shop.
Proceeds from debt are forecast to fund 17 percent of the FY 2021 to FY 2026 capit al plan.
⚫ Equipment Replacement Reserve Funding : Equipment replacement reserves are projected to fund 68
percent of the FY 2021 to FY 2026 capital plan or $12.1 million.
Exhibit 3.1 provides a summary of the funding sources for the capital expenditures. A detailed
capital plan can be found in the excel model provided to the City.
Exhibit 3.1
Residential Solid Waste Capital Funding Summary
Funding Summary FY 2021 FY 2022 FY 2023 FY 2024 FY 2025 FY 2026 Total
Total Capital Costs $ 3,132,584 $ 526,889 $ 2,079,118 $ 5,551,443 $ 2,799,195 $ 3,822,026 $ 17,911,254
Funding Sources
Cash Balances and Rate Funded Capital $ 252,584 $ 526,889 $ 668,038 $ 603,256 $ 175,685 $ 509,638 2,736,089
Equipment Replacement 2,880,000 - 1,411,080 1,848,187 2,623,510 3,312,388 12,075,165
GO Bond Proceeds - - - 3,100,000 - - 3,100,000
Total Capital Funding $ 3,132,584 $ 526,889 $ 2,079,118 $ 5,551,443 $ 2,799,195 $ 3,822,026 $ 17,911,254
III.B.3. Summary of Revenue Requirement
The operating forecast components for O&M expenses, debt service and rate-funded capital come
together to form the multi-year revenue requirement. The revenue requirement compares the overall
revenue available to the residential solid waste program to the expenses to evaluate the sufficiency of
rates on an annual basis. Exhibit 3.2 provides a summary of the residential solid waste revenue
requirement findings.
www.fcsgroup.comCity of Peoria, AZ February 2021
Solid Waste Utility Rate and Cost of Service Study page 13
Exhibit 3.2
Residential Solid Waste Program Revenue Requirement Summary
A summary of residential solid waste revenue requirement is listed below:
⚫ Revenues at current rate levels are projected to generate $12.4 million in FY 2021 compared to
$12.6 million in expenditures – resulting in a cash deficit of $0.2 million.
⚫ Annual operating expenses are projected to continue to outpace revenues over the rate -setting
period. By FY 2026, the annual cash deficit is projected to be $2.8 million.
» Landfill disposal expenses are forecast to increase from $1.3 million in FY 2021 to $2.2
million in FY 2026.
» Recycling processing expenses are forecast to increase from $0.4 million in FY 2021 to $1.1
million in FY 2026.
» All other cash operating expenses are forecast to increase from $11.1 million in FY 2021 to
$13.6 million in FY 2026.
» Equipment replacement expenses increase from $1.4 million in FY 2021 to $1.7 million
in FY 2026.
» Annual debt service for the fleet maintenance shop replacement is forecast at $0.2 million
beginning in FY 2024.
⚫ To meet the projected financial obligations of the residential solid waste program, rate increases
are proposed at 5.25 percent annually from FY 2022 to FY 2026. Annual rate adjustments are
assumed to be implemented mid-year in each fiscal year (January).
» Approximately $3.5 million in available financial reserves would be also leveraged over the
rate setting period to supplement annual rate adjustments.
Fund Balance and Financial Reserves
The City’s Principles of Sound Financial Management establish a financial reserve for the
Residential Solid Waste Fund equivalent to 20 percent of annual expenditures. Exhibit 3.3 shows a
summary of the projected ending fund balance through FY 2026 with the proposed rate revenue
adjustments. The fund balance is projected to remain above the financial reserve target for each year
of the forecast. The projected fund balance in FY 2026 is $3.4 million – equivalent to 20 percent of
annual expenditures.
www.fcsgroup.comCity of Peoria, AZ February 2021
Solid Waste Utility Rate and Cost of Service Study page 14
Exhibit 3.3
Operating Fund Balance and Reserve Target
III.B.4. Planning Level Cost Estimate for Green Waste Program
As part of the rate study, FCS Group evaluated the potential costs, rate impacts, and feasibility of a
residential green waste collection and mulching program. This new program would provide a new
collection service to residential customers for yard clippings, small branches, and prunings. This
analysis included research of green waste program design options, developing operating and capital
cost estimates, and calculating a monthly customer bill impact.
The assumptions, methodology, and results of this analysis are detailed below:
III.B.4.a Assumptions
⚫ Implementation Year : Assumed to begin service to customers in FY 2023 based on discussions with
City staff.
⚫ Accepted Material: Compostable yard clippings and prunings.
» It is estimated this material comprises approximately 5 percent of residential solid waste
tonnage or 3,000 tons annually (based on a 2014 waste characterization study conducted for
the City of Phoenix).
» The program would not collect large branches, grass clippings or food waste.
⚫ Collection Method : Semi-annual collection with rear-load refuse collection trucks and wheel
loaders (similar to current collection method for bulk trash). Residents would place loose piles of
green waste at curb for collection.
⚫ Material Capture Rate : Assumed at 50 percent of acceptable material or 1,500 tons annually. The
program’s capture rate may vary from this estimate based on the collection schedule.
⚫ Mulching Costs: Based on feedback from staff, there would be no processing costs to mulch
collected material. The City identified several sites that would not charge a tipping fee f or the
green waste.
www.fcsgroup.comCity of Peoria, AZ February 2021
Solid Waste Utility Rate and Cost of Service Study page 15
» If the City were to incur a tipping fee, the cost estimate for the green waste collection
program is expected to increase.
III.B.4.b Results
Exhibit 3.4 details the planning cost estimate for the green waste collection program for the rate -
setting period. Annual operating costs are estimated at $229,000 in FY 2023 and are expected to
increase to $252,000 by FY 2026. The one-time purchase of a new rear-load refuse collection would
be required in FY 2023.
If the City were to divert 50 percent of acceptable material through the new program, it would
decrease landfill tonnage by approximately 1,500 tons per year. Assuming that the City incurs no
processing fee to mulch the green waste, it is estimated that the City would decrease landfill tipping
fees by $40,000 annually.
A rate scenario was developed based on these planning cost estimates. Implementation of the green
waste collection program would add an additional $0.34 per month to the residential bill over the
next five years. City staff do not recommend implementing the green waste collection program at this
time.
Exhibit 3.4
Planning Cost Estimate for Green Waste Collection Program
FY 2022 FY 2023 FY 2024 FY 2025 FY 2026
Staffing $ - $ 168,116 $ 174,299 $ 180,710 $ 187,357
Equipment
Fuel $ - $ 15,953 $ 16,272 $ 16,598 $ 16,930
Maintenance - 21,962 22,401 22,849 23,306
Replacement - 23,033 23,493 23,963 24,443
Subtotal Equipment $ - $ 60,948 $ 62,167 $ 63,410 $ 64,678
Total Annual Operating $ - $ 229,063 $ 236,466 $ 244,120 $ 252,035
One-Time Equipment Acquisition $ - $ 212,787 $ - $ - $ -
Total $ - $ 441,850 $ 236,466 $ 244,120 $ 252,035
III.C. COST OF SERVICE
A cost of service analysis determines the equitable recovery of costs from customers according to
unique demands each customer class places on the system. There are three fundamental steps to
allocating the annual revenue requirement to customer classes and developing the final rates – 1)
allocate utility assets and total utility costs by function, 2) develop customer -specific allocation
factors and 3) allocate costs to customer classes. Generally, all residential customers receive the same
level of service and pay the same monthly rate. As a result, the cost of service analysis for the
residential solid waste fund only includes the first step: allocating the annual revenue requirement to
solid waste functions or activities. The methodology used conforms to industry standards as well as
principles established in the American Public Works Association Rate Setting and Financing Guide
for Solid Waste.
III.C.1. Defining Solid Waste Functions
The first step in the cost of service analysis is to allocate the revenue requirement f or the City’s
residential solid waste fund into several functions or activities. This allocation assigns costs to
www.fcsgroup.comCity of Peoria, AZ February 2021
Solid Waste Utility Rate and Cost of Service Study page 16
functional categories based on documented program requirements (e.g., weekly collection routes,
equipment maintenance records) and industry standard practice based on the relationship of each
function and the costs incurred by the utility. This cost “causation” provides the framework for the
cost of service analysis. The functions of service to which the revenue requirement was allocated are
discussed below.
⚫ Customer costs: associated with account management, billing, and customer service calls for solid
waste customers.
⚫ Refuse Collection costs : associated with the weekly collection of residential refuse carts, including
salaries, benefits, equipment maintenance, and fuel.
⚫ Recycling Collection costs: associated with the weekly collection of residential recycling carts,
including salaries, benefits, equipment maintenance, and fuel.
⚫ Bulk Trash costs: associated with the semi-annual collection of bulk trash piles including salaries,
benefits, equipment maintenance, and fuel.
⚫ Disposal costs: associated with the landfill tipping fees assessed to the City for the disposal of
municipal solid waste.
⚫ Recycling Processing costs: associated with the recycling processing fees assessed to the City for
the sorting, marketing, and sales of recyclables.
⚫ All Other costs. associated to activities not directly related to the functions described above (e.g.,
general administration).
III.C.2. Functional Allocation of Revenue Requirement
The second step of the cost of service analysis is to allocate the revenue requirement for the test year
(FY 2022) to each solid waste function. This process included assigning each budget line item
account in the test year to the solid waste functions. The following summarizes the key cost
allocation assumptions:
⚫ Recycling Department – All expenses are allocated 100 percent to Recycling Collection with
exception of general fund service charges.
» General fund service charges assessed to the fund are allocated 100 percent to Customer. In
discussions with City staff, these service charges were determined to support the City’s
billing, customer service, and account management functions.
⚫ Residential Collection Department – Expenses were allocated to several functions:
» Wages, benefits, and safety equipment/clothing were allocated based on the share of FTEs
that support Refuse Collection (89 percent) and Bulk Trash Collection (11 percent) in FY
2020.
» Fleet maintenance and replacement expenses were allocated based on the share of actual fleet
work order expenses for Refuse Collection (94 percent) and Bulk Trash Collection (6
percent) equipment in FY 2019.
» Fleet fuel expenses were allocated based on the share of actual fuel work order expenses for
Refuse Collection (92 percent) and Bulk Trash Collection (8 percent) equipment in FY 2019.
» Sanitation supplies and cart replacement supplemental funding were allocated based on the
share of weekly collection routes for Refuse Collection (54 percent) and Recycling
Collection (46 percent).
www.fcsgroup.comCity of Peoria, AZ February 2021
Solid Waste Utility Rate and Cost of Service Study page 17
» The department’s landfill services line-item accounts for all expenses related to refuse, bulk
trash, and recycling processing tipping fees. These expenses were allocated to the Disposal
(68 percent) and Recycling Processing (32 percent) functions based on:
» Actual share of refuse, bulk trash, and recycling tonnage sent to the disposal and material
recovery facilities in FY 2019;
» Projected tonnage increases in the test year (FY 2022);
» Projected tipping fee rates and other contract terms at each facility during the test year.
» General fund service charges were allocated 100 percent to Customer.
» Electricity, water, sewage, and IT service charges were allocated 100 percent to All Other.
⚫ Solid Waste Admin Department – All expenses allocated 100 percent to All Other with exception of
general fund service charges which were allocated 100 percent to Customer.
⚫ Solid Waste Environmental Department – All expenses allocated 90 percent to Recycling Collection
and 10 percent to Refuse Collection based on City feedback with the following exceptions:
» General fund service charges were allocated 100 percent to Customer.
» Recycling/Environ Services were allocated 100 percent to Disposal.
⚫ Other Allocations -- The remaining elements of the revenue requirement were allocated as:
» Salary and benefits for new equipment operator positions were allocated based on the share
of weekly collection routes for Refuse Collection (54 percent) and Recycling Collection (46
percent).
» Fuel, maintenance, and replacement expenses for new equipment were allocated based on the
share of weekly collection routes for Refuse Collection (54 percent) and Recycling
Collection (46 percent).
» Non-rate revenues are allocated based on the share of total expenses assigned to each
function.
» Net cash flow as well as the revenue impact of mid-year rate adjustments in the test year are
allocated based on the share of total expenses assigned to each function.
Exhibit 3.5 summarizes the functional allocation of the revenue requirement. Refuse collection
accounts for the largest share of the revenue requirement at $5.4 million or approximately 4 0 percent.
The cost of service for recycling collection is $3.5 million or 26 percent. Bulk trash collection is $0.5
million. Disposal and recycling processing expenses total $1.7 million and $0. 9 million respectively.
Customer-related expenses total $1.4 million.
www.fcsgroup.comCity of Peoria, AZ February 2021
Solid Waste Utility Rate and Cost of Service Study page 18
Exhibit 3.5
Functional Allocation of Test Year Revenue Requirement
Less: Plus: Total
Operating
Non-Rate Net Cash Revenue As a Percent
Expenses
Revenues Flow Requirement
Customer $ 1,534,188 (34,327) $ (50,481) $ 1,449,380 10.8%
Refuse Collection 5,709,286 (127,742) (187,860) 5,393,684 40.3%
Recycling Collection 3,660,015 (81,891) (120,430) 3,457,694 25.8%
Bulk Trash Collection 494,963 (11,075) (16,286) 467,602 3.5%
Disposal 1,834,732 (41,051) (60,370) 1,733,310 13.0%
Recycling Processing 932,969 (20,875) (30,699) 881,395 6.6%
Total $ 14,166,152 $ (316,960) $ (466,126) $ 13,383,066 100.0%
III.D. RATE DESIGN
The principal objective of the rate design stage of the study is to implement rate structures that
collect the appropriate level of revenue and achieve the utility’s other financial, strategic, and policy
goals.
III.D.1. Existing Rates
The existing residential solid waste rate structure is composed of a fixed monthly charge of $16.21.
Customers can subscribe for additional weekly refuse collection service for an additional $1 3.28 per
month.
III.D.2. Proposed Rates
The proposed rate revenue adjustments described in Section III.B.3 (Summary of Revenue
Requirement) would be assessed to the monthly fixed charge and the optional monthly charge for
additional refuse collection. The proposed rates for residential solid waste service over the rate -
setting period are summarized in Exhibit 3.6.
The rate schedule also includes rates for other services, including 90-gallon commercial solid waste
collection. The City provides limited commercial service for non-residential customers along its
residential collection routes. These customers are provided a 90-gallon garbage container with the
option of receiving service one to five times per week.
www.fcsgroup.comCity of Peoria, AZ February 2021
Solid Waste Utility Rate and Cost of Service Study page 19
Exhibit 3.6
Proposed Residential Solid Waste Rates
Rates FY2021 FY2022 FY2023 FY2024 FY2025 FY2026
Overall Rate Revenue Increase 5.25% 5.25% 5.25% 5.25% 5.25%
Solid Waste Collection
Standard Service $ 16.21 $ 17.06 $ 17.96 $ 18.90 $ 19.89 $ 20.93
Additional Refuse Container 13.28 13.98 14.71 15.48 16.29 17.15
Additional Services
Replacement Barrel 67.20 70.73 74.44 78.35 82.46 86.79
Special Haul Service (first 30 minutes) 50.00 50.00 50.00 50.00 50.00 50.00
Special Haul Service (extra equipment charge) 50.00 50.00 50.00 50.00 50.00 50.00
Side-Load Commercial Service
90 Gallon Barrel - 1 time per week 16.29 17.15 18.05 19.00 20.00 21.05
90 Gallon Barrel - 2 times per week 32.57 34.30 36.10 38.00 40.00 42.10
90 Gallon Barrel - 3 times per week 48.87 51.45 54.15 57.00 60.00 63.15
90 Gallon Barrel - 4 times per week 65.16 68.60 72.20 76.00 80.00 84.20
90 Gallon Barrel - 5 times per week 81.44 85.75 90.25 95.00 100.00 105.25
www.fcsgroup.comCity of Peoria, AZ February 2021
Solid Waste Utility Rate and Cost of Service Study page 20
Section IV. COMMERCIAL SOLID WASTE
UTILITY
IV.A. INTRODUCTION
The City’s commercial solid waste program provides front load trash & recycling, front load
compactor and roll off solid waste collection services to approximately 600 commercial customers.
In FY 2019, the City’s commercial solid waste program collected nearly 20,000 tons of municipal
solid waste (MSW) and nearly 1,000 tons of recycling. Peoria offers a flexible level of service for its
commercial customers, providing front load trash services from one to seven days each week with
various container sizes to suit customer needs. The commercial program operates a fleet of 10
vehicles that are owned and maintained by the City. The commercial solid waste program also makes
use of the intergovernmental agreements and service contracts with the City of Glendale, the City of
Phoenix, and Waste Management to dispose of and process MSW.
IV.B. REVENUE REQUIREMENT
Similar to the residential solid waste program, a revenue requirement was completed for the
commercial solid waste program and forms the basis for the long-range financial plan and multi-year
financial management strategy.
IV.B.1. Operating Forecast
The purpose of the operating forecast is to determine whether the existing rates and charges are
sufficient to recover the costs the City incurs to operate and maintain the commercial solid waste
program. The FY 2021 budget formed the baseline for this forecast. A long-term operating forecast
was developed for the FY 2022 through FY 2036 time period with the rate study focused on
establishing residential solid waste rates for the FY 2022 to FY 2026 rate-setting period. The
following list highlights some of the key assumptions used in the development of the operating
forecast.
IV.B.1.a Operating Revenue
⚫ Retail Rate Revenue was based on actual detailed customer accounts and usage statistics from the
City’s billing system for FY 2019. Billing data was then adjusted to reconcile to FY 2020
reported rate revenues.
⚫ Non-Rate Revenue consists of other operating revenues and interest earnings. Representing only
one percent of total utility revenues, these revenues are not expected to see significant changes in
the future and were therefore forecast with minimal to no increase. Interest earnings are projected
forward based on a 1.50 investment earnings rate and available fund balances for each year
⚫ Customer Growth no account growth is forecast during the study period based on discussions with
City staff.
www.fcsgroup.comCity of Peoria, AZ February 2021
Solid Waste Utility Rate and Cost of Service Study page 21
IV.B.1.b O&M Expenses
⚫ General Cost Inflation was set at 2.00 percent based on feedback from City staff and in alignment
with internal forecasting practices.
⚫ Construction Cost Inflation (CCI) was factored into the construction costs provided by the City, no
additional escalation was included.
⚫ Labor Cost Inflation was set at 3.50 percent for all years in the study period based on feedback from
the City.
⚫ Benefit Cost Inflation was set at 4.00 for all years in the study period based on feedback from the
City.
⚫ Fuel Cost Inflation was assumed to be 4.60 percent for all years in the study period based on the 25-
year annualized growth rate of west coast diesel fuel price as reported by the U.S. Energy
Information Administration.
⚫ Equipment Acquisition Inflation was assumed to be 3.86 percent for all years in the study period
based on projected equipment replacement costs forecasted in the City’s Solid Waste
Replacement Payment Schedule from FY 2022 to FY 2041.
⚫ General Fund Service Charge Inflation was assumed to be 3.00 percent for all years in the study
period based on feedback from City staff.
⚫ Tonnage Growth was set at 1.00 percent based on feedback from City staff.
⚫ Material Disposal and Processing Cost Inflation: Cost increases based on contract terms from existing
disposal and recycling processing contracts as well as feedback from City staff.
» City of Glendale Landfill: Based on tipping fee schedule in the Intergovernmental Agreement
with the City of Glendale. The tipping fee per ton is expected to increase to $29 per ton in FY
2022 and $30 per ton in FY 2024. The current contract expires in FY 2025 – the tipping fee
beyond FY 2025 is assumed to increase at general inflation (2.00 percent).
» Waste Management Transfer & Disposal: Based on the City’s current contract with Waste
Management, the tipping fee is escalated by 2.00 percent annually until the contract expires
in FY 2023. Disposal expenses are escalated based on general inflation (2.00 percent) after
contract expiration.
» City of Phoenix Recycling Processing Fee: The processing fee is increased to $85.50 in FY 2022
and then 2.00 percent annually for all years thereafter based on feedback from City staff. The
current processing fee is $77 per ton. The existing agreement is scheduled to expire
December 31st, 2023.
» Average Quarterly Outbound Blended Rate (AQOBR): Processing fees are offset each month by
revenue generated from the sale of recyclable commodities. The value of these
commodities is calculated based on the average quarterly outbound blended rate or
AQOBR. The AQOBR is defined as the average sales price per ton for all material sorted
and sold at the North Gateway MRF during a quarter. The City’s processing fee is
discounted by the AQOBR each month. For example, the January 2020 MRF processing
fee was $70.00 and the AQOBR for that month was $27.18, so the City’s net processing
fee to the City of Phoenix was $42.82 per ton. If the AQOBR exceeds the processing fee,
the City would receive 75.00 percent of the AQOBR above the processing fee. The
AQOBR is assumed at $34.59 per ton throughout the forecast based on feedback from
City staff.
www.fcsgroup.comYou can also read