CityFlow: A City-Scale Benchmark for Multi-Target Multi-Camera Vehicle Tracking and Re-Identification
←
→
Page content transcription
If your browser does not render page correctly, please read the page content below
CityFlow: A City-Scale Benchmark for Multi-Target
                                                                 Multi-Camera Vehicle Tracking and Re-Identification

                                                                    ∗
                                                   Zheng Tang1 Milind Naphade2 Ming-Yu Liu2 Xiaodong Yang2 Stan Birchfield2
                                                         Shuo Wang2 Ratnesh Kumar2 David Anastasiu3 Jenq-Neng Hwang1
                                                            1
                                                              University of Washington 2 NVIDIA 3 San Jose State University
arXiv:1903.09254v4 [cs.CV] 5 Apr 2019

                                                                     Abstract

                                            Urban traffic optimization using traffic cameras as sen-
                                        sors is driving the need to advance state-of-the-art multi-
                                        target multi-camera (MTMC) tracking. This work intro-
                                        duces CityFlow, a city-scale traffic camera dataset con-
                                        sisting of more than 3 hours of synchronized HD videos
                                        from 40 cameras across 10 intersections, with the longest
                                        distance between two simultaneous cameras being 2.5 km.              Figure 1. MTMC tracking combines MTSC tracking, image-based
                                        To the best of our knowledge, CityFlow is the largest-scale          ReID, and spatio-temporal information. The colored curves in
                                        dataset in terms of spatial coverage and the number of cam-          Camera #1 and Camera #2 are trajectories from MTSC tracking
                                        eras/videos in an urban environment. The dataset contains            to be linked across cameras by visual-spatio-temporal association.
                                        more than 200K annotated bounding boxes covering a wide
                                        range of scenes, viewing angles, vehicle models, and ur-
                                        ban traffic flow conditions. Camera geometry and calibra-            this goal, one has to address three distinct but closely re-
                                        tion information are provided to aid spatio-temporal anal-           lated research problems: 1) Detection and tracking of tar-
                                        ysis. In addition, a subset of the benchmark is made avail-          gets within a single camera, known as multi-target single-
                                        able for the task of image-based vehicle re-identification           camera (MTSC) tracking; 2) Re-identification of targets
                                        (ReID). We conducted an extensive experimental evaluation            across multiple cameras, known as ReID; and 3) Detection
                                        of baselines/state-of-the-art approaches in MTMC tracking,           and tracking of targets across a network of cameras, known
                                        multi-target single-camera (MTSC) tracking, object detec-            as multi-target multi-camera (MTMC) tracking. MTMC
                                        tion, and image-based ReID on this dataset, analyzing the            tracking can be regarded as the combination of MTSC
                                        impact of different network architectures, loss functions,           tracking within cameras and image-based ReID with spatio-
                                        spatio-temporal models and their combinations on task ef-            temporal information to connect target trajectories between
                                        fectiveness. An evaluation server is launched with the re-           cameras, as illustrated in Fig. 1.
                                        lease of our benchmark at the 2019 AI City Challenge that                Much attention has been paid in recent years to the prob-
                                        allows researchers to compare the performance of their               lem of person-based ReID and MTMC tracking [58, 34, 61,
                                        newest techniques. We expect this dataset to catalyze re-            46, 22, 21, 11, 14, 8, 57, 34, 50, 7, 60]. There have also
                                        search in this field, propel the state-of-the-art forward, and       been some works on providing datasets for vehicle-based
                                        lead to deployed traffic optimization(s) in the real world.          ReID [28, 26, 52]. Although the state-of-the-art perfor-
                                                                                                             mance on these latter datasets has been improved by recent
                                                                                                             approaches, accuracy in this task still falls short compared
                                        1. Introduction                                                      to that in person ReID. The two main challenges in vehicle
                                                                                                             ReID are small inter-class variability and large intra-class
                                            The opportunity for cities to use traffic cameras as city-
                                                                                                             variability, i.e., the variety of shapes from different viewing
                                        wide sensors in optimizing flows and managing disruptions
                                                                                                             angles is often greater than the similarity of car models pro-
                                        is immense. Where we are lacking is our ability to track
                                                                                                             duced by various manufacturers [10]. We note that, in or-
                                        vehicles over large areas that span multiple cameras at dif-
                                                                                                             der to preserve the privacy of drivers, captured license plate
                                        ferent intersections in all weather conditions. To achieve
                                                                                                             information—which otherwise would be extremely useful
                                          ∗ Work   done during an internship at NVIDIA.                      for vehicle ReID—should not be used [2].

                                                                                                         1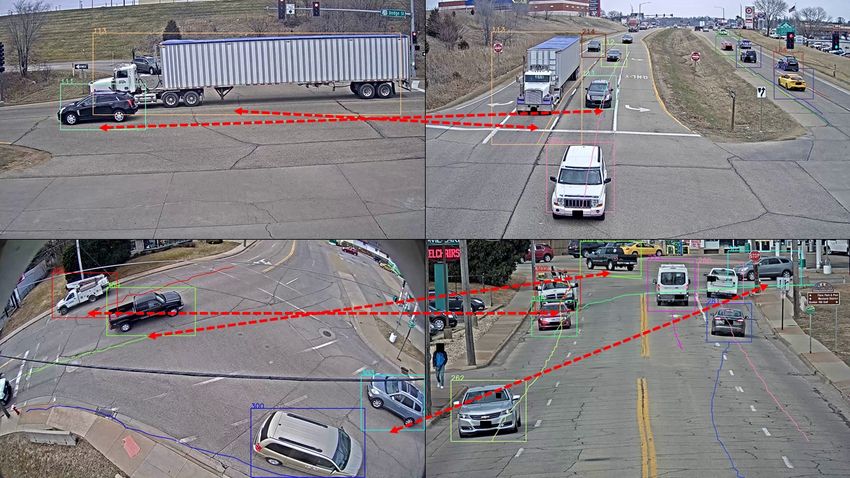
fully labeled, and the homography matrices that relate pixel
                                                                         locations to GPS coordinates are available to enable precise
                                                                         spatial localization. Similar to the person-based MTMC
                                                                         tracking benchmarks [57, 34, 50], we also provide a sub-
                                                                         set of the dataset for image-based vehicle ReID. In this pa-
                                                                         per, we describe our benchmark along with extensive exper-
                                                                         iments with many baselines/state-of-the-art approaches in
                                                                         image-based ReID, object detection, MTSC tracking, and
                                                                         MTMC tracking. To further advance the state-of-the-art in
                                                                         both ReID and MTMC tracking, an evaluation server is also
                                                                         released to the research community.

                                                                         2. Related benchmarks
                                                                             The popular publicly available benchmarks for the evalu-
                                                                         ation of person and vehicle ReID are summarized in Tab. 1.
Figure 2. The urban environment and camera distribution of the           This table is split into blocks of image-based person ReID,
proposed dataset. The red arrows denote the locations and direc-         video-based MTMC human tracking, image-based vehicle
tions of cameras. Some examples of camera views are shown.
                                                                         ReID, and video-based MTMC vehicle tracking.
Note that, different from other vehicle ReID benchmarks, the orig-
inal videos and calibration information will be available.
                                                                             The most popular benchmarks to date for image-based
                                                                         person ReID are Market1501 [58], CUHK03 [22] and
                                                                         DukeMTMC-reID [34, 61]. Small-scale benchmarks, such
    A major limitation of existing benchmarks for object                 as CUHK01 [21], VIPeR [11], PRID [14] and CAVIAR [8],
ReID (whether for people or vehicles) is the limited spa-                provide test sets only for evaluation. Recently, Zheng et
tial coverage and small number of cameras used—this is a                 al. released a benchmark with the largest scale to date,
disconnect from the city-scale deployment level they need                MSMT17 [61]. Most state-of-the-art approaches on these
to operate at. In the two person-based benchmarks that                   benchmarks exploit metric learning to classify object iden-
have camera geometry available, DukeMTMC [34, 50] and                    tities, where common loss functions include hard triplet
NLPR MCT [7], the cameras span less than 300 × 300 m2 ,                  loss [13], cross entropy loss [40], center loss [48], etc. How-
with only 6 and 8 views, respectively. The vehicle-based                 ever, due to the relatively small number of cameras in these
ReID benchmarks, such as VeRi-776 [28], VehicleID [26],                  scenarios, the domain gaps between datasets cannot be ne-
and PKU-VD [52], do not provide the original videos or                   glected, so transfer learning for domain adaptation has at-
camera calibration information. Rather, such datasets as-                tracted increasing attention [45].
sume that MTSC tracking is perfect, i.e., image signatures                   On the other hand, the computation of deep learning fea-
are grouped by correct identities within each camera, which              tures is costly, and thus spatio-temporal reasoning using
is not reflective of real tracking systems. Moreover, in the             video-level information is key to applications in the real
latter datasets [26, 52], only the front and back views of the           world. The datasets Market1501 [58] and DukeMTMC-
vehicles are available, thus limiting the variability due to             reID [34, 61] both have counterparts in video-based ReID,
viewpoint. None of these existing benchmarks for vehicle                 which are MARS [57] and DukeMTMC [34, 50], respec-
ReID facilitate research in MTMC vehicle tracking.                       tively. Though the trajectory information is available in
    In this paper, we present a new benchmark—called                     MARS [57], the original videos and camera geometry
CityFlow—for city-scale MTMC vehicle tracking, which                     are unknown to the public, and thus the trajectories can-
is described in Fig. 2. To our knowledge, this is the first              not be associated using spatio-temporal knowledge. Both
benchmark at city scale for MTMC tracking in terms of the                DukeMTMC [34, 50] and NLPR MCT [7], however, pro-
number of cameras, the nature of the synchronized high-                  vide camera network topologies so that the links among
quality videos, and the large spatial expanse captured by the            cameras can be established. These scenarios are more re-
dataset. In contrast to the previous benchmarks, CityFlow                alistic but very challenging, as they require the joint efforts
contains the largest number of cameras (40) from a large                 of visual-spatio-temporal reasoning. Nonetheless, as people
number of intersections (10) in a mid-sized U.S. city, and               usually move at slow speeds and the gaps between camera
covering a variety of scenes such as city streets, residential           views are small, their association in the spatio-temporal do-
areas, and highways. Traffic videos at intersections present             main is relatively easy.
complex challenges as well as significant opportunities for                  VeRi-776 [28] has been the most widely used benchmark
video analysis, going beyond traffic flow optimization to                for vehicle ReID, because of the high quality of annota-
pedestrian safety. Over 200K bounding boxes were care-                   tions and the availability of camera geometry. However, the

                                                                     2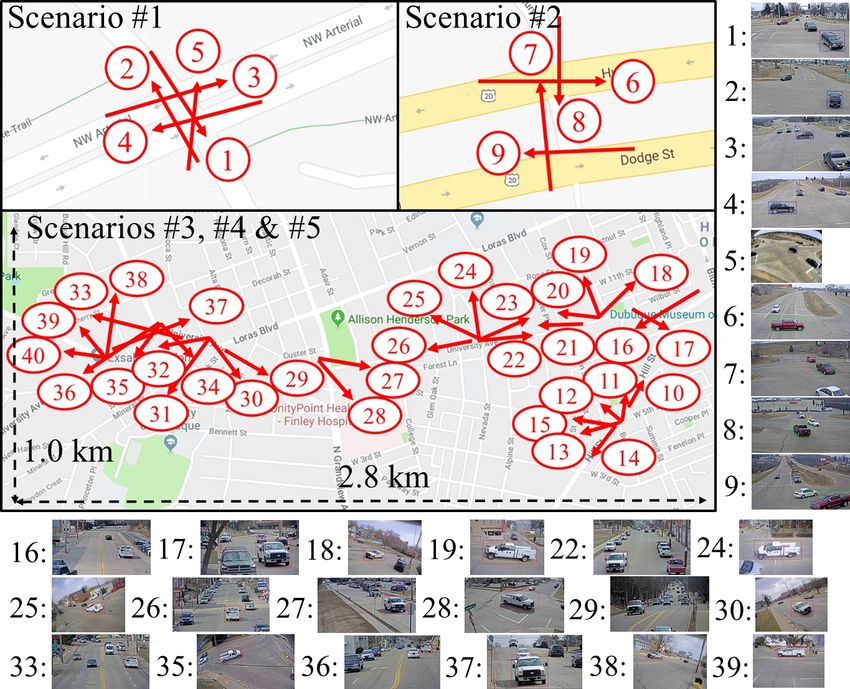
Benchmark                # cameras        # boxes    # boxes/ID     Video     Geom.      Multiview
                          Market1501 [58]                  6           32,668          30.8          7         7           X
                      DukeMTMC-reID [34, 61]               8           36,411          20.1          7         7           X
                           MSMT17 [45]                     15          126,441         21.8          7         7           X
                           CUHK03 [22]                      2           13,164         19.3          7         7           7
               ReID
                           CUHK01 [21]                      2            3,884          4.0          7         7           7
    person

                            VIPeR [11]                     2            1,264           2.0          7         7           7
                            PRID [14]                      2            1,134           1.2          7         7           7
                           CAVIAR [8]                      2              610           8.5          7         7           7
                             MARS [57]                     6           1,191,003      944.5          7         7           X
               MTMC      DukeMTMC [34, 50]                  8          4,077,132      571.2          X         X           X
                           NLPR MCT [7]                    12            36,411       65.8           X         X           X
                            VeRi-776 [28]                  20           49,357         63.6          7         X           X
                            VehicleID [26]                 2           221,763          8.4          7         7           7
     vehicle

               ReID
                            PKU-VD1 [52]                    -          846,358         6.0           7         7           7
                            PKU-VD2 [52]                    -          807,260         10.1          7         7           7
               MTMC     CityFlow (proposed)                40          229,680        344.9          X         X           X

Table 1. Publicly available benchmarks for person/vehicle image-signature-based re-identification (ReID) and video-based tracking across
cameras (MTMC). For each benchmark, the table shows the number of cameras, annotated bounding boxes, and average bounding boxes
per identity, as well as the availability of original videos, camera geometry, and multiple viewing angles.

dataset does not provide the original videos and calibration            erage and diverse scenes and traffic conditions, it is the
information for MTMC tracking purposes. Furthermore,                    first benchmark that enables city-scale video analytics. The
the dataset only contains scenes from a city highway, so the            benchmark also provides the first public dataset supporting
variation between viewpoints is rather limited. Last but not            MTMC tracking of vehicles.
least, they implicitly make the assumption that MTSC track-                 The dataset is divided into 5 scenarios, summarized in
ing works perfectly. As for the other benchmarks [26, 52],              Tab. 2. In total, there are 229,680 bounding boxes of 666
they are designed for image-level comparison with front and             vehicle identities annotated, where each passes through at
back views only. Since many vehicles share the same mod-                least 2 cameras. The distribution of vehicle types and col-
els and different vehicle models can look highly similar, the           ors in CityFlow is displayed Fig. 3. The resolution of
solution in vehicle ReID should not rely on appearance fea-             each video is at least 960p and the majority of the videos
tures only. It is important to leverage the spatio-temporal             have a frame rate of 10 FPS. Additionally, in each sce-
information to address the city-scale problem properly. The             nario, the offset of starting time for each video is avail-
research community is in urgent need for a benchmark en-                able, which can be used for synchronization. For privacy
abling MTMC vehicle tracking analysis.                                  concerns, license plates and human faces detected by Deep-
                                                                        Stream [1] have been redacted and manually refined in all
3. CityFlow benchmark                                                   videos. CityFlow also shows other challenges not present in
                                                                        the person-based MTMC tracking benchmarks [34, 50, 7].
   In this section, we detail the statistics of the proposed            Cameras at the same intersection sometimes share overlap-
benchmark. We also explain how the data were collected                  ping field of views (FOVs) and some cameras use fish-
and annotated, as well as how we evaluated our baselines.               eye lens, leading to strong radial distortion of their cap-
                                                                        tured footage. Besides, because of the relatively fast vehicle
3.1. Dataset overview                                                   speed, motion blur may lead to failures in object detection
   The proposed dataset contains 3.25 hours of videos col-              and data association. Fig. 4 shows an example of our anno-
lected from 40 cameras spanning across 10 intersections in              tations in the benchmark. The dataset will be expanded to
a mid-sized U.S. city. The distance between the two fur-                include more data in diverse conditions in the near future.
thest simultaneous cameras is 2.5 km, which is the longest
                                                                        3.2. Data annotation
among all the existing benchmarks. The dataset covers a di-
verse set of location types, including intersections, stretches            To efficiently label tracks of vehicles across multi-
of roadways, and highways. With the largest spatial cov-                ple cameras, a trajectory-level annotation scheme was

                                                                   3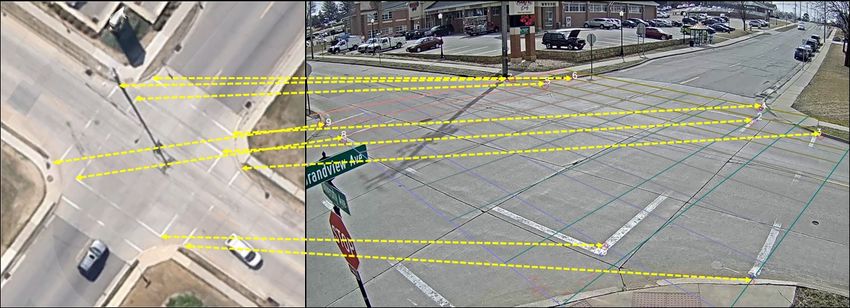
Time (min.)   # cam.   # boxes   # IDs   Scene type    LOS
 1          17.13        5       20,772    95      highway       A
 2          13.52        4       20,956   145      highway       B
 3          23.33        6        6,174    18     residential    A
 4          17.97       25       17,302    71     residential    A
 5         123.08       19      164,476   337     residential    B
 total     195.03       40      229,680   666

Table 2. The 5 scenarios in the proposed dataset, showing the total
time, numbers of cameras (some are shared between scenarios),
bounding boxes, and identities, as well as the scene type (highways
or residential areas/city streets), and traffic flow (using the North
American standard for level of service (LOS) [37]). Scenarios 1,            Figure 3. The distribution of vehicle colors and types in terms of
3, and 4 are used for training, whereas 2 and 5 are for testing.            vehicle identities in CityFlow.

employed. First, we followed the tracking-by-detection                      3.4. Evaluation server
paradigm and generated noisy trajectories in all videos us-                    An online evaluation server is launched with the release
ing the state-of-the-art methods in object detection [32] and               of our benchmark at the 2019 AI City Challenge. This al-
MTSC tracking [43]. The detection and tracking errors, in-                  lows for continuous evaluation and year-round submission
cluding misaligned bounding boxes, false negatives, false                   of results against the benchmark. A leader board is pre-
positives and identity switches, were then manually cor-                    sented ranking the performances of all submitted results. A
rected. Finally, we manually associated trajectories across                 common evaluation methodology based on the same ground
cameras using spatio-temporal cues.                                         truths ensures fair comparison. Besides, the state-of-the-art
    The camera geometry of each scenario is available with                  can be conveniently referred to by the research community.
the dataset. We also provide the camera homography ma-
trices between the 2D image plane and the ground plane                      3.5. Experimental setup and evaluation metrics
defined by GPS coordinates based on the flat-earth approx-
                                                                                For the evaluation of image-based ReID, the results are
imation. The demonstration of camera calibration is shown
                                                                            represented by a matrix mapping each query to the test
in Fig. 5, which estimates the homography matrix based on
                                                                            images ranked by distance. Following [58], two metrics
the correspondence between a set of 3D points and their
                                                                            are used to evaluate the accuracy of algorithms: mean Av-
2D pixel locations. First, 5 to 14 landmark points were
                                                                            erage Precision (mAP), which measures the mean of all
manually selected in a sampled frame image from each
                                                                            queries’ average precision (the area under the Precision-
video. Then, the corresponding GPS coordinates in the
                                                                            Recall curve), and the rank-K hit rate, denoting the possi-
real world were derived from Google Maps [3]. The ob-
                                                                            bility that at least one true positive is ranked within the top
jective cost function in this problem is the reprojection er-
                                                                            K positions. In our evaluation server, due to limited storage
ror in pixels, where the targeted homography matrix has 8
                                                                            space, the mAP measured by the top 100 matches for each
degrees of freedom. This optimization problem can be ef-
                                                                            query is adopted for comparison. More details are provided
fectively solved by methods like least median of squares
                                                                            in the supplementary material.
and RANSAC. In our benchmark, the converged reprojec-
                                                                                As for the evaluation of MTMC tracking, we adopted
tion error was 11.52 pixels on average, caused by the lim-
                                                                            the metrics used by the MOTChallenge [5, 24] and
ited precision of Google Maps. When a camera is under
                                                                            DukeMTMC [34] benchmarks. The key measurements
radial distortion, it is first manually corrected by straighten-
                                                                            include the Multiple Object Tracking Accuracy (MOTA),
ing curved traffic lane lines before camera calibration.
                                                                            Multiple Object Tracking Precision (MOTP), ID F1 score
3.3. Subset for image-based ReID                                            (IDF1), mostly tracked targets (MT) and false alarm rate
                                                                            (FAR). MOTA computes the accuracy considering three er-
    A sampled subset from CityFlow, noted as CityFlow-                      ror sources: false positives, false negatives/missed targets
ReID, is dedicated for the task of image-based ReID.                        and identity switches. On the other hand, MOTP takes
CityFlow-ReID contains 56,277 bounding boxes in total,                      into account the misalignment between the annotated and
where 36,935 of them from 333 object identities form the                    the predicted bounding boxes. IDF1 measures the ratio
training set, and the test set consists of 18,290 bounding                  of correctly identified detections over the average num-
boxes from the other 333 identities. The rest of the 1,052                  ber of ground-truth and computed detections. Compared
images are the queries. On average, each vehicle has 84.50                  to MOTA, IDF1 helps resolve the ambiguity among error
image signatures from 4.55 camera views.                                    sources. MT is the ratio of ground-truth trajectories that are

                                                                        4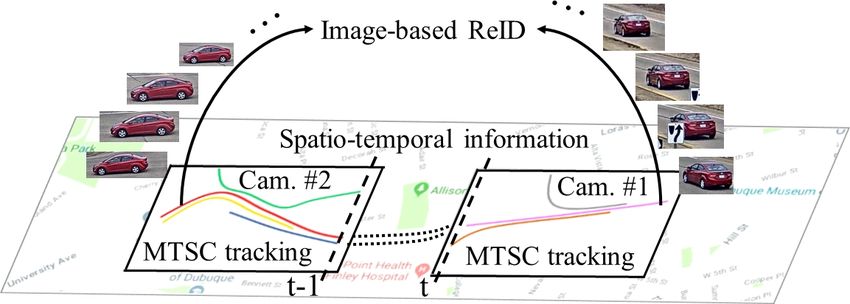
Figure 5. Camera calibration, including manually selecting land-
                                                                        mark points in the perspective image (right) and the top-down map
                                                                        view with GPS coordinates (left). The yellow dashed lines indi-
                                                                        cate the association between landmark points, whereas thin col-
Figure 4. Annotations on CityFlow, with red dashed lines indicat-       ored solid lines show a ground plane grid projected onto the image
ing associations of object identities across camera views.              using the estimated homography.

covered by track hypotheses for at least 80% of their respec-           1,024-dimension CNN features from a GoogLeNet [39]
tive life span. Finally, FAR measures the average number of             pre-trained on the CompCars benchmark [53]. Without
false alarms per image frame.                                           metric learning, the Bhattacharyya norm is used to compute
                                                                        the distance between pairs of feature vectors. In our exper-
4. Evaluated baselines                                                  iments, we also explored the use of the L2 norm, L1 norm
                                                                        and L∞ norm for proximity computations.
   This section describes the state-of-the-art baseline sys-
tems that we evaluated using the CityFlow benchmark.
                                                                        4.2. Single-camera tracking and object detection
4.1. Image-based ReID                                                       Most state-of-the-art MTSC tracking methods follow the
    For the person ReID problem, the state-of-the-art apply             tracking-by-detection paradigm. In our experiments, we
metric learning with different loss functions, such as hard             first generate detected bounding boxes using well-known
triplet loss (Htri) [13], cross entropy loss (Xent) [40], cen-          methods such as YOLOv3 [32], SSD512 [27] and Faster
ter loss (Cent) [48], and their combination to train clas-              R-CNN [33]. For all detectors, we use default models pre-
sifiers [62]. In our experiments, we compared the per-                  trained on the COCO benchmark [25], where the classes of
formance of various convolutional neural network (CNN)                  interest include car, truck and bus. We also use the same
models [12, 54, 16, 51, 17, 38, 36], which are all trained              threshold for detection scores across all methods (0.2).
using the same learning rate (3e-4), number of epochs (60),                 Offline methods in MTSC tracking usually lead to bet-
batch size (32), and optimizer (Adam). All the trained mod-             ter performance, as all the aggregated tracklets can be used
els fully converge under these hyper-parameter settings.                for data association. Online approaches often leverage ro-
The generated feature dimension is between 960 and 3,072.               bust appearance features to compensate for not having in-
    For the vehicle ReID problem, the recent work [18] ex-              formation about the future. We experimented with both
plores the advances in batch-based sampling for triplet em-             types of methods in CityFlow, which are introduced as fol-
bedding that are used for state-of-the-art in person ReID               lows. DeepSORT [49] is an online method that combines
solutions. They compared different sampling variants and                deep learning features with Kalman-filter-based tracking
demonstrated state-of-the-art results on all vehicle ReID               and the Hungarian algorithm for data association, achiev-
benchmarks [28, 26, 52], outperforming multi-view-based                 ing remarkable performance on the MOTChallenge MOT16
embedding and most spatio-temporal regularizations (see                 benchmark [30]. TC [43] is an offline method that won the
Tab. 7). Chosen sampling variants include batch all (BA),               traffic flow analysis task in the AI City Challenge Workshop
batch hard (BH), batch sample (BS) and batch weighted                   at CVPR 2018 [31] by applying tracklet clustering through
(BW), adopted from [13, 35]. The implementation uses                    optimizing a weighted combination of cost functions, in-
MobileNetV1 [15] as the backbone neural network architec-               cluding smoothness loss, velocity change loss, time interval
ture, setting the feature vector dimension to 128, the learn-           loss and appearance change loss. Finally, MOANA [42, 41]
ing rate to 3e-4, and the batch size to 18 × 4.                         is another online method that achieves state-of-the-art per-
    Another state-of-the-art vehicle ReID method [43] is the            formance on the MOTChallenge 2015 3D benchmark [19],
winner of the vehicle ReID track in the AI City Challenge               employing similar schemes for spatio-temporal data asso-
Workshop at CVPR 2018 [31], which is based on fusing                    ciation, but using an adaptive appearance model to resolve
visual and semantic features (FVS). This method extracts                occlusion and grouping of objects.

                                                                    5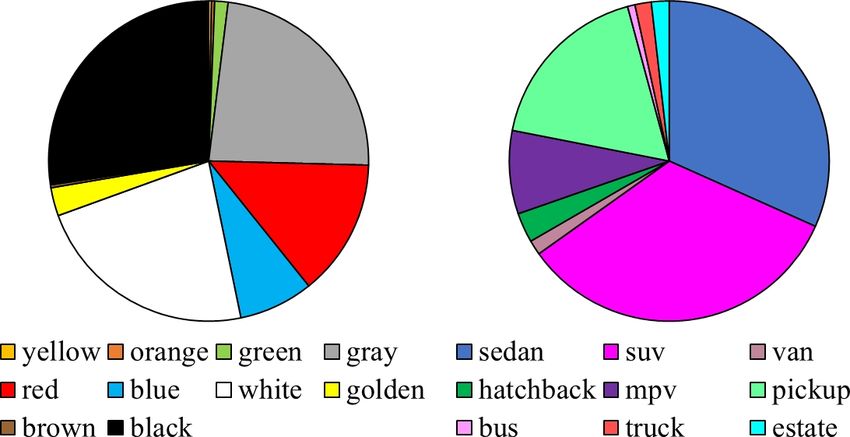
Norm mAP Rank-1 Rank-5 Rank-10
Bhattacharyya 6.3% 20.8% 24.5% 27.9%
L2 5.9% 20.4% 24.9% 27.9%
L1 6.2% 20.3% 24.8% 27.8%
L∞ 3.2% 17.0% 23.6% 27.6%
Table 3. Performance of CNN features extracted from a leading
vehicle ReID method, FVS [43], compared using various metrics,
on our CityFlow-ReID benchmark.
Figure 6. CMCs of image-based ReID methods on CityFlow-
ReID. DenseNet121 [17] is used for all the state-of-the-art person
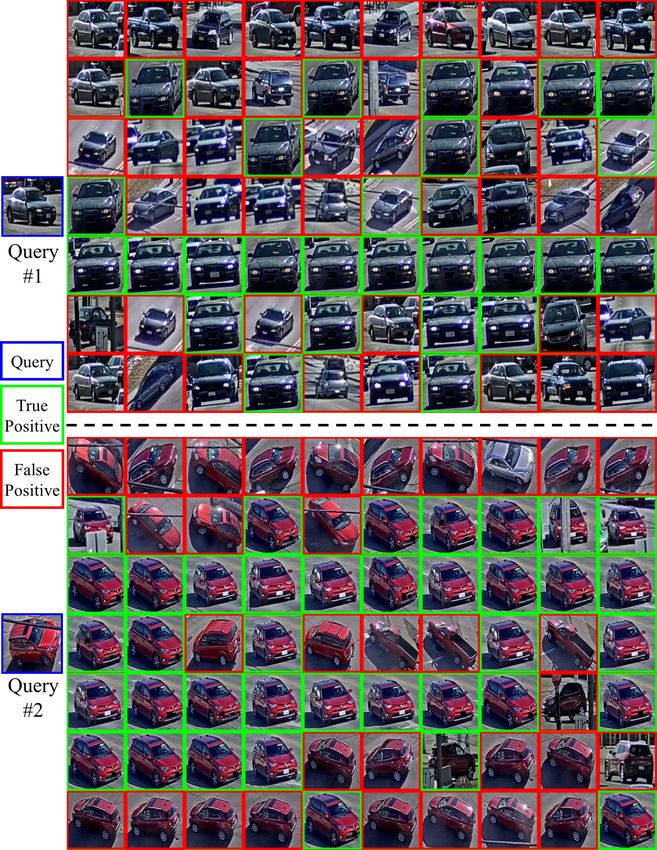
Figure 7. Qualitative performance of image-based ReID methods
ReID schemes in Tab. 4.
for two example queries from CityFlow-ReID. The rows of each
query show, from top to bottom, the results of FVS (Bhattacharyya
norm), Xent, Htri, Cent, Xent+Htri, BA and BS. Each row shows
4.3. Spatial-temporal analysis the top 10 matches found by that method. DenseNet121 [17] is
used for all the state-of-the-art person ReID schemes in Tab. 4.
The intuition behind spatio-temporal association is that
the moving patterns of vehicles are predictable, because
they usually follow traffic lanes, and the speed changes 5.1. Image-based ReID
smoothly. Liu et al. [29] propose a progressive and mul-
timodal vehicle ReID framework (PROVID), in which a First, we evaluate the performance of state-of-the-art
spatio-temporal-based re-ranking scheme is employed. The ReID methods on CityFlow-ReID, which is the subset of
spatio-temporal similarity is measured by computing the ra- our benchmark for image-based ReID mentioned in Sec-
tios of time difference and physical distance across cameras. tion 3.3. Our goal is to determine whether CityFlow-ReID
is challenging for existing methods.
More sophisticated algorithms apply probabilistic mod-
Non-metric learning method. The deep features output
els to learn the transition between pairs of cameras. For
by a CNN can be directly compared using standard distance
example, a method based on two-way Gaussian mixture
metrics. Tab. 3 shows the results of the FVS method [43]
model features (2WGMMF) [20] achieves state-of-the-art
using various distance metrics. Overall, the performance
accuracy on the NLPR MCT benchmark [7] by learning the
of non-metric learning is poor. Furthermore, the model is
transition time between camera views using Gaussian dis-
pre-trained on a dataset for fine-grained vehicle classifica-
tributions. In FVS [43], however, since no training data is
tion [53], which would hurt some performance gains versus
provided, the temporal distribution is pre-defined based on
pre-training on vehicle ReID dataset.
the estimated distance between cameras. Both methods re-
Metric learning methods in person ReID. Tab. 4 shows
quire manual selection of entry/exit zones in camera views,
results of state-of-the-art metric learning methods for per-
but 2WGMMF can learn the camera link model online.
son ReID on the CityFlow-ReID dataset, using different
loss functions and network architectures. The performance
5. Experimental evaluation results is much improved compared to the non-metric learning
method in Tab. 3. In particular, hard triplet loss is the
In this section we analyze the performance of various most robust. A combination of hard triplet loss and cross-
state-of-the-art methods on our CityFlow benchmark and entropy loss yields the best results. As for CNN architec-
compare our benchmark to existing ones. tures, DenseNet121 [17] achieves the highest accuracy in
6Loss ResNet50 ResNet50M ResNeXt101 SEResNet50 SEResNeXt50 DenseNet121 InceptionResNetV2 MobileNetV2
[12] [54] [51] [16] [16] [17] [38] [36]
Xent [40] 25.5 (41.3) 25.3 (42.1) 26.6 (42.4) 23.8 (40.4) 26.8 (45.2) 23.2 (39.9) 20.8 (35.5) 14.7 (26.0)
Htri [13] 28.7 (42.9) 27.9 (40.1) 30.0 (41.3) 26.3 (38.7) 28.2 (40.4) 30.5 (45.8) 23.7 (37.2) 0.4 (0.3)
Cent [48] 7.6 (18.2) 7.9 (21.5) 8.1 (19.3) 10.0 (25.9) 10.2 (25.6) 10.7 (27.9) 6.0 (15.2) 7.9 (18.4)
Xent+Htri 29.4 (45.9) 29.4 (49.7) 32.0 (48.8) 30.0 (47.2) 30.8 (49.1) 31.0 (51.7) 25.6 (42.2) 11.2 (16.3)
Xent+Cent 23.1 (37.5) 26.5 (47.3) 24.9 (40.9) 26.2 (43.7) 28.4 (47.5) 27.8 (48.1) 23.5 (39.5) 12.3 (24.0)
Table 4. State-of-the-art metric learning methods for person ReID on CityFlow-ReID, showing mAP and rank-1 (in parentheses), as
percentages. All networks were pre-trained on ImageNet [9]. The best architecture and loss function are highlighted for each row/column,
respectively, with the shaded cells indicating the overall best for both mAP and rank-1.
Method Market1501 DukeMTMC-reID MSMT17 Method VeRi-776 VehicleID PKU-VD1 PKU-VD2
[58] [34, 61] [45] [28] [26] [52] [52]
HA-CNN [23] 75.6 (90.9) 63.2 (80.1) 37.2 (64.7) GSTE [4] 59.5 (96.2) 72.4 (74.0) - -
MLFN [6] 74.3 (90.1) 63.2 (81.1) 37.2 (66.4) VAMI [63] 50.1 (77.0) - (47.3) - -
GLAD [47] - - 34.0 (61.4) OIFE [44] 48.0 (89.4) - (67.0) - -
Res50+Xent 75.3 (90.8) 64.0 (81.0) 38.4 (69.6) CCL [26] - 45.5 (38.2) - -
Res50M+Xent 76.0 (90.2) 64.0 (81.6) 38.0 (69.0) MGR [52] - - 51.1 (-) 55.3 (-)
SERes50+Xent 75.9 (91.9) 63.7 (81.5) 39.8 (71.1) MoV1+BA [18] 66.9 (90.1) 76.0 (66.7) - -
Dense121+Xent 68.0 (87.8) 58.8 (79.7) 35.0 (67.6) MoV1+BH [18] 65.1 (87.3) 76.9 (67.6) - -
MoV1+BS [18] 67.6 (90.2) 78.2 (69.3) 58.3 (58.3) 62.4 (69.4)
Table 5. State-of-the-art metric learning methods for person ReID MoV1+BW [18] 67.0 (90.0) 78.1 (69.4) - -
on other public benchmarks, showing mAP and rank-1 (in paren-
theses), as percentages. The bottom rows (from [62]) show that the Table 7. State-of-the-art metric learning methods for vehicle ReID
methods from Tab. 4 are competitive against the state-of-the-art. on other public benchmarks, showing mAP and rank-1 (in paren-
theses), as percentages. Performance is evaluated on the largest
test sets for VehicleID, PKU-VD1 and PKU-VD2. The bottom
Method mAP Rank-1 Rank-5 Rank-10
rows show the methods in our comparison (from Tab. 6).
MoV1+BA [18] 31.3% 49.6% 65.0% 71.2%
MoV1+BH [18] 32.0% 48.4% 65.2% 71.4%
MoV1+BS [18] 31.3% 49.0% 63.1% 70.9% Method IDF1 Recall FAR MT MOTA MOTP
MoV1+BW [18] 30.8% 50.1% 64.9% 71.4%
DS+YOLO 78.9% 67.6% 8.6 778 67.4% 65.8%
DS+SSD 79.5% 69.2% 8.3 756 68.9% 65.5%
Table 6. The state-of-the-art metric learning method for vehicle DS+FRCNN 78.9% 66.9% 15.3 761 66.7% 65.5%
ReID, with different sampling variants, on CityFlow-ReID.
TC+YOLO 79.1% 68.1% 8.5 871 68.0% 66.0%
TC+SSD 79.7% 70.4% 7.4 895 70.3% 65.6%
TC+FRCNN 78.7% 68.5% 12.0 957 68.4% 65.9%
most cases, as it benefits from improved flow of informa-
MO+YOLO 77.8% 69.0% 8.5 965 68.6% 66.0%
tion and gradients throughout the network. MO+SSD 72.8% 68.0% 6.3 980 67.0% 65.9%
Person ReID methods on other benchmarks. Despite MO+FRCNN 75.6% 69.5% 10.8 1094 68.6% 66.0%
the above efforts to explore network architectures and com-
bine metric learning losses, the top mAP on our CityFlow- Table 8. State-of-the-art methods for MTSC tracking and object
ReID benchmark is still lower than 35%. In comparison, detection on CityFlow. The metrics are explained in Section 3.5.
Tab. 5 [62, 56, 59, 55] shows the performance of the same
methods on other public benchmarks, using the same imple-
mentations and hyperparameters. In general, performance reduction in precision is likely due to the relatively simple
is significantly better, thus verifying that CityFlow-ReID is network architecture (MobileNetV1 [15]) and a computa-
indeed more challenging. tionally efficient embedding into 128 dimensions. Tab. 6
Metric learning methods in vehicle ReID. Tab. 6 dis- demonstrates yet again the challenges of CityFlow-ReID.
plays the results of the state-of-the-art for vehicle ReID [18] Vehicle ReID methods on other benchmarks. To ver-
on the proposed dataset. For this experiment we compare ify that our method is indeed competitive, Tab. 7 [18] shows
sampling variants (BA, BH, BS, and BW) using an imple- the performance of several state-of-the-art vehicle ReID ap-
mentation based on MobileNetV1 [15], as described earlier. proaches on public benchmarks.
Results in terms of rank-1 hit rates are only slightly These results are also summarized in the cumulative
worse than those from the combination of hard triplet loss match curve (CMC) plots in Fig. 6. Qualitative visualiza-
and cross-entropy loss in person ReID (see Tab. 4). This tion of performance is shown in Fig. 7. We observe that
7Spatio-temporal MTSC Image-based ReID
association tracking
FVS Bh. Xent Htri Cent Xent+Htri BA BS
DeepSORT [49] 21.5% 31.3% 35.3% 27.6% 34.5% 35.6% 33.6%
PROVID [29] TC [43] 22.1% 35.2% 39.4% 32.7% 39.9% 40.6% 39.0%
MOANA [42] 21.7% 29.1% 33.0% 26.1% 31.9% 34.4% 31.8%
DeepSORT [49] 25.0% 35.3% 38.4% 31.2% 37.5% 40.3% 39.8%
2WGMMF [20] TC [43] 27.6% 39.5% 41.7% 34.7% 43.3% 44.1% 45.1%
MOANA [42] 20.2% 32.2% 35.9% 28.2% 36.5% 38.1% 37.7%
DeepSORT [49] 24.9% 36.4% 40.0% 30.8% 39.0% 41.3% 41.4%
FVS [43] TC [43] 27.6% 40.5% 42.7% 36.6% 42.4% 46.3% 46.0%
MOANA [42] 21.2% 32.7% 36.4% 29.2% 37.5% 39.5% 36.9%
Table 9. MTMC tracking with different combinations of spatio-temporal association, MTSC tracking (supported by SSD512 [27]), and
image-based ReID methods on CityFlow. Each cell shows the ID F1 score. The best performance is highlighted for each row/column, with
the shaded cells indicating the overall best. DenseNet121 [17] is used for the comparison of Xent, Htri, Cent and Xent+Htri.
most failures are caused by viewpoint variations, which is a false positives are considered in the calculation of MTMC
key problem that should be addressed by future methods. tracking accuracy.
Overall the most reliable spatio-temporal association
5.2. MTSC tracking and object detection method is FVS, which exploits a manually specified proba-
Reliable cross-camera tracking is built upon accurate bilistic model of transition time. In comparison, 2WGMMF
tracking within each camera (MTSC). Tab. 8 shows results achieves performance comparable with FVS in most cases,
of state-of-the-art methods for MTSC tracking [49, 42, 43] due to the online learned transition time distribution applied
combined with leading object detection algorithms [32, 27, to those cameras that are shared between the training and
33] on CityFlow. Note that false positives are not taken into test sets. Without probabilistic modeling, PROVID yields
account in MTSC tracking evaluation, because only vehi- inferior results. We can also conclude from Tab 9 that the
cles that travel across more than one camera are annotated. choice of image-based ReID and MTSC tracking methods
With regards to object detectors, SSD512 [27] performs the has a significant impact on overall performance, as those
best, whereas YOLOv3 [32] and Faster R-CNN [33] show methods achieving superior performance in their sub-tasks
similar performance. As for MTSC trackers, TC [43], the also contribute to higher MTMC tracking accuracy.
only offline method, performs better according to most of
the evaluation metrics. DeepSORT [49] and MOANA [42] 6. Conclusion
share similar performance in MOTA, but the ID F1 scores We proposed a city-scale benchmark, CityFlow, which
of DeepSORT are much higher. Nonetheless, MOANA is enables both video-based MTMC tracking and image-based
capable of tracking most trajectories successfully. ReID tasks. Our major contribution is three-fold. First,
CityFlow is the first attempt towards city-scale applications
5.3. MTMC tracking
in traffic understanding. It has the largest scale among all
MTMC tracking is a joint process of visual-spatio- the existing ReID datasets in terms of spatial coverage and
temporal reasoning. For these experiments, we first apply the number of cameras/intersections involved. Moreover,
MTSC tracking, then sample a number of signatures from a wide range of scenes and traffic flow conditions are in-
each trajectory in order to extract and compare appearance cluded. Second, CityFlow is also the first benchmark to
features. The number of sampled instances from each vehi- support vehicle-based MTMC tracking, by providing anno-
cle is empirically chosen as 3. tations for the original videos, the camera geometry, and
Tab 9 shows the results of various methods for spatio- calibration information. The provided spatio-temporal in-
temporal association, MTSC tracking, and image-based formation can be leveraged to resolve ambiguity in image-
ReID on CityFlow. Note that PROVID [29] compares vi- based ReID. Third, we conducted extensive experiments
sual features first, then uses spatio-temporal information evaluating the performance of state-of-the-art approaches
for re-ranking; whereas 2WGMMF [20] and FVS [43] first on our benchmark, comparing and analyzing various visual-
model the spatio-temporal transition based on online learn- spatio-temporal association schemes. We show that our sce-
ing or manual measurements, and then perform image- narios are challenging and reflect realistic situations that de-
based ReID only on the confident pairs. Note also that, ployed systems will need to operate in. Finally, CityFlow
since only trajectories spanning multiple cameras are in- may also open the way for new research problems such as
cluded in the evaluation, different from MTSC tracking, vehicle pose estimation, viewpoint generation, etc.
8References [18] Ratnesh Kumar, Edwin Weill, Farzin Aghdasi, and Parth-
sarathy Sriram. Vehicle re-identification: An efficient base-
[1] DeepStream SDK. https://developer.nvidia.com/deepstream- line using triplet embedding. In Proc. IJCNN, 2019. 5, 7,
sdk. 3 12
[2] The drivers privacy protection act (DPPA) and [19] Laura Leal-Taixé, Anton Milan, Ian Reid, Stefan Roth, and
the privacy of your state motor vehicle record. Konrad Schindler. MOTChallenge 2015: Towards a bench-
https://www.epic.org/privacy/drivers/. 1 mark for multi-target tracking. arXiv:1504.01942, 2015. 5,
[3] Google Maps. https://www.google.com/maps/. 4 11
[4] Yan Bai, Yihang Lou, Feng Gao, Shiqi Wang, Yuwei Wu, [20] Young-Gun Lee, Zheng Tang, and Jenq-Neng Hwang.
and Ling-Yu Duan. Group sensitive triplet embedding for Online-learning-based human tracking across non-
vehicle re-identification. T-MM, 20(9):2385–2399, 2018. 7 overlapping cameras. T-CSVT, 28(10):2870–2883, 2018. 6,
[5] Keni Bernardin and Rainer Stiefelhagen. Evaluating multi- 8
ple object tracking performance: The CLEAR MOT metrics. [21] Wei Li, Rui Zhao, and Xiaogang Wang. Human reidentifica-
Image and Video Processing, 2018. 4, 11 tion with transferred metric learning. In Proc. ACCV, pages
[6] Xiaobin Chang, Timothy M. Hospedales, and Tao Xiang. 31–44, 2012. 1, 2, 3
Multi-level factorisation net for person re-identification. In [22] Wei Li, Rui Zhao, Tong Xiao, and Xiaogang Wang. Deep-
Proc. CVPR, pages 2109–2118, 2017. 7 ReID: Deep filter pairing neural network for person re-
[7] Weihua Chen, Lijun Cao, Xiaotang Chen, and Kaiqi Huang. identification. In Proc. CVPR, pages 152–159, 2014. 1, 2,
An equalised global graphical model-based approach for 3
multi-camera object tracking. arXiv:1502.03532, 2015. 1, [23] Wei Li, Xiatian Zhu, and Shaogang Gong. Harmonious at-
2, 3, 6 tention network for person re-identification. In Proc. CVPR,
[8] Dong Seon Cheng, Marco Cristani, Michele Stoppa, Loris pages 2285–2294, 2018. 7
Bazzani, and Vittorio Murino. Custom pictorial structures [24] Yuan Li, Chang Huang, and Ram Nevatia. Learning to asso-
for re-identification. In Proc. BMVC, pages 68.1–68.11, ciate: Hybrid boosted multi-target tracker for crowded scene.
2011. 1, 2, 3 In Proc. CVPR, pages 2953–2960, 2009. 4, 11
[9] Jia Deng, Wei Dong, Richard Socher, Li-Jia Li, Kai Li, [25] Tsung-Yi Lin, Michael Maire, Serge Belongie, James Hays,
and Li Fei-Fei. ImageNet: A large-scale hierarchical image Pietro Perona, Deva Ramanan, Piotr Dollr, and C. Lawrence
database. In Proc. CVPR, pages 248–255, 2009. 7 Zitnick. Microsoft COCO: Common objects in context. In
[10] Yan Em, Feng Gag, Yihang Lou, Shiqi Wang, Tiejun Huang, Proc. ECCV, pages 740–755, 2014. 5
and Ling-Yu Duan. Incorporating intra-class variance to fine- [26] Hongye Liu, Yonghong Tian, Yaowei Yang, Lu Pang, and
grained visual recognition. In Proc. ICME, pages 1452– Tiejun Huang. Deep relative distance learning: Tell the dif-
1457, 2017. 1 ference between similar vehicles. In Proc. CVPR, pages
[11] Douglas Gray and Hai Tao. Viewpoint invariant pedestrian 2167–2175, 2016. 1, 2, 3, 5, 7
recognition with an ensemble of localized features. In Proc. [27] Wei Liu, Dragomir Anguelov, Dumitru Erhan, Christian
ECCV, pages 262–275, 2008. 1, 2, 3 Szegedy, Scott Reed, Cheng-Yang Fu, and Alexander C.
[12] Kaiming He, Xiangyu Zhang, Shaoqing Ren, and Jian Sun. Berg. SSD: Single shot multibox detector. In Proc. ECCV,
Deep residual learning for image recognition. In Proc. pages 21–37, 2016. 5, 8
CVPR, pages 770–778, 2016. 5, 7, 12 [28] Xinchen Liu, Wu Liu, Tao Mei, and Huadong Ma. A
[13] Alexander Hermans, Lucas Beyer, and Bastian Leibe. In deep learning-based approach to progressive vehicle re-
defense of the triplet loss for person re-identification. identification for urban surveillance. In Proc. ECCV, pages
arXiv:1703.07737, 2017. 2, 5, 7, 12 869–884, 2016. 1, 2, 3, 5, 7
[14] Martin Hirzer, Csaba Beleznai, Peter M. Roth, and Horst [29] Xinchen Liu, Wu Liu, Tao Mei, and Huadong Ma. PROVID:
Bischof. Person re-identification by descriptive and discrim- Progressive and multimodal vehicle reidentification for
inative classification. In Proc. SCIA, pages 91–102, 2011. 1, large-scale urban surveillance. T-MM, 20(3):645–658, 2017.
2, 3 6, 8
[15] Andrew G. Howard, Menglong Zhu, Bo Chen, Dmitry [30] Anton Milan, Laura Leal-Taixé, Ian Reid, Stefan Roth, and
Kalenichenko, Weijun Wang, Tobias Weyand, Marco An- Konrad Schindler. MOT16: A benchmark for multi-object
dreetto, and Hartwig Adam. MobileNets: Efficient con- tracking. arXiv:1603.00831, 2016. 5
volutional neural networks for mobile vision applications. [31] Milind Naphade, Ming-Ching Chang, Anuj Sharma,
arXiv:1704.04861, 2017. 5, 7 David C. Anastasiu, Vamsi Jagarlamudi, Pranamesh
[16] Jie Hu, Li Shen, and Gang Sun. Squeeze-and-excitation net- Chakraborty, Tingting Huang, Shuo Wang, Ming-Yu Liu,
works. In Proc. CVPR, pages 7132–7141, 2018. 5, 7, 12 Rama Chellappa, Jenq-Neng Hwang, and Siwei Lyu. The
[17] Gao Huang, Zhuang Liu, Laurens Van Der Maaten, and Kil- 2018 NVIDIA AI City Challenge. In Proc. CVPR Work-
ian Q. Weinberger. Densely connected convolutional net- shops, pages 53–60, 2018. 5
works. In Proc. CVPR, pages 2261–2269, 2017. 5, 6, 7, 8, [32] Joseph Redmon and Ali Farhadi. YOLOv3: An incremental
12 improvement. arXiv:1804.02767, 2018. 4, 5, 8
9[33] Shaoqing Ren, Kaiming He, Ross Girshick, and Jian Sun. [48] Yandong Wen, Kaipeng Zhang, Zhifeng Li, and Yu Qiao. A
Faster R-CNN: Towards real-time object detection with re- discriminative feature learning approach for deep face recog-
gion proposal networks. In Proc. NeurIPS, pages 91–99, nition. In Proc. ECCV, pages 499–515, 2016. 2, 5, 7, 12
2015. 5, 8 [49] Nicolai Wojke, Alex Bewley, and Dietrich Paulus. Simple
[34] Ergys Ristani, Francesco Solera, Roger Zou, Rita Cucchiara, online and realtime tracking with a deep association metric.
and Carlo Tomasi. Performance measures and a data set for In Proc. ICIP, pages 3645–3649, 2017. 5, 8
multi-target, multi-camera tracking. In Proc. ECCV, pages [50] Yu Wu, Yutian Lin, Xuanyi Dong, Yan Yan, Wanli Ouyang,
17–35, 2016. 1, 2, 3, 4, 7, 11 and Yi Yang. Exploit the unknown gradually: One-shot
[35] Ergys Ristani and Carlo Tomasi. Features for multi-target video-based person re-identification by stepwise learning. In
multi-camera tracking and re-identification. In Proc. CVPR, Proc. CVPR, pages 5177–5186, 2018. 1, 2, 3
pages 6036–6046, 2018. 5 [51] Saining Xie, Ross Girshick, Piotr Dollr, Zhuowen Tu, and
[36] Mark Sandler, Andrew Howard, Menglong Zhu, Andrey Zh- Kaiming He. Aggregated residual transformations for deep
moginov, and Liang-Chieh Chen. MobileNetV2: Inverted neural networks. In Proc. CVPR, pages 5987–5995, 2017. 5,
residuals and linear bottlenecks. In Proc. CVPR, pages 7, 12
4510–4520, 2018. 5, 7, 12 [52] Ke Yan, Yonghong Tian, Yaowei Wang, Wei Zeng, and
[37] Jeffrey Shaw. Signalized Intersections: Informational Guide, Tiejun Huang. Exploiting multi-grain ranking constraints for
chapter 7, pages 145–158. U.S. Department of Transporta- precisely searching visually-similar vehicles. In Proc. ICCV,
tion Federal Highway Administration, 2004. 4 pages 562–570, 2017. 1, 2, 3, 5, 7
[38] Christian Szegedy, Sergey Ioffe, Vincent Vanhoucke, and [53] Linjie Yang, Ping Luo, Chen Change Loy, and Xiaoou Tang.
Alexander A. Alemi. Inception-v4, Inception-ResNet and A large-scale car dataset for fine-grained categorization and
the impact of residual connections on learning. In Proc. verification. In Proc. CVPR, pages 3973–3981, 2015. 5, 6
AAAI, pages 4278–4284, 2017. 5, 7, 12 [54] Qian Yu, Xiaobin Chang, Yi-Zhe Song, Tao Xiang, and Tim-
othy M. Hospedales. The devil is in the middle: Exploiting
[39] Christian Szegedy, Wei Liu, Yangqing Jia, Pierre Sermanet,
mid-level representations for cross-domain instance match-
Scott Reed, Dragomir Anguelov, Dumitru Erhan, Vincent
ing. arXiv:1711.08106, 2017. 5, 7, 12
Vanhoucke, and Andrew Rabinovich. Going deeper with
convolutions. In Proc. CVPR, pages 1–9, 2015. 5 [55] Shiliang Zhang. State of the art on the MSMT17. https://
www.pkuvmc.com/publications/state of the art.html. 7
[40] Christian Szegedy, Vincent Vanhoucke, Sergey Ioffe, Jon
[56] Liang Zheng. State of the art on the Market-1501 dataset.
Shlens, and Zbigniew Wojna. Rethinking the Inception ar-
http://www.liangzheng.com.cn/Project/state of the art mark
chitecture for computer vision. In Proc. CVPR, pages 2818–
et1501.html. 7
2826, 2016. 2, 5, 7, 12
[57] Liang Zheng, Zhi Bie, Yifan Sun, Jingdong Wang, Chi Su,
[41] Zheng Tang, Renshu Gu, and Jenq-Neng Hwang. Joint
Shengjin Wang, and Qi Tian. MARS: A video benchmark for
multi-view people tracking and pose estimation for 3d scene
large-scale person re-identification. In Proc. ECCV, pages
reconstruction. In Proc. ICME, pages 1–6, 2018. 5
868–884, 2016. 1, 2, 3
[42] Zheng Tang and Jenq-Neng Hwang. MOANA: An online [58] Liang Zheng, Liyue Shen, Lu Tian, Shengjin Wang, Jing-
learned adaptive appearance model for robust multiple object dong Wang, and Qi Tian. Scalable person re-identification:
tracking in 3D. IEEE Access, 7(1):31934–31945, 2019. 5, 8 A benchmark. In Proc. ICCV, pages 1116–1124, 2015. 1, 2,
[43] Zheng Tang, Gaoang Wang, Hao Xiao, Aotian Zheng, and 3, 4, 7
Jenq-Neng Hwang. Single-camera and inter-camera vehi- [59] Zhedong Zheng. State-of-the-art on DukeMTMC-
cle tracking and 3D speed estimation based on fusion of vi- reID. https://github.com/layumi/DukeMTMC-reID evaluat
sual and semantic features. In Proc. CVPR Workshops, pages ion/tree/mast er/State-of-the-art. 7
108–115, 2018. 4, 5, 6, 8, 11 [60] Zhedong Zheng, Xiaodong Yang, Zhiding Yu, Liang Zheng,
[44] Zhongdao Wang, Luming Tang, Xihui Liu, Zhuliang Yao, Yi Yang, and Jan Kautz. Joint discriminative and generative
Shuai Yi, Junjie Yan Jing Shao, Shengjin Wang, Hongsheng learning for person re-identification. In Proc. CVPR, 2019.
Li, and Xiaogang Wang. Orientation invariant feature em- 1
bedding and spatial temporal regularization for vehicle re- [61] Zhedong Zheng, Liang Zheng, and Yi Yang. Unlabeled sam-
identification. In Proc. CVPR, pages 379–387, 2017. 7 ples generated by GAN improve the person re-identification
[45] Longhui Wei, Shiliang Zhang, Wen Gao, and Qi Tian. Per- baseline in vitro. In Proc. ICCV, pages 3754–3762, 2017. 1,
son transfer GAN to bridge domain gap for person re- 2, 3, 7
identification. In Proc. CVPR, pages 79–88, 2018. 2, 3, [62] Kaiyang Zhou. deep-person-reid. https://github.com/
7 KaiyangZhou/deep-person-reid. 5, 7
[46] Longhui Wei, Shiliang Zhang, Wen Gao, and Qi Tian. [63] Yi Zhou and Ling Shao. Aware attentive multi-view infer-
Person trasfer GAN to bridge domain gap for person re- ence for vehicle re-identification. In Proc. CVPR, pages
identification. In Proc. CVPR, pages 79–88, 2018. 1 6489–6498, 2018. 7
[47] Longhui Wei, Shiliang Zhang, Hantao Yao, Wen Gao, and Qi
Tian. GLAD: Global-local-alignment descriptor for pedes-
trian retrieval. In Proc. ACM MM, pages 420–428, 2017. 7
107. Supplementary Norm Rank-100 mAP
Bhattacharyya 5.1%
This supplementary material includes additional de- L2 5.0%
tails regarding the definitions of the evaluation metrics L1 4.8%
for MTMC tracking as well as MTSC tracking, which L∞ 2.5%
are partially explained in Section 3.5. The measure-
ments are adopted from the MOTChallenge [5, 24] and Table 10. Performance of non-metric learning methods using CNN
DukeMTMC [34] benchmarks. Besides, the performance of features extracted from FVS [43] on our CityFlow-ReID bench-
our baseline image-based ReID methods in terms of mAP mark, showing rank-100 mAP, corresponding to the experimental
results of Tab. 3.
measured by the top 100 matches for each query is pre-
sented, which is the metric used in our evaluation server.
7.2. Metrics in DukeMTMC
7.1. Metrics in CLEAR MOT
There are three evaluation metrics introduced by the
The CLEAR MOT [5] metrics are used in the MOTChal- DukeMTMC benchmark, namely identification precision
lenge benchmark for evaluating multiple object tracking (IDP), identification recall (IDR), and the F1 score IDF1.
performance. The distance measure, i.e., how close a They are defined based on the counts of false negative iden-
tracker hypothesis is to the actual target, is determined by tities (IDFN), false positive identities (IDFP) and true posi-
the intersection over union between estimated bounding tive identities (IDTP), which are defined as follows,
boxes and the ground truths. The similarity threshold for X X
true positives is empirically set to 50%. IDFN = m (τ, γm (τ ) , t) , (3)
The Multiple Object Tracking Accuracy (MOTA) com- τ ∈AT t∈Tτ
bines three sources of errors to evaluate a tracker’s perfor- X X
mance. IDFP = m (τm (γ) , γ, t) , (4)
γ∈AC t∈Tγ
P
(FNt + FPt + IDSWt ) X X
MOTA = 1 − t P , (1) IDTP = kτ k − IDFN = kγk − IDFP, (5)
t GTt τ ∈AT γ∈AC
where t is the frame index. FN, FP, IDSW and GT respec- where τ and γ respectively denotes the true and computed
tively denote the numbers of false negatives, false positives, trajectories, AT and AC are all true and computed identities,
identity switches and ground truths. The range of MOTA and T represents the set of frame indices t over which the
in percentage is (−∞, 100], which becomes negative when corresponding trajectory extends. k·k returns the number of
the number of errors exceeds the ground truth objects. detections in a given trajectory. The expression m (τ, γ, t)
Multiple Object Tracking Precision (MOTP) is used to calculates the number of missed detections between τ and γ
measure misalignment between annotated and predicted ob- along time. We use γm (τ ) and τm (γ) to denote the bipar-
ject locations, defined as tite match from τ to γ and vice versa, respectively. Identifi-
cation precision (recall) is defined as the ratio of computed
P
t,i dt,i
(true) detections that are correctly identified.
MOTP = 1 − P , (2)
t ct IDTP
IDP = , (6)
IDTP + IDFP
in which ct denotes the number of matches and dt,i is the
bounding box overlap between target i and the ground truth IDTP
IDR = . (7)
at frame index t. According to the analysis in [19], MOTP IDTP + IDFN
shows a remarkably low variation across different methods IDF1 is the fraction of correctly identified detections over
compared with MOTA. Therefore, MOTA is considered as the average number of true and computed detections.
a more reliable evaluation for tracking performance.
2 · IDF1
Besides MOTA and MOTP, there are other metrics for IDF1 = . (8)
evaluating the tracking quality. MT measures the number 2 · IDF1 + IDFP + IDFN
of mostly tracked targets that are successfully tracked by at Compared to the metrics in CLEAR MOT, the truth-to-
least 80% of their life span. On the other hand, ML calcu- result mapping in IDF1 computation is not frame-by-frame
lates the number of mostly lost targets that are only recov- but identity-by-identity for the entire sequence, and the er-
ered for less than 20% of their total lengths. All the other rors of any type are penalized based on binary mismatch.
targets are classified as partially tracked (PT). Furthermore, Therefore, IDF1 can handle overlapping and disjoint fields
FAR measures the average number of false alarms, i.e., FN, of view for the evaluation of MTMC tracking performance,
FP and IDSW, per frame. which is a property absent in all previous measures.
11Loss ResNet50 ResNet50M ResNeXt101 SEResNet50 SEResNeXt50 DenseNet121 InceptionResNetV2 MobileNetV2
[12] [54] [51] [16] [16] [17] [38] [36]
Xent [40] 20.3% 20.4% 21.6% 18.6% 21.5% 18.6% 16.2% 10.4%
Htri [13] 22.1% 21.3% 23.3% 19.8% 21.7% 24.0% 17.8% 0.0%
Cent [48] 5.6% 6.1% 6.2% 8.3% 8.4% 9.5% 4.9% 5.2%
Xent+Htri 23.7% 24.2% 26.3% 24.3% 25.1% 26.0% 20.5% 6.5%
Xent+Cent 17.8% 21.7% 19.5% 20.9% 23.2% 23.3% 18.8% 8.3%
Table 11. Performance of state-of-the-art metric learning methods for person ReID on CityFlow-ReID, showing rank-100 mAP, corre-
sponding to the experimental results of Tab. 4. The best architecture and loss function are highlighted for each row/column, respectively,
with the shaded cells indicating the overall best.
Method Rank-100 mAP
MobileNetV1+BA [18] 25.6%
MobileNetV1+BH [18] 26.5%
MobileNetV1+BS [18] 25.6%
MobileNetV1+BW [18] 25.4%
Table 12. Performance of the state-of-the-art metric learning
method for vehicle ReID, with different sampling variants, on
CityFlow-ReID, corresponding to the experimental results of
Tab. 6. Rank-100 mAP is shown.
7.3. Rank-K mAP for evaluating image-based ReID
As mentioned in Section 3.5, to measure the total mAP
of each submission, a distance matrix of dimension Q × T
is required, where Q and T are the numbers of queries and
test images, respectively. For an evaluation server with
many users and each of them is allowed to submit multi-
ple times, such large file size may lead to system instability.
Thus, we create a new evaluation metric for image-based
ReID, named rank-K mAP, that measures the mean of av-
erage precision for each query considering only the top K
matches, so that the required dimension of each submission
can be reduced to Q × K. Note that K usually needs to
be larger than the maximum length of ground-truth trajec-
tories, which is chosen to be 100 for our evaluation.
Because rank-100 mAP is adopted in our evaluation
server, we present here the additional experimental results
in Tab. 10, Tab. 11 and Tab. 12, which correspond to Tab. 3,
Tab. 4 and Tab. 6, respectively.
12You can also read