Clare - FARM BUSINESS UPDATE - GRDC
←
→
Page content transcription
If your browser does not render page correctly, please read the page content below
FARM BUSINESS
   UPDATE
   STRATEGIC STEPS – ENDURING PROFIT

In conjunction with Hart Field Site Group’s Getting the Crop In

                    Clare
               Wednesday 14th March
                   9.00am to 4.30pm
  The Vine Church, Stradbrooke Road, Clare
                     #GRDCUpdates

                       2018 CLARE GRDC FARM BUSINESS UPDATE

                                     1
2018 Getting the Crop In
                                    Convened by Hart Field Site Group

                                    Clare GRDC Farm Business Update
                                        convened by ORM Pty Ltd.

              Additional copies of the proceedings can be ordered through ORM for
                                 $20 (including postage and GST)

                                                        46 Edward Street           T 03 5441 6176
                                                        PO Box 189                 E admin@orm.com.au
                                                        Bendigo VIC 3552           W orm.com.au

                    CAUTION: RESEARCH ON UNREGISTERED PESTICIDE USE
   Any research with unregistered pesticides or of unregistered products reported in this document does not
constitute a recommendation for that particular use by the authors, the authors’ organisations or the management
 committee. All pesticide applications must accord with the currently registered label for that particular pesticide,
                                              crop, pest and region.

                                         DISCLAIMER - TECHNICAL
 This publication has been prepared in good faith on the basis of information available at the date of publication
 without any independent verification. The Grains Research and Development Corporation does not guarantee or
 warrant the accuracy, reliability, completeness of currency of the information in this publication nor its usefulness
                                              in achieving any purpose.
 Readers are responsible for assessing the relevance and accuracy of the content of this publication. The Grains
    Research and Development Corporation will not be liable for any loss, damage, cost or expense incurred or
                arising by reason of any person using or relying on the information in this publication.
 Products may be identified by proprietary or trade names to help readers identify particular types of products but
this is not, and is not intended to be, an endorsement or recommendation of any product or manufacturer referred
                  to. Other products may perform as well or better than those specifically referred to.

                                            2018 CLARE GRDC FARM BUSINESS UPDATE

                                                          2
Getting The Crop In
    2018

Wednesday 14th March
8am – 12:15pm
Clare, SA

Dylan Bruce, regional intern, Hart
What are we learning about early sowing winter wheats?
*includes official release of the 2017 Hart Trial Results book

Kenton Porker, research scientist, SARDI
Are we ‘barley’ scratching the surface of new variety potential?

Ben Hunt, farmer, Bordertown, SA
Spreading the risk between cropping & livestock – hunting the right mix
Ben and wife Jules farm 1200-hectares at Bordertown in the state’s South East; he’ll talk about all aspects
of their cropping and livestock enterprises, including the different approaches they’ve taken to integrate
various systems into their operations.

Sam Chambers, Agribusiness Risk & Treasury, Rabobank
Price risk management against current market dynamics

Farmer panel Q&A
Ben Hunt (Bordertown), plus two local growers
‘Getting the crop in’ – three farmers share their strategies to kick off the 2018
growing season
….with plenty of time for questions from the floor

                                TEXT YOUR QUESTION
                                              0427 423 154
      If you have a question for one of our speakers, you can text it (starting with their name) to the number above

                www.hartfieldsite.org.au
What are we learning about early
    sowing winter wheats?
    Dylan Bruce, regional intern, Hart Field-Site Group
 Dylan has just completed his regional internship with the Hart Field-Site Group.

 Over the past 12 months he has been involved in every stage of the Hart research program from trial planning
 and sowing through to harvest and analysis. During his time at Hart he was responsible for the field
 management of trials in a new GRDC project ‘Development of crop management packages for early sown, slow
 developing wheats in the Southern region’.

 Today he completes his time with Hart by presenting key findings from local research at Hart and Booleroo. His
 presentation will focus on how well winter wheats performed in 2017 compared to traditional spring varieties.
 Dylan will also share results from a growth chamber experiment he completed as part of this project on wheat
 coleoptile length at the Waite Research Institute.

 NOTES:

*The internship provides an opportunity for the successful applicant to join Hart’s research
program and collaborate with other researchers, industry reps, consultants and growers to
deliver research projects in regional South Australia. The program is supported by Hart, SARDI
and the South Australian Grains Industry Trust to encourage early career graduates into
applied grains research and development careers and is now in its third year.

                                                   Dylan Bruce: (via) trials@hartfieldsite.org.au
Are we ‘barley’ scratching the surface
   of new variety potential?
   Kenton Porker, research scientist, SARDI
Kenton Porker is a research scientist for SARDI’s New Variety Agronomy group based at the Waite Campus.

Kenton has just been putting the finishing touches in his PhD in barley genetics and physiology. More recently he
has become involved in a wide range of national barley and wheat agronomy projects.

Today Kenton’s presentation “Are we ‘barley’ scratching the surface of new variety potential?” will give you an
update on varietal selection for different environments. Are some of the new barely varieties here to stay and if so
do they require different management? In this session he will give us a closer look at NVT results, time of sowing
trials and options for manipulating canopy structure.

NOTES:

                                             Kenton Porker: kenton.porker@sa.gov.au
Spreading the risk between cropping and
   livestock – hunting the right mix
   Ben Hunt, farmer, Bordertown SA
Ben and wife Jules are working through the transition of running the family’s 1200-hectare farm following the recent
retirement of Ben’s father Bill, and along with the challenges that in itself presents, they continue to look at ways
they can “spread the risk between cropping and livestock”.
Anyone who follows Ben’s Twitter handle @funky_farmer will have seen some of his trials and tribulations in running
the farm of which 70 per cent is focussed on cropping, alongside a flock of 1300 self-replacing Merino ewes.
Today, Ben will also speak about growing clover inter-rowed with barley, along with other crops including faba beans,
vetch, millet, and growing oats for the Quality Wise rolled oats brand for which he has become a ‘farming face’ for
consumers as part of the company’s traceable product initiative.
NOTES:

                           Ben Hunt: nalangfarms@outlook.com / twitter: @funky_farmer
Hart                   SA’s premier cropping field site

                         www.hartfieldsite.org.au
download it free

                                                                           subscribe now

                                 Hart event info, live weather & soil moisture probe data, board member
                                 info, a handy ‘search our site’ tool, healthy farmer resources & more.

                                                              Our values
                     Independence, relevance, integrity, credibility, professionalism, value for money and generosity.

                                                     We have a clear purpose
                   To deliver value to growers and make agriculture better (in productivity, sustainability & community).

                                      We are committed to delivering on our vision
                            To be SA’s premier cropping field site, providing independent information and skills
                                                      to the agricultural community.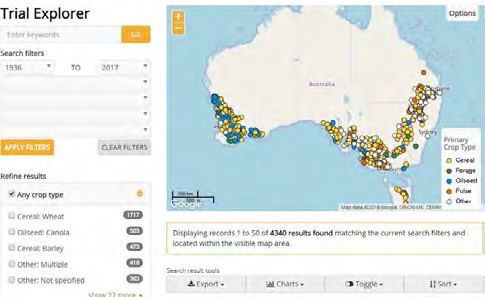
Price risk management against current
  market dynamics
  Sam Chambers, Agribusiness Risk & Treasury, Rabobank
Sam has 10 year’s experience in the financial services and commodity trading spheres joining Rabobank from
Commodities where, amongst other things, he was responsible for developing hedging & trading strategies as well
as trading basis and physical commodities.

Sam’s personal, professional and academic background leaves him well placed to discuss different marketing
strategies available to growers. He holds a Masters of Applied Finance majoring in Risk Management (Kaplan) and a
Bachelor of Agricultural Economics majoring in Agricultural Economics, Finance and Economics (University of
Sydney).
NOTES:

                                        Sam Chambers: samuel.chambers@rabobank.com
Farmer panel Q&A
   ‘Getting the crop in’… three farmers share their
   strategies to kick of the 2018 season
   Ben Hunt (Bordertown), Neil Wittwer (Paskeville), Andrew Mitchell (Mintaro)
Hear more from our guest farmer Ben Hunt and a couple of local guys, each with a different experience to share.
With farms of varying sizes and enterprise mix from Bordertown, Paskeville and Mintaro, these growers will share
their strategies and priorities when planning for the season ahead.
We’ll start with some discussion about the decisions they’ve already made to prepare for the 2018 season and what’s
next on the list.
And of course we’ll be encouraging grower to grower learning with lots of time for your questions.
NOTES:

We’re in the process of trial planning for 2018 right now. If you have an idea we’d love to hear it - please contact any one
of our board members or Hart R&E manager Sarah (trials@hartfieldsite.org.au).
HART 2018 EVENTS
Getting The Crop In
14th March 2018
8am – 12:15pm
Industry guest speakers from across the county cover
a wide range of topics, all relevant to broad-acre cropping.
We always treat you to breakfast first!

Winter Walk
17th July 2018
9am – 12pm
An informal guided walk around the trial site; your first
                                                                  HART FIELD DAY
opportunity to inspect the site post seeding, with guest
speakers presenting their observations on current trials.
                                                                  18th September 2018
They are on hand to answer your questions and will also           9am – 3:30pm
share their knowledge on all the latest cropping systems and
agronomic updates.
                                                                  Our main Field Day attracts hundreds of
Spring Twilight Walk                                              visitors from all over the Mid-North, South
16th October 2018                                                 Australia and interstate.
5pm followed by BBQ
Another informal opportunity to inspect the trial site, this      With a rolling program of half hour sessions
time just prior to harvest, again with industry researchers &     conducted simultaneously throughout the day,
representatives presenting in the field.                          highly regarded specialists speak at each trial,
This event is followed by drinks and a BBQ in the shed - a
great opportunity to chat more about how your season is
                                                                  backed up by a comprehensive take-home
unfolding and to catch up with other farmers in our district      Field Day Book included in your entry fee.
and beyond.
                                                                  Tailor your own program for the day to hear
                                                                  about the trials that interest you.
                                                                  Plenty of parking; buses and group bookings
                                                                  welcome.

                                                                           CONTACT US

                                                    Sandy Kimber                                     Sarah Noack
                                                    EXECUTIVE OFFICER               RESEARCH & EXTENSION MGR
                                                    0427 423 154                                    0420 218 420
                                                    admin@hartfieldsite.org.au         trials@hartfieldsite.org.au

                                                                www.hartfieldsite.org.au
GRDC FarmBusiness Update
CLARE
Contents
Program
13
Australian wheat production compares well to global Ashley Herbert, 15
competitors - an international benchmarking comparison Agrarian Management
Risk and enterprise mix Cam Nicholson, 23
Nicon Rural Services
Choosing and justifying the right sprayer Brett Symes 31
ORM Pty Ltd
Farm generational transfer – processes and structures Stephen Park 39
Pacer Legal
GRDC Southern Regional Panel 45
GRDC Southern Regional Cropping Solutions Network (RCSN) 46
GRDC Southern Region Key Contacts 47
Acknowledgments 48
Evaluation form 50
2018 CLARE GRDC FARM BUSINESS UPDATE
11Trusted solutions from
the experts you know in
Crop Nutrition, Field Crop
Diseases and Grain Storage
@AuCropNutrition
www.extensionaus.com.au @AusCropDiseases
@1800weevil
Hear From And get
from the across the answers
experts Australia you needGRDC FarmBusiness Update
CLARE
Program
1.00 pm Announcements ORM
1.05 pm GRDC welcome and update
1.10 pm Benchmarking Australian grain growing businesses. Ashley Herbert,
How do we compare with businesses around the world Agrarian Management
1.50 pm Risk and enterprise mix Cam Nicholson,
Nicon Rural Services
2.30 pm Afternoon tea
2.50 pm Taking a planned approach to investment in plant David Smith,
and equipment ORM Pty Ltd
3.30 pm Farm generational transfer – processes and structures Stephen Park,
Pacer Legal
4.10 pm Close and evaluation
On Twitter? Follow @GRDCUpdateSouth and use the
hashtag #GRDCUpdates to share key messages
2018 CLARE GRDC FARM BUSINESS UPDATE
13The GRDC’s Farming the Business manual is for farmers and
advisers to improve their farm business management skills.
It is segmented into three modules to address
the following critical questions:
Module 1: What do I need to know about business to
manage my farm business successfully?
Module 2: Where is my business now and where
do I want it to be?
Module 3: How do I take my business to the next level?
The Farming the Business manual is available as:
Hard copy – Freephone 1800 11 00 44 and quote Order Code: GRDC873
There is a postage and handling charge of $10.00. Limited copies available.
PDF – Downloadable from the GRDC website – www.grdc.com.au/FarmingTheBusiness
or
eBook – Go to www.grdc.com.au/FarmingTheBusinesseBook for the Apple iTunes
bookstore, and download the three modules and sync the eBooks to your iPad.
Farming the Business
Module 1 Module 2 Module 3
Mike Krause
Mike Krause Mike Krause Mike Krause
Level 4, 4 National Circuit, Barton ACT 2600 | PO Box 5367, Kingston ACT 2604 | T +61 2 6166 4500 | F +61 2 6166 4599 | E grdc@grdc.com.au | W www.grdc.com.auAustralian wheat production compares well
to global competitors - an international
benchmarking comparison
Ashley Herbert.
Agrarian Management.
GRDC project code: AAM00001
Keywords
benchmarking, enterprise margin, costs, income.
Take home messages
Wheat production in Australia tends to be relatively high cost with high levels of yield variation
between years compared to other major wheat exporting regions of the world.
The key strength or advantage of the Australian farms lies in the value achieved for grain sales.
There is a real need to preserve or protect the existing markets and value of Australian wheat.
Introduction rotations, inputs, operations, machinery, labour,
costs and income. Each year the data is updated
Australian wheat production and profitability
according to the prevailing conditions of the season.
compares well to our international competitors
according to data from the global benchmarking The data is then compiled into a single database
network, agri benchmark cash crop (http:// by the agri benchmark staff at the Thünen Institute.
www.agribenchmark.org/cash-crop.html). This Financial data is converted into USD and EURO
international analysis is part of the GRDC project based on the average exchange for the year.
AAM00001 and covers the five year period from This study includes 41 typical farms located in the
2011 to 2015. European Union (21), Canada (4), USA (1), Ukraine (2),
Agri benchmark (www.agribenchmark.org) is a Russia (1), Argentina (3), Uruguay (2) and Australia (7).
global network of professionals in agriculture from While there are additional farms within the database,
the major grain growing regions of the world. The only the results of those with a continuous dataset
aim of the network is to improve the understanding for the five year period of 2011 to 2015 have been
of grain production systems throughout the world presented within this paper.
through benchmarking. The network is administered This report focusses on wheat and includes
and managed through the Thünen Institute of Farm summaries of:
Economics in Germany.
• Yields and yield variability.
Participating network members establish a ‘Typical
Farm’ for a defined region. These are virtual farms • Farm gate grain prices.
that reflect what would be considered typical for • Crop income and production costs.
the targeted region in terms of scale, crops grown,
• Enterprise margins.
2018 CLARE GRDC FARM BUSINESS UPDATE
15Australian representation
Figure 1. Location of the Australian farms that are within the agri benchmark network.
Table 1. Legend for country codes used in tables and figures within this paper.
Code Country/Town Code County/Town Code Country/Town
AUWB Australia, Kellerberrin AWSC Australia, Esperance AUNSW Australia, Gulargambone
AUQLD Australia, Dalby AUSA Australia, Freeling AUVIC Australia, Sea Lake
AUWA Australia, Tenindewa RU Russia UA Ukraine
BG Bulgaria CZ Czech Republic DE Germany
DK Denmark FR France HU Hungary
PL Poland SE Sweden UK United Kingdom
CA Canada US United States of America AR Argentina
UY Uruguay
Yield this group the highest yields are achieved on the
typical farms from the Western European countries
The five year average yields of wheat in this
(including the UK) (Figure 2).
analysis range from 1.6t/ha (AUVic) to 9.7t/ha (EU)
with the EU standing out as the highest yielding Wheat yields from the non EU farms ranged from
region with a range of 4.7t/ha to 9.7t/ha. Within 1.6t/ha (AUVic) to 5.4t/ha (Ukraine).
Figure 2. Average wheat yields and grain prices ($US/t farm gate) for the five years from 2011 to 2015.
2018 CLARE GRDC FARM BUSINESS UPDATE
16High yield variability between years is a stand out Table 2. Average farm gate wheat price ($US/t) for the years
feature of the Australian farms. The Australian wheat 2011 to 2015.
yields have been the most variable over the last five Farm gate price ($US/t)
Typical farm
years with an average coefficient of variation (CoV) regions Average 25th Percentile Median 75th Percentile
of 25% over this period (ranging from 9% AUQld to
AU4000WB $236
44% AUNSW).
AU4500SC $247
In general, yields on the EU, North American, AU3000NSW $237
Argentinian and East region farms have been AU1550QLD $241
relatively stable with an average CoV of 12%, 13%,
AU2800SA $243
15% and 12% respectively.
AU3500VIC $233
The highest level of yield variation within the AU5500WA $259
dataset was recorded on the AUNSW farm reflecting AUSTRALIA $242
the extreme fluctuations of seasonal conditions in East Europe $181
the study period. The recorded yields for this farm
EU $235 $223 $238 $247
ranged from 0.8t/ha to 2.9t/ha.
North America $225
Argentina $114
Price
Uruguay $164
Grain prices are presented on a farm gate basis All farms $219 $214 $225 $245
per tonne nett of freight to end point and include
all selling costs. The price reflects the total value of Income and costs
grain produced including premiums or discounts for
In order to meaningfully compare between farms
quality or grade.
and regions, costs, income and profit margin are
The wheat price has been relatively consistent calculated on a tonne of production basis. On this
across regions with $US31/t difference between the basis the EU farms are no longer distinctive as a
25th and 75th price percentile. The median price for group and the Argentinian farms are clearly the
the dataset was $US225/t. lowest cost producers (Figure 3). Total costs of
The prices for the Australian farms have been production ranged from $US107/t (Argentina) to
relatively high and consistent between farms. $US206/t (AUNSW).
The combined average for the Australian farms of There is a high level of variation in costs per
$US242/t compares very well to other regions and is tonne of production within the Australian group
just under the 75th percentile of the dataset. This is ranging from the highest for the dataset (AUNSW
particularly significant given the generally high cost $US206 and AUWA $US215) to some of the lowest
of getting Australian grain from farm to port. (ex-Argentina).
Figure 3. Average wheat income and costs per tonne ($US) of production for the period 2009 to 2013.
P25 (low line) and P75 (high line) refers to the 25th and 75th percentiles for the total production costs of the
dataset, respectively.
2018 CLARE GRDC FARM BUSINESS UPDATE
17The high average cost for AUNSW is the result of farms is the exclusive use of contractors for all
the exceptionally poor yield in 2013 of 0.8t/ha. This cropping activities. Machinery costs include fuel,
will have a disproportionate effect on the average repairs, contracts and depreciation. According to
costs per tonne in the short term, assuming that the network partners this is common practice in the
such yields occur far less frequently than one in grain growing regions of Argentina.
four years.
As a region, Australia has the highest costs of
One common feature across all farms is the high production with an average of $US169/t ranging
cost of fertiliser and machinery. While there is some from a low of $US124/t to $US215/t. This represents
level of variation between the individual farms these a range of $US91/t.
two items were consistently the highest cost items at
The high production costs of the AUWA farm
the regional level.
($US215/t) is relatively consistent across years and
The Argentinian farms have the lowest costs per is primarily due to a high cost structure across the
tonne of production with an average of $US109/t board. Fertiliser in particular is the highest cost in
(dataset median $US156/t) which is driven for the the data set at $US74/t reflecting a relatively high
most part by the significantly lower machinery and input system.
labour costs. A key point of difference on these
Table 3. Average and median production costs per tonne of wheat production for the period 2011 to 2015.
Cost per tonne of production (USD)
Region/ Farm
Seed Fertiliser Pesticides Labour Machinery Total
AU4000WB $11 $41 $33 $32 $60 $179
AU4500SC $8 $45 $20 $15 $52 $144
AU3000NSW $14 $43 $34 $38 $74 $206
AU1550QLD $5 $40 $19 $31 $62 $163
AU2800SA $7 $25 $26 $18 $47 $124
AU3500VIC $10 $31 $34 $35 $41 $154
AU5500WA $18 $74 $36 $25 $61 $215
AUSTRALIA $10 $43 $29 $28 $57 $169
East Europe $11 $26 $10 $17 $56 $120
EU $13 $36 $22 $33 $53 $160
North America $16 $46 $21 $13 $49 $154
Argentina $13 $41 $17 $4 $34 $109
Uruguay $28 $46 $24 $4 $62 $165
All farms $14 $38 $22 $25 $52 $155
Figure 4. Average wheat enterprise margin ($US) per tonne of production of wheat for the period 2011
to 2015; including decoupled payments. P25 (low line) and P75 (high line) refers to the 25th and 75th
percentile margin, respectively.
2018 CLARE GRDC FARM BUSINESS UPDATE
18East region farms (Russia and Ukraine) have a cost Although the South American farms have
base of $US120/t which is approximately $US40/t the lowest production costs they also recorded
less than the Australian average. The difference exceptionally poor pricing for the period resulting in
is primarily driven by low fertiliser, pesticides and very low margins.
labour costs. However, wheat prices recorded were
Interestingly, the average margins for the EU,
approximately $US60/t less which has eroded some
North American and Australian farms are relatively
of the competitive advantage.
similar ($US79/t, $US71/t & $US73/t). However, when
decoupled payments are taken into account the EU
Enterprise margin farms have a $US48/t advantage.
In general Australian wheat profitability compares
favourably to farms from Canada, USA and EU. The Key messages and strategic value
margin for AUSC and AUSA were within the group
This study highlights that wheat production in
of the highest margins at $US104/t and $US119/t,
Australia tends to be relatively high cost with high
respectively (Figure 4).
levels of yield variation between years compared to
Profitability was highly variable within the EU other major wheat exporting regions of the world.
group with margins ranging from $US16/t to Australia is not a low cost producer of wheat despite
$US139/t. The median profit for the EU group was the general large scale nature of the Australian
$US78/t. production system.
The average profit margin for the North American Despite this, the average wheat enterprise margin
farms was $US71/t. for the Australian farms of $US73/t was above the
dataset average and median ($US67/t and $US64/t,
Decoupled payments refer to income that was
respectively) and similar to that of the EU and North
received independent of production (e.g. subsidies).
American farms ($US79/t and $US71/t excluding
Decoupled payments added $US37/t to $US59/t decoupled payments, respectively).
to the profitability of the EU farms. This increased the
The key strength or advantage of the Australian
median profit margin to $US127/t of the EU farms.
farms lies in the value achieved for grain sales. Over
Despite having some of the highest production the five year period of this study the Australian farms
costs and lowest yields in the dataset, the profit achieved the highest average price in the dataset at
margin on the Australian farms was just above the $US242/t farm gate. The median price of the dataset
average for the dataset. This is attributable to the was $US225/t. The EU farms had median prices of
relatively high grain price achieved over the period. $US238/t and North American farms had median
prices of $US225/t farm gate.
Table 4. Summary of wheat enterprise margin ($US) per tonne of production.
Wheat enterprise margin ($US/t)
Typical farm regions
Average 25th Percentile Median 75th Percentile + decoupled
AU4000WB $57 $59
AU4500SC $104 $105
AU3000NSW $31 $31
AU1550QLD $79 $79
AU2800SA $119 $119
AU3500VIC $79 $79
AU5500WA $43 $43
AUSTRALIA $73 $74
East Europe $61 $62
EU $79 $58 $78 $102 $125
North America $71 $72
Argentina $5 $5
Uruguay -$1 -$1
All farms $67 $48 $64 $94 $90
2018 CLARE GRDC FARM BUSINESS UPDATE
19This implies that Australian wheat is highly valued
and/or Australian wheat (on average) is accessing
higher value markets and is achieving some of the
best prices in the world. Therefore, expectations
of achieving better pricing relative to the general
market in the future are probably unreasonable.
One of the key messages from this study is that
there is a real need to preserve or protect the
existing markets and value of Australian wheat.
Australian farms are unlikely to be able to
compete with the low cost of production of the
Russian and Ukraine production systems. These
areas have fundamentally very low costs for inputs
and labour which are not likely to change for some
time. In addition, there is the very real prospect of
significant productivity gains to be achieved within
these regions in the medium term.
While maintaining a continual focus on cost
control and yield improvement remains a priority,
the main message for the broader industry is that
the high value grain price needs to be preserved
to maintain competitive profitability, particularly
for the lower yielding producers. Medium to low
yield typical Australian farms are unlikely to be
sufficiently profitable at the average wheat price for
the data set.
Contact details
Ashley Herbert
Agrarian Management
ashley@agrarian.com.au
Return to contents
2018 CLARE GRDC FARM BUSINESS UPDATE
20Notes
2018 CLARE GRDC FARM BUSINESS UPDATE
21GET THE LATEST STORED GRAIN INFORMATION ONLINE
STORED GRAIN PROJECT storedgrain.com.au
Booklets and fact sheets
on all things grain storage
Workshops in all regions
covering topics such as:
´ Economics of on-farm storage
´ Grain storage hygiene
´ Aeration cooling or drying
´ Managing high moisture
´ Fumigation
´ Insect pest management
´ Managing different storages
´ Storage facility design
´ Storing pulses and oilseeds
Call the
National
Grain
Storage Download the new
Information
Hotline 1800 WEEVIL storedgrain app
(1800 933 845) to to get the latest
speak to your local information and
grain storage specialist storage recording
for advice or to arrange
a workshop tool on your
iPhone or iPad
www.grdc.com.au www.storedgrain.com.au 02 6166 4500 STORED GRAIN PROJECTRisk and enterprise mix
Cam Nicholson.
Nicon Rural Services.
GRDC project code: SFS00028
Keywords
enterprise mix, risk, volatility, strategy.
Take home messages
Managing risk is not about the middle or the average, it is the opposite. It is appreciating what
happens at the extremes, the size or value of these extremes and how often they occur.
Understanding the probability of different yield and price values occurring and if these values are
correlated is essential in understanding risk.
Usually diversification reduces risk (both downside but also upside risk).
Introduction There is no reward without risk. In farming, risk is
a necessary part of making returns. Managing risk
Risk is a natural and accepted part of farming.
is about making decisions that trade some level of
Australian agricultural production (based on value
acceptable risk for some level of acceptable return
of output) is the most volatile in the world and the
for an acceptable amount of effort. Decisions can be
most volatile sector of the Australian economy
made to reduce risk, but it usually comes at a price,
(Keogh, 2013). This volatility conveys a level of risk
namely lower returns.
that needs to be managed. Given most farmers are
still operating despite two centuries of volatility, A common definition of risk is likelihood by
this suggests that they have developed long term consequence. In other words risk requires knowing
strategies and operational tactics to cope with this how often an event happens (the frequency) and
ongoing challenge. what is the impact (the value) when it does happen.
A decision that increases risk will either increase the
There are many strategies farmers use to manage
likelihood of an event happening and/or increase
production risk. Diversification in crop and pasture
the consequence if it does occur. This increased
type, enterprise mix, targeting multiple markets
consequence may be a greater return, not just a
and property location are common strategies. So is
greater loss.
managing input costs, especially when production
and prices can be highly variable. We must remember everyone has a different
position on risk. Financial security, stage of life,
Understanding risk health, family circumstances and business and
personal goals can all influence the amount of risk
When we talk about risk most of us immediately
an individual is willing to take on. This position can
think about the negative consequences if an action
change rapidly, sometime triggered by sudden
goes bad. Dictionary definitions re-inforce this
events. Importantly no position is right or wrong, it is
thinking. However this is only one aspect of risk. The
what the individual is comfortable living with.
word risk is derived from the Italian word risicare,
which means ‘to dare’. To manage risk effectively we Average values are commonly used in agricultural
need to understand both the downside (the potential extension. We present average yields, average
harm from taking a risk) and also the upside (the prices and average costs. While these averages
opportunities that taking a risk can offer). convey a value (and are convenient), they rarely
2018 CLARE GRDC FARM BUSINESS UPDATE
23present the frequency of this average occurring. we have little or no control over at the start of the
This would be fine if we consistently got these season and are typically yields, prices and some
average values, but in agriculture we rarely do. The costs. Graphs are created that show the amount
key drivers of profit in agriculture, namely yield, or value of this risk and how often this amount
prices and some costs have a range of values or value occurs. It includes extreme and more
within and between production periods. If we use common results and is referred to as distributions
averages for analysis, it usually over estimates or frequency histograms. The broader the range in
the profits and hides the volatility in those profits values, the greater the volatility or risk (Figure 1).
(Nicholson, 2013).
These ‘risky’ distributions are then substituted
Managing risk is not about the middle or the for the average values used in calculations. For
average, it is the opposite. It is appreciating what example we may have used an average price
happens at the extremes, the size or value of these for canola delivered at Adelaide of $556/t. By
extremes and how often they occur. substituting this distribution, the program will do
some calculations with a price around $556/t,
Analysing risk but will also do calculations with prices at $450/t,
As described previously the derivation of risk $500/t, $600/t and even $800/t. However the
is ‘to dare’. This implies there is opportunity but frequency these prices occur will be different.
it also implies a choice. As individuals we can There will be more calculations around $500/t
influence how much risk we expose ourselves to than around $450/t or $600/t and many more than
by making choices. around $800/t.
Insights from the Grain and Graze program would The same can be done for yields (and some
suggest farmers mainly inform their decisions costs, although most costs increase in price but are
around risk, based on past experience and intuition not highly variable throughout the season). When
or instinct. Doing the ‘sums’ to understand the the risky yield, price and cost values are combined;
likelihood and consequence is much less common. they reflect what happens in real life. For example
we may have a high yield but poor prices, so our
Through the Grain and Graze program we have gross income is about average. Less often we will
developed a relatively simple way to put some have poor yields and poor prices and conversely
numbers around the risk in a farming business. It is we occasionally get high yields and high prices.
based on Excel with an additional program called @ Adjustments can also be made to link events such
Risk (www.palisade.com). Firstly the risky variables as often getting higher prices when yields are poor.
in a business are identified. These are inputs that
Figure 1. Example of the frequency of weekly prices for canola at Adelaide port from 1 July 2003 to 30 June
2016, inflated to June 2016 values. (www.agprice.grainandgraze3.com.au)
2018 CLARE GRDC FARM BUSINESS UPDATE
24We create these distributions through a referred to as the ‘r’ value (or correlation co-
combination of historic information (‘form guides’) efficient). If there is no connection or dependence
and gut feel. I call this ‘framing the odds’. Each between two variables then it is considered a zero
distribution can be customised to suit your location, (0) correlation. If one variable exactly follows the
soil type, frost risk, etc. size and direction of the fluctuations of the other it
is positively correlated and given a value of one (+1).
Not all risks are equal. The computer program
Conversely, if one variable exactly follows the size
enables a comparison between the risky variables.
and direction of the fluctuations of the other, but in
For example, we might have a farm with 20 or so
opposite direction, it is negatively correlated and
distributions but not all of these risks are of equal
given a value of one (-1).
influence to our final profit. Some create more
volatility than others and some are more influential The r value can be broadly classified into
in making or losing large amounts of money. We can ‘strengths’:
identify these and examine the impact because we
• Strong with r greater than ±0.8.
are able to change them. This scenario analysis is
extremely valuable as it enables an understanding of • Medium with an r value between ±0.5 and ±0.8.
the risk implications of large (and small) changes on • Weak with an r value less than ±0.5.
the farming business before we make the changes.
• None with an r value of 0.
Correlations Knowing a weak r value can be just as useful as
One reason for diversifying enterprises is to knowing a strong r value because the weakness
‘decouple’ price and yield movements. We grow implies that there is no connection between the
different commodities so if one fails to produce, two variables, so they should be considered
a different crop or enterprise may still produce independent of each other.
something. How strongly yields and prices are Price correlations for common crops and livestock
linked are referred to as correlations. enterprises are provided (Tables 1 and 2).
Correlations (co- meaning ‘together’ + relation) Correlations can also be easily created between
can be calculated mathematically. The numeric scale enterprises (www.agprice.grainandgraze3.com.au).
used for correlations is 0 to ±1 and is commonly
Table 1. Correlation between common crops (July 2003 to June 2016).
Canola APW wheat Malt barley Feed barley Lentils
Canola 1
APW wheat 0.8 1
Malt barley 0.8 0.8 1
Feed barley 0.7 0.8 0.9 1
Lentils 0.3 0.4 0.4 0.2 1
Table 2. Correlation between sheep enterprises (July 2003 to June 2016).
18u 24u Trade lambs Heavy lambs Mutton Live sheep
18micron 1
24micron 0.5 1
Trade lambs 0.1 0.2 1
Heavy lambs 0.2 0.2 1.0 1
Mutton 0.1 0.0 0.8 0.7 1
Live sheep 0.5 0.5 0.6 0.6 0.8 1
2018 CLARE GRDC FARM BUSINESS UPDATE
25Enterprise mix Figure 2 shows the chances of not making a profit
are 44.5%, with only a 6.7% chance of making more
Changing the enterprise mix, both in the type and
than $400/ha.
scale of these enterprises changes the risk profile
of a business. The following example is for a 1500ha While every farm is different some generalisations
farm in the West Wimmera, but is based on a real on the risk of different enterprise mixes can be
farm. The key values are: made (based on analysis of approximately 40 mixed
farms across Southern Australia).
• 1,000ha heavy soil, 500ha light soil.
• Typical enterprise mix: 40% wheat, 25% barley, Cropping is usually more risky
10% canola, 5% lentils, 5% bean, 15% vetch hay. than livestock
• One manager, 0.5 labour. This is usually true however, risk also includes an
upside as well as a downside risk. If the 500ha of
• Cost reduced by 20% if yield is decile 3 or less light soil was taken out of cropping and livestock
(less nitrogen use). was run on this area instead, then the risk profiles of
• Cost increased by 20% if yield decile 7 or more the two enterprises can be compared (Figure 3).
(greater nitrogen use). This example clearly illustrates the contrasting
• $0.5M debt, 6.5% interest. net income distributions for the cropping enterprise
compared to livestock. The cropping enterprise
• $1.2M in plant and equipment (depreciation is flatter and wider compared with the sheep
at 10%). enterprise, indicating greater volatility in possible
In a second scenario the 500ha of light soil is profits with the cropping enterprise.
in pasture and grazed rather than cropped (self- When the two are combined the addition of
replacing merino ewes at 2.5 ewes/ha). livestock reduces the volatility in farm profits,
Distributions around yields, process and costs although the average income stays roughly the
are created and substituted for average values. This same (Figure 4).
enables a range of values to be generated based Other conclusions from the enterprise mix include:
on the frequency distributions of each risky input. So
rather than just calculating a single profit (after tax) • Intensification (say increasing stocking rate)
value based on averages, a range of profit values generally increases risk.
are determined and represented based on the • Enterprise diversity usually decreases risk.
frequency in which they occur (Figure 2).
• Sheep are usually more risky than cattle.
Figure 2. Profit after tax for a 1500ha West Wimmera cropping farm.
2018 CLARE GRDC FARM BUSINESS UPDATE
26Figure 3. Net farm income from cropping the heavy soil (wide distribution, top numbers in legend) and
livestock on the light soil (narrow distribution, bottom numbers in legend).
Figure 4. Profit after tax for all cropping (wide distribution, top numbers in legend) compared to 1000ha of
cropping and 500ha of sheep (narrower distribution, bottom numbers in legend).
Conclusion References
There is no single way to manage production Keogh M 2013, ‘Global and commercial realities
risk. Many ‘levers’ influence the ultimate risk profile facing Australian grain growers’ in robust cropping
of a business and it is up to the individuals in that systems - the next step. GRDC Grains Research
business to determine and feel comfortable with a Update for Advisers 2013. Bendigo, Vic. pp 13-30.
level of risk that matches the rewards they seek.
Nicholson C 2013, ‘Analysing and discussing risk
Having said this, managing risk requires making in farming businesses’. Extension Farming Systems
decisions. The type of analysis used in Grain and Journal. Vol. 9 (1) Australasia Pacific Extension
Graze provides a very useful platform to inform Network. pp 178-182.
discussion and decisions around risk.
2018 CLARE GRDC FARM BUSINESS UPDATE
27Useful resources
Grain and Graze 3 website
(www.grainandgraze3.com.au)
Acknowledgements
The research undertaken as part of this project
is made possible by the significant contributions
of growers through their support of the GRDC —
the author would like to thank them for their
continued support.
Contact details
Cam Nicholson
Nicon Rural Services
Grain and Graze
cam@niconrural.com.au
Return to contents
2018 CLARE GRDC FARM BUSINESS UPDATE
28Notes
2018 CLARE GRDC FARM BUSINESS UPDATE
29Looking for relevant and freely accessible
information on issues such as crop nutrition,
disease control or stubble management in
20 AUG | 12 AM
your region? Online Farm Trials (OFT) contains
over 4,700 on-farm trial projects from across
Event Address,
Australia on a wide variety of crop management
City, ST
issues andZIP
methods. Use OFT to discover relevant
Code
trial research information and result data and to
share your grains research online.
TITLE OF YOUR EVENT
Grower and farming system groups,
government researchers and industry are
using OFT to manage and share their grains
research online. Upload and publish your trial
research data and reports to OFT to share
information on solutions that address local or
regional issues to increase profitability and
sustainability of farming enterprises.
An embeddable version of the OFT Trial
Explorer, or widget, has been designed for
use on third-party websites. The widget
provides the opportunity to display your trial
Create a Great Flyer
project information on your own websiteLorem
and Ipsum Dolor Lorem Ipsum Dolor
allows users to view other relevant trials from
If you
acrosswant to add
Australia. Visitor To replace a photo,
OFT for more information To try other looks for
remove bullet points first delete the
or to register an interest in managing your trial this flyer, on the
from text, click the existing picture. Then Design tab, check out
information
Bullets buttonwithonOnline
the Farm Trials. use Insert > Picture the Themes, Fonts,
Home tab. to add your own. and Colors galleries.
www.farmtrials.com.au/2018updates @onlinefarmtrial
COMPANY NAME
Address, City, ST ZIP CODE
Telephone | Email Address | Web AddressChoosing and justifying the right sprayer
Brett Symes.
ORM Pty Ltd.
Keywords
decision making, machinery, spray equipment, efficiency.
Take home messages
There are many variables to consider when choosing a sprayer, and each will be weighted
differently from business to business depending on the farming model utilised, (enterprise mix,
farming system, typical rotation, spread of farming operations, etc.), the need or want to optimise
efficiency, and availability of labour and lifestyle decisions. Make sure you get the right horse for
your course regardless of what the neighbour has.
Before upgrading the sprayer there may be options to increase overall efficiency of the
existing sprayer.
The capital invested can be similar between a self-propel (SP) and a tow-behind outfit when
aiming to match field capacity.
Alternative uses for the sprayer, and the likelihood of spraying where higher clearance is
required, are key determinants in type of machine and cost-of- ownership.
Tank size and boom width can sometimes be a trade-offs against spraying speed.
Introduction • Complete post-emergent grass selective
herbicide application early (i.e. before tillering
Choosing the right sprayer and justifying its
of weeds).
ownership cost can be a challenging task. There’s
a lot of variables and trade-offs to consider when • The ability to spray the area of susceptible
making the decision, and the importance of each cereal crop varieties in three days should a
varies from business to business. The sprayer is stem rust incursion break out.
often the most used implement on the farm, and • The ability to get clethodim out within a
therefore, it’s important to get the decision right. 4hr/day ‘window of opportunity’ during
Taking a structured decision making approach can winter to minimise the effect of frost on
help take the stress and uncertainty out of making herbicide efficacy.
this decision.
• The ability to apply herbicides during late
Structured decision making approach stages of crop development (crop-top) to any
crop type with minimal crop damage and good
Step 1. What spraying tasks and timelines do I need spray coverage.
to achieve?
Step 2. What will affect these timelines?
Spraying objectives, or targets around getting
the spraying done on time, can vary considerably Besides physical limitations such as sprayer
from business to business. While often not written clearance height, the ability for your spraying outfit
down, each business usually has a number to meet your spraying objectives in a timely manner,
of ‘spraying objectives’ they aim for to ensure will be influenced by the ‘work rate’ of your sprayer
timeliness of operations. Examples of some spraying inside the paddock and efficiencies impacting on
objectives include: timeliness outside the paddock.
2018 CLARE GRDC FARM BUSINESS UPDATE
31Inside the paddock o Paddock shape, undulation, obstacles (trees,
dams, channels, swamps, etc.) and terrain
Work Rate (Effective field capacity)
(rocks, corrugations) can all limit speed and
The theoretical capacity (ha/hr) of a machine to width (overlap).
perform its work whilst in the paddock is defined as:
• Overall power, gearing, weight and balance
‘Theoretical width of boom (m)
o an underpowered machine will restrict speed
Field = x speed of travel (km/hr)
Capacity’ 10 o inadequate gearing range can affect speed
However, we know that there are factors that o is the machine too heavy for the rainfall zone
affect the ability for a machine to operate at its and soil type, hence may sink?
maximum width or speed at all times, while in the o an unbalanced machine may have a
paddock. Hence the theoretical field capacity of restricted speed
a machine is adjusted down by a factor known as
the Field Efficiency Percentage (FE %), which is the • Downtime
percentage of time the machine operates at its fully o Breakdowns, blocked nozzles; could these
rated speed and width while in the paddock. The be eliminated with better preventative
result is the Effective Field Capacity, or true ‘Work maintenance?
Rate’ that can be used to assess true productivity in
Efficiencies impacting on timeliness outside
the paddock.
the paddock
So; With a spraying outfit, there are significant factors
‘Work Rate’ width of boom (m) outside the paddock that also impact on the overall
(Effective = x speed of travel (km/hr) X FE % timeliness of the spraying operation. These factors
field capacity) 10 can often be improved for low cost regardless of
which spraying outfit you use.
An example is provided in Table 1.
Examples of efficiencies outside the paddock, and
what influences them, include:
Table 1. Calculation of Work Rate.
Units Example • Fill time
Boom width Metres 36m o Pump and hose size (e.g. 1.5” connection to
Spraying speed Kilometres/hour 25km/hr chemical shuttle =60L chemical/min; 4” water
Theoretical field capacity Hectares/hour 90ha/hr hose faster than 3” > 2”, etc.).
Field efficiency Percentage 80% o Induction technology.
Work Rate (Effective field capacity) Hectares/hour 72ha/hr
o Batching plant (often requires additional
labour).
Examples of factors that affect the width or
o Mounted pump.
average speed of the spraying unit whilst in the
paddock include: o Quick fill systems (for example, overhead
water loading, nose connector)
• Water rate limitations (will this limit speed due
to inadequate pump capacity, or nozzle size • Travel time
or number?). o Spread of farming operations and/or distance
• Spray efficacy limitations between paddocks.
o Wind o Road speed (empty and loaded).
o Dust o Block cropping (less clean-outs).
o Technology to allow correct droplet size at o Distance to fill points (versus a ‘nurse tank’
increased speed (e.g. AIM Command®, Three could be used to take water to the sprayer
Tier System (3TS)®). instead, however this may require extra
labour which will be need to be accounted
• Paddock landform and topographic feature for).
limitations
• Clean out time
o Soil type and steepness can affect
trafficability. o Flush technology.
2018 CLARE GRDC FARM BUSINESS UPDATE
32o Block-cropping. Combination:
• Tank size – if tank size is matched to paddock For example, by owning a tow-behind you get
size (subject to weight considerations) this can the alternative use from the tow-tractor and you can
mean less time spent travelling and filling. engage a contractor for the high-clearance spraying.
The consideration for operations, is can you get the
• Breakdowns (lack of preventative
contractor when needed?
maintenance?).
Efficiency factors both inside and outside the Step 4. Ownership & costs – What can I justify?
paddock can be highly variable between farms. Table 2 provides a comparison of different types
Growers should continually ask themselves what of sprayers. In summary however a few features of
could I be doing differently to improve current each type of sprayer are listed. (Note: Less attention
efficiencies, and therefore, overall timeliness of the has been paid to truck mount sprayers given the
operation. limited number operating):
Step 3. What options do I have to achieve 1. Tow-behind
my timelines?
• Handles most applications.
The main options as with most plant and
• Choice of larger tank sizes.
machinery is self-ownership, use of contractors, or
a combination of the two. The key questions to ask • Clearance issues late in season.
with respect to each include:- • Multiple alternative uses for towing tractor.
Self ownership:
1. Do you need: 2. Truck or tractor mount
• Alternative uses – am I looking for a • Fastest road speed full or empty.
dedicated spraying outfit or do I also need a
‘third’ tractor (for example, front end loader • Choice of larger tank sizes.
(FEL), spreader or chaser tractor), or self- • Clearance issues late in season.
propel (SP) that can be used for windrowing
also? An alternative use can effectively • Visuals sometimes compromised.
subsidise the cost of ownership of a machine. • Limited alternative use.
• Clearance height – what’s the likelihood of
needing to spray where higher clearance
3. Self-propel
is required (for example, taller crop types
(e.g. canola, sorghum/corn) or late season • Great clearance - specifically designed
applications (e.g. fungicides/insecticides/ for spraying hence suitable for all spray
desiccation/crop-topping, late season liquid applications.
N)). If likely, are contractors available if you • Great traction.
haven’t got the clearance?
• Best comfort.
2. What can I afford? (refer later section)
• Superior visuals.
Contractor:
• Good road speed.
Contractors usually come with the latest and
greatest machines, which can usually handle all • Modern technology (for example, AIM
applications and are modern, economically justified Command®).
machines due to the area that they cover which • Higher fuel use (hydrostat).
increases the utilisation of the equipment. Are you
confident you can get them in a timely manner and • Limitations on tank size.
not compromise productivity? Is it cost effective to • Limited alternative use.
own your machine? (refer later section)
2018 CLARE GRDC FARM BUSINESS UPDATE
33Table 2. Comparison of different types of sprayers.
Tow-behind (and front
Truck/tractor mount Self-propel (SP)
wheel assist (FWA))
Travel speed Empty 40km (up to 70km) 80km 50km (up to 70km)
Full 25-30km 80km 30-40km
Working spray speed Mallee 20km 25km (25-30)
Mid North 18km 25km
South East 15-17km 20-22km (20-26)
Rule of thumb: SP 6kph faster
Spray applications Clearance issues Clearance issues All (incl. late season fungicides/
late in season late in season insecticides/desiccants)
Indicative late season sprays Depends on farming system, rotation and season. Apply your own probabilities
(e.g. Mallee client 8% (insecticide/fungicide in field peas, lupins, canola; desiccate field
peas, spray-topping canola and some cereals)
Traction Good (FWA) Good (4WD) Better (2WD)
Alternative uses FEL, ‘3rd’ tractor – Limited (liquid N) Limited (liquid N, windrowing -
chaser, spreader front mount)
Fill time 40min (pers. comm.) 25min (pers. comm.)
Visuals Good Good (can be limited Great (behind – same as tow-behind;
by tank and lower front and down – superior)
seating position)
Tank size Most 7-9kL Most 5 – 6.2kL
(Up to 10kL) (Hardi Rubicon now 6,500L. Up to
8kL – Goldacres G8 Super Cruiser –
less clearance)
Operator comfort (ride, control, OHS) Good Good Superior
Agility (e.g. backing into corners) Harder (articulation) Medium Easy
Fuel use 10-14L/hr Hydrostat – 21-25L/hr
Mechanical – 10-14L/hr
Rule of thumb: Hydrostat SP 2 x fuel use
Other Cutting tracks – can widen wheels so
back track different to front
Proactive integrated weed management
- got it so can do it, don’t have to wait
for contractors or cost their service
Justifying an investment in a machine is a balance ☐ Obsolete model or technology.
of financial and non-financial considerations.
☐ Access to parts.
The primary financial consideration is cost of
☐ Poor condition.
ownership, which will be influenced by:
o New technology – the sky’s the limit so be
• Capital cost (i.e. the loss in value of the machine
critical on what you really need. For example,
each year, plus the appreciation in value of
do I need auto-height, auto-greaser, etc.?
its replacement and an allowance for the
opportunity cost of the money invested into o No-trade discount.
purchasing the machine which could have been o Factory incentives.
invested via another means). This ‘changeover’
cost can be 35-40% of the total cost, so o Exchange rate.
keeping it to a minimum has a big influence o Poor reputation.
on overall ownership cost. Factors that affect
changeover cost include: o Poor dealer support.
o Engine hours on trade. Some growers have a defined policy around
changeover time based on engine hours (for
o Age of trade example, 2000 hours), age (for example, 5 years old)
2018 CLARE GRDC FARM BUSINESS UPDATE
34Table 3. Some ‘actual’ variations in capital cost of SP sprayers sold within various regions of Victoria (Source: ORM Pty Ltd).
Wimmera Western District North Central
Age (years) 5 4 3.6
Changeover price ($) 205,000 192,000 142,000
Engine hours 2,000 1,950 2,550
Hours per year 400 488 676
Changeover (depreciation)/year ($) 42,000 48,000 39,628
Changeover (depreciation)/Eng. hr ($) 103 98 56
or model (for example, within one model of current • Interest and/or expertise in machinery –
model). Whereas others will keep an active eye on sometimes it’s easier to let the contractor worry
the market and buy whenever the price is right (for about ownership issues and access to labour,
example, Wimmera grower in Table 3 will upgrade and get the latest and greatest technology turn
whenever changeover is < $100/eng.hr). up each year.
The full scale of financial benefits of ownership, • Attracting and retaining employees – varies
needs to be evaluated as an offset to the costs, between regions.
these benefits will be driven by the following factors:
• No financial pressure.
• Field capacity and field and non-field
• Family time.
efficiencies, as outlined in Step 1.
• Stress – being able to get the contractors when
• Alternative uses for machine - can ‘subsidise’
you want them.
the sprayer costs.
• OHS
• The percentage of spraying needed to be done
by contractors. Non-financial considerations are harder to
quantify than financial considerations. Each grower
• Other fixed costs (interest, rego/insurance) –
has to put their own weighting and dollars on these
can be up to 25% of total costs which is a big
variables depending on their personal preferences.
contributor.
In regards to timing, sometimes a decision to
• Fuel usage – hydrostat SP can use double the
upgrade can be justified based on a simple cost :
amount of a tow-behind, but overall fuel cost is
benefit analysis, but there may be other immediate
influenced by field capacity and field efficiency.
priority uses for that capital or existing financial
• Labour cost – dependent on machine hours. commitments that already limit cash flow. Some
useful overall machinery investment benchmarks to
• Scale – spread of costs (particularly the fixed
consider include:
costs) over area sprayed per annum ($/ha).
• Alternative/priority uses for capital – i.e. what
When assessing cost of ownership, it is advisable
other ‘big-ticket’ items are coming due for an
to compare it to the cost of using a contractor.
upgrade and will investing a certain amount of
Once this comparison has been made an informed
capital in improving your spraying capacity limit
assessment can be made as to whether ownership
you from getting the balance and timeliness
is cost-effective. The final decision will however also
right in other areas?
be impacted by non-financial considerations and the
timing of the planned upgrade. • Overall capital invested in machinery – ORM
benchmarking show that the typical investment
Non-financial considerations include:
in machinery is $1 for every $1 of income
• Job satisfaction – the sprayer is the most widely generated, or a ratio of 1:1. Some businesses
used implement on farm, operator comfort, can maintain a 0.8:1 ratio without compromising
health considerations (e.g. bad back) should be timeliness, which means in a farm business
considered. generating $1,000,000 income, $200,000 of
capital can be invested elsewhere.
2018 CLARE GRDC FARM BUSINESS UPDATE
35You can also read