Clear path to cash flow with exploration upside in Newfoundland & Labrador, Canada - TSXV: MAE - Maritime Resources Corp.
←
→
Page content transcription
If your browser does not render page correctly, please read the page content below

TSXV: MAE

     Clear path to cash flow with exploration upside in
     Newfoundland & Labrador, Canada

     Corporate Presentation
     February 2022
TSXV: MAE
                                                                      1
CAUTIONARY STATEMENT

            Certain information included in this presentation, including information relating to future financial or operating performance and other statements that express the expectations of
            management or estimates of future performance constitute “forward-looking statements”. Such forward-looking statements include, without limitation, statements regarding copper, gold
            and silver forecasts, the financial strength of the Company, estimates regarding timing of future development and production and statements concerning possible expansion opportunities
            for the Company. Where the Company expresses or implies an expectation or belief as to future events or results, such expectation or belief are based on assumptions made in good faith
            and believed to have a reasonable basis. Such assumptions include, without limitation, the price of and anticipated costs of recovery of, copper concentrate, gold and silver, the presence of
            and continuity of such minerals at modeled grades and values, the capacities of various machinery and equipment, the availability of personnel, machinery and equipment at estimated
            prices, mineral recovery rates, and others. However, forward-looking statements are subject to risks, uncertainties and other factors, which could cause actual results to differ materially
            from future results expressed, projected or implied by such forward-looking statements. Such risks include, but are not limited to, interpretation and implications of drilling and geophysical
            results; uncertainty as to whether mineral resources will ever be converted into mineral reserves once economic considerations are applied, uncertainty as to whether inferred mineral
            resources will be converted to the measured and indicated categories through further drilling, or into mineral reserves, once economic considerations are applied, estimates regarding
            timing of future capital expenditures and costs towards profitable commercial operations, estimates regarding timing of future capital expenditures and costs towards profitable commercial
            operations. Other factors that could cause actual results, developments or events to differ materially from those anticipated include, among others, the ability of the Company to continue to
            be able to access the capital markets for the funding necessary to acquire, maintain and advance exploration properties or business opportunities; global financial conditions, including
            market reaction to the coronavirus outbreak; competition within the industry to acquire properties of merit or new business opportunities, and competition from other companies possessing
            greater technical and financial resources; difficulties in advancing towards a development decision at Hammerdown and executing exploration programs at its Newfoundland and Labrador
            properties on the Company’s proposed schedules and within its cost estimates, whether due to weather conditions, availability or interruption of power supply, mechanical equipment
            performance problems, natural disasters or pandemics in the areas where it operates, increasingly stringent environmental regulations and other permitting restrictions or maintaining title or
            other factors related to exploring of its properties, such as the availability of essential supplies and services; volatility in metals prices and demand; currency fluctuations; cash operating
            margins; cash operating cost per pound sold; costs per ton of ore; variances in ore grade or recovery rates from those assumed in mining plans; reserves and/or resources; the ability to
            successfully integrate acquired assets; operational risks inherent in mining or development activities and legislative factors relating to prices, taxes, royalties, land use, title and permits,
            importing and exporting of minerals and environmental protection. Accordingly, undue reliance should not be placed on forward-looking statements and the forward- looking statements
            contained in this press release are expressly qualified in their entirety by this cautionary statement. The forward-looking statements contained herein are made as at the date hereof and
            the Company does not undertake any obligation to update publicly or revise any such forward-looking statements or any forward-looking statements contained in any other documents
            whether as a result of new information, future events or otherwise, except as required under applicable security law. Larry Pilgrim, P.Geo. is the Qualified Person responsible for the
            technical content of this presentation.

            For further information about the technical information and drilling results described herein, please see the National Instrument 43-101 – Standards of Disclosure for Mineral Projects
            compliant technical report prepared by WSP dated effective April 15, 2020, titled “Hammerdown Gold Project, Newfoundland and Labrador, Preliminary Economic Assessment” filed on
            SEDAR under the Company's issuer profile at www.sedar.com

TSXV: MAE
                                                                                                                                                                                                                2
Maritime Resources - Investment Highlights
                ❖   Hammerdown Gold Project
                     •   High grade brownfields development
                     •   2020 PEA1 confirmed an attractive 50-70k oz/y project
                         with $154M NPV and 65% IRR at US$1500/oz
                     •   Nugget Pond gold circuit acquired in 2021
                     •   Released from Provincial Environmental Assessment
                     •   Feasibility study and remaining permitting underway

                ❖   40,000m Exploration Program
                     •    Largest drill program in the Company’s history
                     •    Near mine expansion opportunities over 10 km trend
                     •    Large 400 km2 land package – newly identified
                          epithermal and porphyry mineralization

                ❖   $4.0M of working capital, no debt

TSXV: MAE
                                                                                 3
Baie Verte Mining District
            Competitive Advantage

            •   Currently 2 operating mines and 2 mineral
                processing plants in the Baie Verte district

            •   Multiple gold and copper development projects

            •   Roads, grid power, port facilities

            •   Skilled labour, suppliers, contractors, services

            •   Newfoundland & Labrador - Top Tier jurisdiction –
                ranked among Top Ten Jurisdictions for Mining in
                “Investment Attractiveness Index” by Fraser
                Institute

TSXV: MAE
                                                                    4
HAMMERDOWN GOLD PROJECT
            King’s Point, NL

             •   Former high grade underground gold mine
                 operated by Richmont Mines (2000-2004)

             •   Produced 143,000 oz @ 15.8 gpt Au

             •   Operated during US$300/oz gold prices with a
                 cut off grade of 8.2 gpt Au

             •   Gold recoveries of +95% at the Nugget Pond
                 gold plant

TSXV: MAE
                                                                5
Preliminary Economic Assessment (PEA)

            2020 PEA Study Highlights                                             Annual Au oz & Milled Au gpt
                                                                                              90,000                                                                  12.00

            •      Production                50-70k oz/y Au over 9 years                      80,000
                                                                                                                                                                      10.00
                                                                                              70,000

                                                                                                                                                                              Mill Grade Au gpt
            •      Capex                     $57M initial capital                             60,000                                                                  8.00

                                                                                  Au ounces
                                                                                              50,000
            •      AISC                      US$938/oz Au                                                                                                             6.00
                                                                                              40,000

            •      Economics                 $156M NPV5% , 65% IRR (US$1500/oz)               30,000                                                                  4.00
                                                                                              20,000
                                             $257M NPV5% , 97% IRR (US$1800/oz)               10,000
                                                                                                                                                                      2.00

                                                                                                  -                                                                   0.00
                                                                                                          1       2        3   4      5        6     7      8    9
                                                                                                                                     Year

                Hammerdown Mineralized Veins
                Measured (red), Indicated (yellow), Inferred (blue)                     NI 43-101 Resource Estimate (2020)1,2

                                                                                              Hammerdown                           Tonnes          Au gpt       Au oz
                                                                                               Measured & Indicated                1,057,500        9.17        311,800
                                                                                               Inferred                            1,307,600        4.51        189,600

                                                                                               Orion                               Tonnes          Au gpt        Au oz
                                                                                               Indicated                           1,816,400        3.58        209,300
                                                                                               Inferred                            1,921,300        4.48        276,600
                                                                                              1. See Appendix for notes.

TSXV: MAE
                                                                                                                                                                                                  6
2020 PEA Hammerdown Site Plan
            ORION DEPOSIT
            • Pit: 0.6 Mt @ 2.38 gpt Au
            • Strip ratio: 8.4 : 1
            • UG: 1.7 Mt @ 3.86 gpt Au
                                                                      HAMMERDOWN DEPOSIT
                                                                      • Pit: 1.9 Mt @ 4.23 gpt Au
                                                                      • Strip ratio: 15.3: 1
                                                                      • UG: 0.2 Mt @ 7.58 gpt Au
              WASTE ROCK STOCKPILE
              (Non acid generating)

                                                                                        CRUSHING & SORTING PLANT

             SORTING DESIGN
             • XRAY sensing of pyrite mineralization
             • 50% rejection of ROM feed with 95% gold recovery                                               HWY 391 &
             • 2 sorters producing 700 tpd of mill feed                                                       Power line
             • Reduced truck traffic, GHG emissions and operating costs             Existing access road

TSXV: MAE
                                                                                                                           7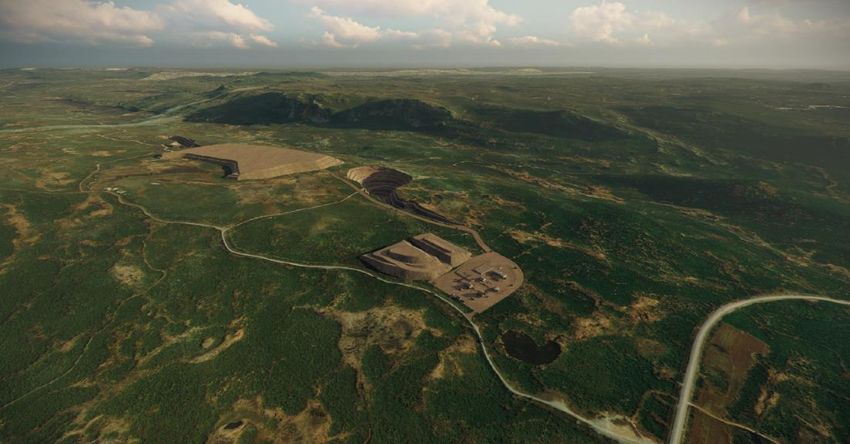
Nugget Pond Gold Plant

                                              Copper concentrator

                                 Gold plant

                                                      •   Idle CIP gold circuit, last run 2013

                                                      •   Historic gold recoveries of +95%

                                                      •   Permitted tailings storage facility

TSXV: MAE
                                                                                                 8
Project Schedule & Milestones

                 Assays received
                 Resource update
                 Technical programs     Assays received       Feasibility study    Construction decision
                 Project permitting     Technical programs    Project permitting   Engineering, procurement
                 Early works clearing   Feasibility study     Project financing    Construction start         Expected Production

                   Q4 2021                Q1 2022                   Q2 2022             Q3/4 2022                     2023

             The next 12 months will focus on project de-risking and permitting:

             ✓ Acquisition of the Nugget Pond gold circuit
             ✓ Release from Environmental Assessment
             ✓ Early works permits for initial site clearing
             ▪     Feasibility Study and project permitting – currently underway

             ▪     Construction decision, project financing

TSXV: MAE
                                                                                                                                    9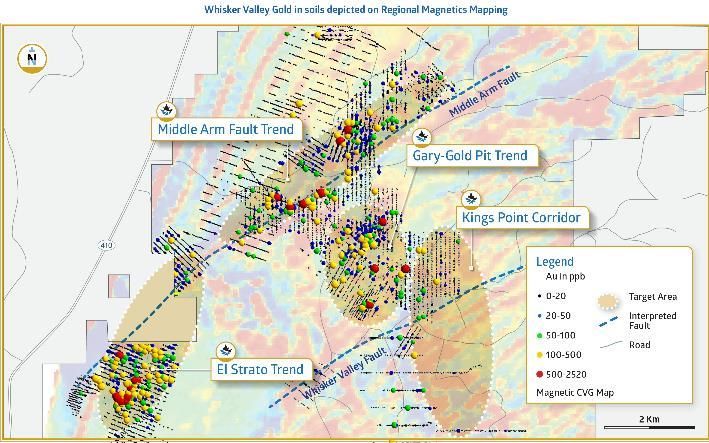
ESG Focus
            Environmental Benefits
            • No species at risk or fisheries habitat
            • Brownfields mine site with existing access
            • Existing gold processing plant and TSF
            • Non-acid generating waste rock products
            • Ore sorting technology to reduce GHG emissions
            • Hydro power available only 500m from project

            Community Engagement
            • Local communities involved early in the project
            • History of mining in the area and skilled labour
            • Supporting education initiatives with local school
            • Working with area cabin owners/outfitter to ensure
              continued safe access to road system
            • Waste rock products from mine to be made available
              for local uses (e.g. marina development)

TSXV: MAE
                                                                   10
Regional Exploration Potential
Large 400 km2 land package with
several major fault structures
Three primary exploration areas;
1. Green Bay area hosts multiple
gold deposits and targets
including Hammerdown & Orion
along a 10 km long trend
2. Whisker Valley is emerging as a
new epithermal / porphyry target
with Cripple Creek similarities
3. Gull Ridge is a greenfields
gabbro intrusion with precious
metal and Ni-Cu-PGM targets
TSXV: MAE
11Green Bay Area – Near Mine Exploration Potential
• 10 km trend of gold and base
metals deposits and targets
• Multiple untested fold
structures
• Limited drilling outside of
known deposits – a history of
underinvestment in drilling
• Located minutes from existing
infrastructure and services
• Opportunities to leverage
future ore sorting plant in hub
& spoke model to reduce
haulage and GHG emissions
TSXV: MAE
12Hammerdown / Orion near mine targets
• 5 km long trend along the
Hammerdown and Orion deposits
• Limited drilling outside of these
deposits by previous companies
• Richmont – focused on mining
• Hudbay – focused on copper
• Step out drilling in 2021 identified
extensions to the Orion deposit
towards Hammerdown
• Hammerdown veins extend towards
the northeast
• 2022 focus is on brownfields
exploration and resource growth
proximal to Hammerdown
TSXV: MAE
13Whisker Valley – Gold Trends
A. El Strato Trend: Shear-hosted quartz-carbonate
vein systems associated with the Baie Verte and
Middle Arm Fault systems
B. Middle Arm Fault Trend: quartz-sulfide vein
systems associated with the Middle Arm Fault
system
C. Gary-Gold Pit Trend: Dike-controlled quartz-
sulfide vein systems hosted within the Burlington
intrusive complex
D. Kings Point Corridor: low sulfidation epithermal
and Cu-Au porphyry type mineralization in an
alkalic subaerial caldera complex
Whisker Valley Property Map depicting Magnetics Calculated Vertical Gradient, Au-Anomalies in Soils greater
than 25ppb (Colour Bar depicts Au grade in ppb), roads, topography, Lakes and streams
TSXV: MAE
14Whisker Valley – New high grade mineralization across 1.5 km
309.0 gpt Au – Jackson Vein
GOLD PIT - OUTCROP
37.2 gpt Au, 39.7 gpt Ag, 1.3% Cu
FLOAT SAMPLE
75.8 gpt Au, 35.2 gpt Ag, 0.75% Cu
WH-12-20 @ 150m depth
6.2 gpt Au / 5.8m incl.
• 22.4 gpt Au / 0.5m and,
• 11.7 gpt Au / 2.1m 100.5 gpt Au, 222 gpt Ag, 1.5% Cu
GARY VEIN – OUTCROP
100.5 gpt Au, 222 gpt Ag, 1.5% Cu
JACKSON VEIN – GRAB SAMPLE
309 gpt Au
WH-18-03
16.0 gpt Au / 0.97m incl.
TSXV: MAE 36.6 gpt Au / 0.40m
15Lac Pelletier Project – Rouyn Noranda, QC
• Located in the heart of the Abitibi Greenstone Belt
• High grade shear hosted quartz veins, open in all
directions. Located 2 km north of the Cadillac fault
• 2010 resource to 200m depth @ 5.5 gpt Au cut off
• 16k oz @ 8.63 gpt Au (Measured)
• 61k oz @ 8.61 gpt Au (Indicated)
• 113k oz @ 8.37 gpt Au (Inferred)
• Adjacent to historic Stadacona Mine - 2.8 Mt @ 5.4 gpt Au
mined to a depth of over 1,200m
• 3,300 m of underground development in place
• 3 bulk samples with gold recoveries ~ 96%
• Provincial Certificate of Authorization for 1,000 tpd of
direct ship mine production
• Pt & Pd group elements (PGE) potential – 9.3 gpt 2PGE
over 6.0 m and 2.1 gpt 2PGE over 62.3m in a gabbro
intrusion on west side of property
TSXV: MAE
16Corporate Structure Ownership
Shares Outstanding 399.4 M
Options 25.8 M
7.2 M
• 3.1M @ $0.15 (Aug 2022)
Warrants
• 2.3M @ $0.18 (Mar 2023)
• 1.8M @ $0.18 (Apr 2023)
Fully Diluted 432.5 M
52 Week High/Low $0.23 / $0.11
Market Capitalization $50M
Working Capital $4.0M
Debt nil
Retail Insiders Institutions
Analyst Coverage
Firm Analyst Rating Target Price
Sprott Capital Partners Justin Chan Buy $0.30
iA Securities George Topping Buy $0.30
TSXV: MAE
17Maritime Team
Average +25 years of experience in mine operations, project development, exploration and capital markets
MANAGEMENT TEAM BOARD OF DIRECTORS
GARETT MACDONALD MBA, P.Eng. PRESIDENT & CEO JOHN HAYES MSc., MBA , P.Geo. CHAIR
New Gold, Rainy River Resources, Suncor Energy and Placer Dome BMO Capital Markets, Osisko Mining and Pretium Resources
GERMAINE COOMBS CPA, CMA CHIEF FINANCIAL OFFICER MARK ASHCROFT MSc., P.Eng.
Aurelius Minerals, Stonegate Agricom, FNX and Iron Ore Company of Canada Aurelius Minerals, Stonegate Agricom, Versant Partners and Toll Cross Securities
PERRY BLANCHARD VP, ENVIRONMENT & SUSTAINABILITY GARETT MACDONALD MBA, P.Eng.
Detour Gold, Kirkland Lake Gold and Vale New Gold, Rainy River Resources, Suncor Energy and Placer Dome
LARRY PILGRIM P.Geo. NL PROJECT MANAGER NICK NIKOLAKAKIS BASc, MBA
Rambler Metals & Mining, Richmont Mines Battle North Gold Corporation. Rainy River Resources, Barrick and Placer Dome
TANIA BARRETO CPIR HEAD OF INVESTOR RELATIONS TOM YIP CPA, BBA
Detour Gold, Primero Mining, Roxgold and Golden Star Resources Pretium Resources and Silver Standard (now SSR Mining)
LORNA MACGILLIVRAY CORPORATE SECRETARY
Aurelius Minerals, Stonegate Agricom, Thompson Creek Metals
TECHNICAL ADVISORS
JEREMY NIEMI P.Geo. EXPLORATION / GEOLOGY ERIC TREMBLAY Ing. MINING / PROJECT DEVELOPMENT
Aurelius Minerals, GoldQuest, Noront Resources and Kinross Dalradian Resources, Osisko Mining and IAMGOLD
TSXV: MAE
18Maritime Resources – The Newfoundland Advantage
HAMMERDOWN
GOLD PROJECT
Newfoundland and
Labrador, extremely
ESG mining friendly EXPLORATION
A CORE AND jurisdiction Strong upside, with
PROVEN FOCUS several untested
Community targets over a 400 km2
Environment land package
Jurisdiction
LAC PELLETIER STRONG
GOLD PROJECT INSTITUTIONAL
Strategic asset, in SUPPORT
favorable jurisdiction Dundee Goodman
1832 Asset Management
Sprott
Tembo
Crescat
TSXV: MAE
19Toronto Office Newfoundland & Labrador Office
1900 - 110 Yonge St. 2 Industrial Park
TSXV: MAE
Toronto, ON M5C 1T4 Springdale, NL A0J 1T0
(416) 365-5321 (709) 701-8515
Garett Macdonald, MBA, P.Eng.
President & CEO
Tania Barreto, CPIR
Head of Investor Relations
www.maritimeresourcescorp.com
CONTACT
TSXV: MAE info@maritimegold.com
20End Notes
Note 1. The Hammerdown Gold Project, Newfoundland and Labrador Preliminary Economic Assessment technical report (the “PEA Technical
Report”) was filed on SEDAR under the Company's profile on April 15, 2020, in accordance with National Instrument 43-101 – Standards of
Disclosure for Mineral Projects (“NI 43-101”). The PEA Technical Report is intended to be read as a whole, and sections should not be read or
relied upon out of context. A copy of the PEA Technical Report is also available on the Company’s website (www.maritimeresourcescorp.com).
Larry Pilgrim, P.Geo. Project Manager for Maritime Resources, is the Qualified Person within the meaning of NI 43-101 for the Company and
has prepared and approved the technical and scientific content of this news release, and as reviewed and validated that the information in this
press release is consistent with that provided by the Qualified Persons responsible for the PEA Technical Report.
*Cautionary Statement: The reader is advised that the PEA Technical Report referenced in this press release is preliminary in nature and is
intended to provide only an initial, high-level review of the Project potential and design options. Readers are encouraged to read the PEA
Technical Report in its entirety, including all qualifications and assumptions.
The PEA mine plan and economic model include numerous assumptions and the use of Inferred Resources. Inferred Resources are considered
to be too speculative geologically to have the economic considerations applied to them that would enable them to be categorized as mineral
reserves and to be used in an economic analysis except as allowed for by NI 43-101 in PEA studies. There is no guarantee that the PEA mine
plan and economic model will be realized, and that Inferred Resources can be converted to Indicated or Measured Resources. Mineral
resources that are not mineral reserves do not have demonstrated economic viability. As such, there is no guarantee the Project economics
described herein will be achieved.
TSXV: MAE
212020 Mineral Resource Estimate Note 2
Hammerdown and Orion Open Pit Mineral Resource Summary
Resource Classification Cut-off Deposit Tonnes Gold (g/t) Gold oz
Measured 1.0 g/t Hammerdown 284,600 11.75 107,500
Indicated 1.0 g/t Hammerdown 739,100 8.17 194,100
Measured & Indicated 1.0 g/t Hammerdown 1,023,700 9.16 301,600
Inferred 1.0 g/t Hammerdown 538,400 4.89 84,700
Inferred Intervein 1.0 g/t Hammerdown 321,700 4.18 43,200
Indicated 1.0 g/t Orion 698,400 2.96 66,400
Inferred 1.0 g/t Orion 483,400 5.04 78,300
Total Measured 1.0 g/t Hammerdown & Orion 284,600 11.75 107,500
Total Indicated 1.0 g/t Hammerdown & Orion 1,437,500 5.64 260,500
Total Measured & Indicated 1.0 g/t Hammerdown & Orion 1,722,100 6.65 368,000
Total Inferred (incl. Intervein) 1.0 g/t Hammerdown & Orion 1,343,500 4.77 206,200
Hammerdown and Orion Underground Mineral Resource Summary
Resource Classification Cut-off Deposit Tonnes Gold (g/t) Gold oz
Measured 2.0 g/t Hammerdown 3,800 9.74 1,200
Indicated 2.0 g/t Hammerdown 30,000 9.36 9,000
Measured & Indicated 2.0 g/t Hammerdown 33,800 9.41 10,200
Inferred 2.0 g/t Hammerdown 316,200 4.46 45,300
Inferred Intervein 2.0 g/t Hammerdown 131,300 3.89 16,400
Indicated 2.0 g/t Orion 1,118,000 3.97 142,900
Inferred 2.0 g/t Orion 1,437,900 4.29 198,300
Total Measured 2.0 g/t Hammerdown & Orion 3,800 9.74 1,200
Total Indicated 2.0 g/t Hammerdown & Orion 1,148,000 4.11 151,900
Total Measured & Indicated 2.0 g/t Hammerdown & Orion 1,151,800 4.13 153,000
Total Inferred (incl. Intervein) 2.0 g/t Hammerdown & Orion 1,885,400 4.29 260,000
The Resource Estimate was prepared by Todd McCracken, P.Geo. of WSP Canada, Sudbury, ON.. Mr. McCracken is a qualified person and independent of the Company, as defined by section 1.5 of NI 43-101. Mineral resources
that are not mineral reserves do not have demonstrated economic viability. Mineral resource estimates do not account for mineability, selectivity, mining loss and dilution. These mineral resource estimates include inferred mineral
resources that are considered too speculative geologically to have economic considerations applied to them that would enable them to be categorized as mineral reserves. There is also no certainty that these inferred mineral
resources will be converted to the measured and indicated categories through further drilling, or into mineral reserves, once economic considerations are applied.
TSXV: MAE
222020 Mineral Resource Estimate
Note 2.
Key Assumptions, Parameters, and Methods related to the Mineral Resource Estimates:
1. Mineral Resources were prepared in accordance with NI 43-101 and the CIM Definition Standards (2014). Mineral Resources that are not mineral reserves do not have demonstrated
economic viability.
2. This estimate of Mineral Resources may be materially affected by environmental, permitting, legal, title, taxation, sociopolitical, marketing, or other relevant issues.
3. Open pit Mineral Resources are reported at a cut-off grade of 1.0 g/t gold that is based on a gold price of US$1,500/oz.
4. Underground Mineral Resources are reports at a cut-off grade of 2.0 g/t gold that is based on a gold price of US$1,500/oz.
5. Appropriate mining costs, processing costs, metal recoveries, and inter ramp pit slope angles were used to generate the pit shell.
6. Rounding may result in apparent summation differences between tonnes, grade, and contained metal content.
7. Tonnage and grade measurements are in metric units. Contained gold ounces are in troy ounces.
8. Composites completed at 0.5 m down the hole.
9. Contributing assay composites were capped at 125.00 g/t Au at Hammerdown and 23.88 g/t Au at Orion.
10. A specific gravity value of 2.84 was applied to all blocks.
11. Modeling for Hammerdown was performed use in GEOVIA Surpac 2019 software with grades estimated using ordinary kriging (OK) interpolation methodology. Orion modeling was
performed using Datamine software with grades estimated using ordinary kriging (OK) interpolation methodology.
12. Blocks are 2.5m x1.0m x 2.5m with no sub-blocks.
The Mineral Resource estimate is based on the combination of geological modeling, geostatistics and conventional block modeling using the Ordinary Krig method of grade interpolation.
The geological model including mineralized intercepts was generated by Maritime personnel and then audited by WSP. The QA/QC protocols and corresponding sample preparation and
shipment procedures have been reviewed by WSP.
The Hammerdown Mineral Resource estimate was based on 56,533 metres in 468 surface drill holes, 12,551 metres in underground drill holes and 110 surface trenches totaling 298
metres. The Orion Mineral Resource estimates are based on 15,357 metres in 56 surface drill holes.
At a long-term metal price of US$1,500 per ounce, reasonable prospects are considered to exist for eventual economic extraction of Mineral Resources defined at a 1.0 g/t Au cut-off value
within limits of the conceptual final pit shell prepared by AGP. Additional resources are considered to exist for eventual economic extraction of the Mineral Resource as defined at a 2.00 g/t
Au cut-off below the conceptual pit shell.
TSXV: MAE
23End Notes
Note 1. The Hammerdown Gold Project, Newfoundland and Labrador Preliminary Economic Assessment technical report (the “PEA Technical
Report”) was filed on SEDAR under the Company's profile on April 15, 2020, in accordance with National Instrument 43-101 – Standards of
Disclosure for Mineral Projects (“NI 43-101”). The PEA Technical Report is intended to be read as a whole, and sections should not be read or
relied upon out of context. A copy of the PEA Technical Report is also available on the Company’s website (www.maritimeresourcescorp.com).
Larry Pilgrim, P.Geo. Project Manager for Maritime Resources, is the Qualified Person within the meaning of NI 43-101 for the Company and
has prepared and approved the technical and scientific content of this news release, and as reviewed and validated that the information in this
press release is consistent with that provided by the Qualified Persons responsible for the PEA Technical Report.
*Cautionary Statement: The reader is advised that the PEA Technical Report referenced in this press release is preliminary in nature and is
intended to provide only an initial, high-level review of the Project potential and design options. Readers are encouraged to read the PEA
Technical Report in its entirety, including all qualifications and assumptions.
The PEA mine plan and economic model include numerous assumptions and the use of Inferred Resources. Inferred Resources are considered
to be too speculative geologically to have the economic considerations applied to them that would enable them to be categorized as mineral
reserves and to be used in an economic analysis except as allowed for by NI 43-101 in PEA studies. There is no guarantee that the PEA mine
plan and economic model will be realized, and that Inferred Resources can be converted to Indicated or Measured Resources. Mineral
resources that are not mineral reserves do not have demonstrated economic viability. As such, there is no guarantee the Project economics
described herein will be achieved.
TSXV: MAE
242020 Mineral Resource Estimate Note 2
Hammerdown and Orion Open Pit Mineral Resource Summary
Resource Classification Cut-off Deposit Tonnes Gold (g/t) Gold oz
Measured 1.0 g/t Hammerdown 284,600 11.75 107,500
Indicated 1.0 g/t Hammerdown 739,100 8.17 194,100
Measured & Indicated 1.0 g/t Hammerdown 1,023,700 9.16 301,600
Inferred 1.0 g/t Hammerdown 538,400 4.89 84,700
Inferred Intervein 1.0 g/t Hammerdown 321,700 4.18 43,200
Indicated 1.0 g/t Orion 698,400 2.96 66,400
Inferred 1.0 g/t Orion 483,400 5.04 78,300
Total Measured 1.0 g/t Hammerdown & Orion 284,600 11.75 107,500
Total Indicated 1.0 g/t Hammerdown & Orion 1,437,500 5.64 260,500
Total Measured & Indicated 1.0 g/t Hammerdown & Orion 1,722,100 6.65 368,000
Total Inferred (incl. Intervein) 1.0 g/t Hammerdown & Orion 1,343,500 4.77 206,200
Hammerdown and Orion Underground Mineral Resource Summary
Resource Classification Cut-off Deposit Tonnes Gold (g/t) Gold oz
Measured 2.0 g/t Hammerdown 3,800 9.74 1,200
Indicated 2.0 g/t Hammerdown 30,000 9.36 9,000
Measured & Indicated 2.0 g/t Hammerdown 33,800 9.41 10,200
Inferred 2.0 g/t Hammerdown 316,200 4.46 45,300
Inferred Intervein 2.0 g/t Hammerdown 131,300 3.89 16,400
Indicated 2.0 g/t Orion 1,118,000 3.97 142,900
Inferred 2.0 g/t Orion 1,437,900 4.29 198,300
Total Measured 2.0 g/t Hammerdown & Orion 3,800 9.74 1,200
Total Indicated 2.0 g/t Hammerdown & Orion 1,148,000 4.11 151,900
Total Measured & Indicated 2.0 g/t Hammerdown & Orion 1,151,800 4.13 153,000
Total Inferred (incl. Intervein) 2.0 g/t Hammerdown & Orion 1,885,400 4.29 260,000
The Resource Estimate was prepared by Todd McCracken, P.Geo. of WSP Canada, Sudbury, ON.. Mr. McCracken is a qualified person and independent of the Company, as defined by section 1.5 of NI 43-101. Mineral resources
that are not mineral reserves do not have demonstrated economic viability. Mineral resource estimates do not account for mineability, selectivity, mining loss and dilution. These mineral resource estimates include inferred mineral
resources that are considered too speculative geologically to have economic considerations applied to them that would enable them to be categorized as mineral reserves. There is also no certainty that these inferred mineral
resources will be converted to the measured and indicated categories through further drilling, or into mineral reserves, once economic considerations are applied.
TSXV: MAE
252020 Mineral Resource Estimate
Note 2.
Key Assumptions, Parameters, and Methods related to the Mineral Resource Estimates:
1. Mineral Resources were prepared in accordance with NI 43-101 and the CIM Definition Standards (2014). Mineral Resources that are not mineral reserves do not have demonstrated
economic viability.
2. This estimate of Mineral Resources may be materially affected by environmental, permitting, legal, title, taxation, sociopolitical, marketing, or other relevant issues.
3. Open pit Mineral Resources are reported at a cut-off grade of 1.0 g/t gold that is based on a gold price of US$1,500/oz.
4. Underground Mineral Resources are reports at a cut-off grade of 2.0 g/t gold that is based on a gold price of US$1,500/oz.
5. Appropriate mining costs, processing costs, metal recoveries, and inter ramp pit slope angles were used to generate the pit shell.
6. Rounding may result in apparent summation differences between tonnes, grade, and contained metal content.
7. Tonnage and grade measurements are in metric units. Contained gold ounces are in troy ounces.
8. Composites completed at 0.5 m down the hole.
9. Contributing assay composites were capped at 125.00 g/t Au at Hammerdown and 23.88 g/t Au at Orion.
10. A specific gravity value of 2.84 was applied to all blocks.
11. Modeling for Hammerdown was performed use in GEOVIA Surpac 2019 software with grades estimated using ordinary kriging (OK) interpolation methodology. Orion modeling was
performed using Datamine software with grades estimated using ordinary kriging (OK) interpolation methodology.
12. Blocks are 2.5m x1.0m x 2.5m with no sub-blocks.
The Mineral Resource estimate is based on the combination of geological modeling, geostatistics and conventional block modeling using the Ordinary Krig method of grade interpolation.
The geological model including mineralized intercepts was generated by Maritime personnel and then audited by WSP. The QA/QC protocols and corresponding sample preparation and
shipment procedures have been reviewed by WSP.
The Hammerdown Mineral Resource estimate was based on 56,533 metres in 468 surface drill holes, 12,551 metres in underground drill holes and 110 surface trenches totaling 298
metres. The Orion Mineral Resource estimates are based on 15,357 metres in 56 surface drill holes.
At a long-term metal price of US$1,500 per ounce, reasonable prospects are considered to exist for eventual economic extraction of Mineral Resources defined at a 1.0 g/t Au cut-off value
within limits of the conceptual final pit shell prepared by AGP. Additional resources are considered to exist for eventual economic extraction of the Mineral Resource as defined at a 2.00 g/t
Au cut-off below the conceptual pit shell.
TSXV: MAE
26Lac Pelletier Mineral Resource Estimate – Historic (2010)
Reserve Classification Cut-off Tonnes Gold (g/t) Gold oz
Proven 5.5 gpt Au 59,770 6.20 11,916
Probable 5.5 gpt Au 108,230 6.60 22,968
Proven & Probable 5.5 gpt Au 168,000 6.46 34,884
Resource Classification Cut-off Tonnes Gold (g/t) Gold oz
Measured 5.5 gpt Au 57,805 8.63 16,040
Indicated 5.5 gpt Au 221,637 8.61 61,360
Measured & Indicated 5.5 gpt Au 279,442 8.61 77,400
Inferred 5.5 gpt Au 419,514 8.37 112,905
Notes:
1. The mineral resource and reserve estimates for Lac Pelletier are considered historical in accordance with NI 43-101.
2. The mineral resource and reserve estimates for the Lac Pelletier project are contained in the NI 43-101 Technical Report titled “Feasibility Study, Lac Pelletier Project, Rouyn Noranda,
Quebec” with an effective date of June 28, 2010 (the “2010 Feasibility Study Technical Report”), completed by Golder Associates in cooperation with Genivar (purchased by WSP in 2014)
and Alexis Minerals Corporation. The 2010 Technical Report was issued to Alexis Minerals Corporation (“Alexis”), which changed its name to QMX Gold Corporation (“QMX Gold”). The
full 2010 Feasibility Study Technical Report is filed on SEDAR (www.sedar.com) under QMX Gold’s issuer profile.
3. Proven and Probable mineral reserves are the economically mineable parts of the combined Measured and Indicated mineral resources, based on an assessment (2010 Feasibility
Study Technical Report) of the technical and economic viability of the mineral resources. Mineral resources that are not mineral reserves do not have demonstrated economic viability.
Mineral resource estimates do not account for mineability, selectivity, mining loss and dilution. These mineral resource estimates include inferred mineral resources that are considered
too speculative geologically to have economic considerations applied to them that would enable them to be categorized as mineral reserves. There is also no certainty that these inferred
mineral resources will be converted to the measured and indicated categories through further drilling, or into mineral reserves, once economic considerations are applied.
4. Neither Maritime Resources Corporation nor its Qualified Persons have done sufficient work to classify the historic estimates as current Mineral Resources and are not treating the
historical estimates as a current Mineral Resource. The reader is cautioned that the Lac Pelletier historical resource should not be relied upon as they do not satisfy current Mineral
Resource or Mineral Reserve terminology.
5. Numbers may not add due to rounding.
TSXV: MAE
27Lac Pelletier Project Mineral Resource Estimate – Historic (2010)
In accordance with Section 2.4 of National Instrument 43-101 – Standards of Disclosure for Mineral Projects (“NI 43-101”), and despite section 2.2, an issuer
may disclose an historical estimate, using the original terminology, if the disclosure identifies the following:
Source and date of the The mineral resource and reserve estimates for the Lac Pelletier project are contained in the NI 43-101 Technical Report titled “Feasibility Study,
historical estimate, including Lac Pelletier Project, Rouyn Noranda, Quebec” with an effective date of June 28, 2010 (the “2010 Feasibility Study Technical Report”),
any existing technical report completed by Golder Associates in cooperation with Genivar (purchased by WSP in 2014) and Alexis Minerals. The 2010 Technical Report was
issued to Alexis Minerals Corporation (“Alexis”), which changed its name to QMX Gold Corporation (“QMX Gold”). The full 2010 Feasibility Study
Technical Report is filed on SEDAR (www.sedar.com) under the QMX Gold’s issuer profile. No additional drilling or evaluation work was
completed on Lac Pelletier between after 2010.
Relevance and reliability of The 2010 Feasibility Technical Report was compiled in accordance with Canadian Institute of Mining (2010) standards and best practices for
the historical estimate Mineral Resources, adhering to the National Instrument 43-101 Standards of Disclosure for Mineral Projects. Supporting resource data were
subjected to quality control by the responsible Qualified Person.
Key assumptions, Resources were calculated using a cut off grade of 5.5 gpt Au. High grade assays were cut to 30 gpt Au for all assays. A fixed density of 2.826
parameters, and methods g/cm3 was used. All the drill hole intercepts were calculated at a minimum of 2m true thickness, using the grade of the adjacent material when
used to prepare the historical assayed or a value of zero when not assayed. A total of 83,548m of diamond drilling from surface and underground workings has been
estimate completed along with 1,430 chip samples from 30 underground development headings in the 4.2 and 4.3 zones, capped at 20 gpt Au. The
resources calculation is based on the polygonal method with information from drilling projected on a longitudinal view (Zones 3) or based on a
GEMS block model calculation (Zones 4). For zones 3, the polygons were generated by Alexis using Promine software and tonnage, thickness
and grade information were transferred to an Excel file. For zones 4-2 and 4-3, the block modeling method was used with a new 3-D
interpretation, using a 2 m minimum mining width, from the crown surface pillar to the existing openings. Diamond drill holes selected
intersections were composited to 1 meter and then capped. Underground development at the project totals 3,050m. Three underground bulk
samples were taken and processed at the Camflo mill including 6,901t @ 6.79 gpt Au with 93.5% Au recovery (1990), 3,641t @ 3.08 gpt Au with
93.7% Au recovery (1991) and 21,912t @ 4.35 gpt Au with 96.3% Au recovery (2010).
Resource categories used In accordance with NI 43-101 the Lac Pelletier historical mineral resource estimates use the terms “mineral resource”, “inferred mineral
resource”,“indicated mineral resource” and “measured mineral resource” having the same meanings ascribed to those terms by the Canadian
Institute of Mining, Metallurgy and Petroleum, as the CIM Definition Standards on Mineral Resources and Mineral Reserves adopted by CIM
Council, as amended. Qualified Person
More recent estimates or No relevant drilling or assay work has been conducted since 2010. Mr. Larry Pilgrim,P.Geo., Project Manager,
data available to the issuer who is a Qualified Person as defined by NI
43-101, has reviewed the disclosure of the
Work that needs to be done An independent Qualified Person will be required to review and validate the historical data and historical estimates and compile an updated Company’s historical mineral resources and
to upgrade or verify the current Technical Report in accordance with NI 43-101. It is envisaged that this will involve an update/refinement to the geological model and reserves.
historical estimate as current grade interpolation methods.
mineral resources or mineral Mr. Pilgrim is an employee of Maritime
reserves; Resources and is not independent of the
Company under NI 43-101.
TSXV: MAE
28You can also read