Climate change and financial markets-Foresight - Schroders
←
→
Page content transcription
If your browser does not render page correctly, please read the page content below

Foresight                                                         Climate change and
                                                                   financial markets –
                                                                                 Part 1
                                                                               January 2021

Marketing material for professional investors and advisers only
Long-run asset class performance:
How climate change will impact
asset returns – an update

Schroders Economics Group produces 30-year
return forecasts, on an annual basis, for a range
of asset classes.
This is Part 1 of our paper where we outline the methodology
used to incorporate climate change into our return assumptions
and explain what has changed from last year’s analysis.
In Part 2 of our paper, we publish our 30-year forecasts for
cash, bonds, credit, equities, and real estate, incorporating the
impact of climate change.
In this update of the 30-year asset return assumptions we
have worked with Cambridge Econometrics to apply their
E3ME energy-economy model to our productivity and inflation
forecasts. These are the key inputs into our return forecasts
through their influence on interest rates and profits growth.
The E3ME is a global macro-econometric model with regional
and sectoral resolution that captures the diverse interactions
between economies, energy systems, emissions and material
demands. Last year alongside temperature changes, our focus
was on the impact of higher carbon taxes on future growth
and inflation. Using the model we are now able to fully capture
the transition impacts of economy-wide decarbonisation and a
shift in investment towards renewables.

                       Irene Lauro
                       Economist

                                          Climate change and financial markets – Part 1   3
The three step approach What has changed from last year’s
As in last year’s analysis, we have adopted a three step analysis?
approach to incorporate climate change in our macroeconomic
assumptions. The first step is a focus on what happens to Physical costs
output and productivity as temperatures rise, which we This year, we have introduced a new assumption regarding
refer to as the ‘physical cost’ of climate change. The second temperature increases. Last year we assumed a uniform rise in
considers the economic impact of steps taken to mitigate those temperature across the globe, with global warming increasing
temperature increases, or the ‘transition cost’. Finally, we adjust at a constant rate of 0.04 degrees Celsius per annum. With
for the effects of stranded assets. This is where we take account E3ME, temperature now becomes endogenous. From
of the losses incurred where oil and other carbon based forms E3ME, we have an emissions trajectory associated with each
of energy have to be written off, as it is no longer possible to scenario which is used to estimate the total change in global
make use of them and they are left in the ground. temperature above preindustrial levels, using methods from
earth science and earth systems modelling.
Productivity is a key driver of asset returns in the long run.
In particular, our equity return assumptions use a Gordon’s We scale the country level temperature anomaly based on
growth model approach, in which returns are generated our global temperature expectation using data for average
through the initial dividend yield and the growth rate of temperatures for different countries and the temperature
dividends (via earnings growth). Earnings are assumed to anomaly under the different RCP (Representative Concentration
grow in line with productivity, because we believe that over Pathways) scenarios. These scenarios have been modelled
the long term productivity is a good measure of how well by the Intergovernmental Panel on Climate Change (IPCC)
capital is invested. to understand the risk of climate change determined by the
amount of greenhouse gas (GHG) we produce. Each scenario
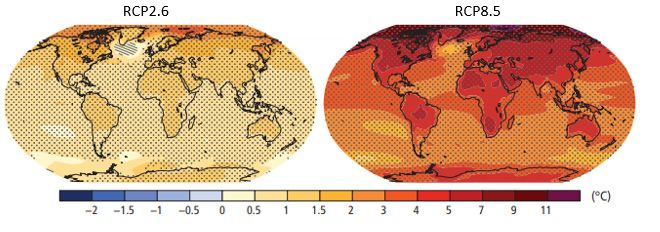
We can also assess the consequences for fixed income assets corresponds to a different level of warming. RCP2.6 is a ‘best
by making use of the productivity figures to modify our interest case’ scenario, in which GHG emissions are cut back sufficiently
rate and bond returns. Following the framework developed such that global warming is capped at around 1.5 to 2 degrees
by Laubach and Williams¹, long run equilibrium interest rates above the pre-industrial average. At the other end of the scale,
move in line with changes in trend growth in the economy. RCP8.5 is a worst case, ‘business as usual’ scenario in which
Assuming that the supply of labour is not affected by climate no effort is made to rein in emissions and as a result global
change, then changes in productivity feed directly into changes temperatures increase by 4 degrees compared to the pre-
in trend growth. In turn this directly affects the long run or industrial average by 2100. As shown in chart 1 below, countries’
equilibrium interest rate for the economy. temperature will rise at different speeds within each scenario.
Chart 1: Change in average surface temperature (1986−2005 to 2081−2100)
Source: IPCC, 2014: Climate Change 2014: Synthesis Report. Contribution of Working Groups I, II and III to the Fifth Assessment Report of the Intergovernmental
Panel on Climate Change.
¹Laubach and Williams, Measuring the natural rate of interest, Review of Economics and Statistics (2003).
4 Climate change and financial markets – Part 1Chart 2: Physical costs – impact of climate change on productivity (% p.a. 2021-2050)*
%
1.5
1.0
0.5
0.0
-0.5
-1.0
-1.5
Can Swi UK Ger EZ Fra SK NZ Ita US Jp Chi HK Sg Pac Ex Aus EM Mex SA Bra Ind
No Action Partial Mitigation
* The chart shows the impact of higher temperatures measured as the difference in productivity of the partial mitigation and No Action scenarios relative to the
No climate change scenario, in which there are no transition and physical costs.
Source: Cambridge Econometrics, Schroders Economics Group, January 2021.
In this year’s analysis we have added a new scenario, called Transition costs
the No Action scenario, where temperatures are set to rise In the second step of our analysis we take into account the
more than 3°C above pre-industrial levels by the end of the impact on productivity of mitigation policies that will try to limit
century. We have kept the partial mitigation scenario as our carbon emissions.
base case, but broadened policy action such that temperature
increases are more limited thanks to the introduction of Last year we used the IMF modelling estimates to assess the
carbon emission mitigation policies starting from 2025. impact of a uniform carbon tax on productivity. This year we
The lower-warming pathway (RCP 4.5) is used to scale our have gone one step further, as E3ME enables us to address
partial mitigation temperature data and the highest warming the economic impact of many more types of policy changes,
pathway (RCP 8.5) is used to scale our No Action scenario. fully capturing the transition impacts of economy wide
decarbonisation and a shift in investment towards renewables.
In chart 2 we compare the physical costs of higher
temperatures for the No Action scenario and the partial In particular, we have been able to incorporate the impact
mitigation scenario. These are expressed relative to the no of investment subsidies, fuel taxes and mandates for the
climate change case where there are no temperature effects. phase-out of the carbon-intensive power generation sector.
They make continued investment in some technologies less
It is important to note that projected warming by 2050 is already attractive as they are progressively banned from the market.
set. Whatever mitigation we undertake, temperature projections More importantly, with E3ME we are able to capture the
will only be affected in the second half of this century. The No technological change required to rapidly decarbonise some of
Action scenario, in which the world economies fail to implement the more emissions intensive sectors within the economy.
mitigation strategies to limit carbon emissions and global
temperatures rise by more than 3 degrees Celsius by 2100 More specifically, in the partial mitigation scenario we assume
relative to the pre-industrial average, shows that some countries ambitious policy action focused on rapidly decarbonising
will still benefit over the next 30 years. the economy. Primarily this is in the electricity sector with
investment for low-carbon technologies and investment
As highlighted by Burke and Tanutama’s research, there is subsidies for technologies with nascent Carbon Capture
a quadratic relationship between productivity growth and Storage (CCS) capabilities. In the road transport sector, policies
temperature. This suggests that ‘cold country’ economic growth are put in place that incentivise the take-up of hybrid and
increases as annual temperatures increase, while at annual electric vehicles and the phase-out of internal combustion
temperatures higher than 12-13°C economic growth begins to engines. Modest biofuel blending mandates are pursued to
decline. For the colder countries, a more pronounced increase gradually reduce the fossil fuel intensity of internal combustion
in temperatures means a higher productivity boost. On a 30 engines that remain in the vehicle stock. There are ambitious
year horizon, Switzerland, Canada, Germany, France and the UK investment programmes in energy efficiency to reduce
will all be better off in a scenario where global warming rises household, industry, and commercial fuel demand. At the
more than 3°C above pre-industrial levels. same time, there are programmes to support the take-up and
proliferation of low-carbon and electric heating technologies.
Our base case is the partial mitigation scenario in which there
is some action taken to reduce carbon emissions. Temperature We also assume a carbon tax starting from 2030 in order to
increases are more limited than in the No Action case and further reduce carbon emissions, as in our previous analysis.
therefore the physical costs are smaller. It is important to The IEA argues that the optimal carbon tax to meet the Paris
note we will use the partial mitigation scenario in the rest of target is a tax starting at $100 per ton for developed market
our analysis as this is the more realistic profile. The No Action economies and $75 per tonne for emerging, increasing after a
scenario is here only for illustrative purposes, as it highlights decade. We think this profile is too ambitious and we instead
the impact of higher temperatures on economies. model a tax starting at $75/tCO2 for developed markets and
$50/tCO2 for emerging markets.
Climate change and financial markets – Part 1 5Chart 3: Transition costs - impact on productivity (% p.a. 2021-2050)*
0.3
0.2
0.1
0.0
-0.1
-0.2
-0.3
-0.4
-0.5
Bra Ind Mex Jp HK Sg SK UK Chi Pac EX NZ Fra Ita EZ Swi Aus Ger US Can EM DM
Previous version New version
*The chart compares the current version to last year’s, showing the climate change impact measured as the difference in productivity of the partial mitigation scenario
relative to the No climate change scenario, in which there are no transition and physical costs.
Source: Cambridge Econometrics, Schroders Economics Group, January 2021.
In chart 3 we show the impact of decarbonisation on Finally, China, Australia, New Zealand, South Korea, India and
productivity, comparing the results with the estimates we the eurozone will require large investments in low-carbon
produced in last year’s analysis for our partial mitigation electricity generation and energy efficiency improvements in
scenario. It is clear that in our current analysis, reducing order to reduce carbon emissions. Therefore, investment in
carbon emissions will have positive transition impacts for some nuclear power, offshore wind, and hydro-power installations
economies. This is because we are now taking into account will provide a productivity boost to these economies.
the full impact of decarbonisation, where investment in clean
technology and efforts to improve energy efficiency partially The aggregate impact on productivity in our base case
offset the economic drag due to the introduction of a carbon
We can now combine the physical and transition costs to get
tax and to rising temperature.
our final estimate for productivity that we will use to calculate
In particular, fossil fuel importers (i.e. Brazil, Germany, our long-term asset returns.
France, Japan, Hong Kong, Singapore and South Korea, the
Chart 4 below shows the differences in productivity in our
eurozone and the UK) will see positive effects on economic
base case compared to a world in which no climate change
growth by investing in low-carbon electricity generation and
occurs. Our modelling finds that some countries experience
energy efficiency. Countries like the US and Canada will also
higher productivity in the partial mitigation scenario thanks to
see a positive investment effect associated with the shift to
higher temperatures. This is true for colder countries such as
clean technology, but this positive effect is outweighed by
Switzerland, Canada, the UK, Germany as it was the case in last
falling export revenue in the oil and gas sector and a fall in
year’s analysis. Additionally, in this year’s analysis countries like
government revenues from natural resource extraction as they
South Korea, Hong Kong, Singapore and New Zealand, France
are fossil fuel exporters.
and the UK will also see higher productivity thanks to a shift
Additionally, some countries like the UK, the eurozone and in investment towards clean technology. China, Japan, India
Japan will also experience a major economic boost due to and Brazil will also see the benefits from shifting to cleaner
higher carbon taxes that will lead to a significant increase technology, but this will only partially offset the drag coming
in government revenues. These revenues are ‘recycled’ from a higher temperatures. Emerging markets are worse off
and government budgets are balanced by reducing taxes in a world with climate change. The same is true for the US as it
elsewhere in the economy, supporting consumer spending. will see lower productivity in our base case as a result of a drag
from both physical and transition costs.
Chart 4: Changes in productivity compared to No climate change scenario (% p.a. 2021-2050)
0.8
0.4
0.0
-0.4
-0.8
Swi UK Can Ger Fra EZ SK HK Sg Ita NZ Chi Jp Pac Ex Mex Aus US SA Bra Ind EM DM
Physical costs Transition costs Total change in producitvity
Source: Cambridge Econometrics, Schroders Economics Group, January 2021.
6 Climate change and financial markets – Part 1Chart 5: Reduction in equity returns from stranded assets
Equity cost from stranded assets in the partial mitigation scenario (% p.a. 2021–50)
Hong Kong
Singapore
Australia
Canada
France
Pac Ex
China
Japan
Brazil
India
Italy
Mex
Ger
DM
Swi
EM
UK
NZ
Tai
US
SK
EZ
0.0%
-0.2%
-0.4%
-0.6%
-0.8%
-1.0%
-1.2%
-1.4%
-1.6%
-1.8%
Source: Refinitiv Datastream, MSCI, Schroders Economics Group. December 2020. We use the Nifty Index for India and the Shanghai Stock Exchange Composite Index for
China since we have data for companies listed on their domestic stock exchange.
Having calculated the difference climate change makes to We did this by using MSCI data that reports potential CO2
productivity, we then adjust for stranded assets to assess the emissions from coal, oil and natural gas reserves owned by
full impact on our equity return forecasts. In particular, any public companies.
attempt to limit global carbon emissions is going to mean we
reduce the quantity of fossil fuels we burn. The results are shown in chart 5, highlighting the sizeable impact
to EM returns, particularly in India and China. In the US, returns
Stranded assets see only a small downward adjustment; a reflection of the sheer
size of the equity market, even relative to its oil giants.
Recent analysis from the IEA finds that almost 60% of oil and
gas reserves, and over 80% of current coal reserves should Now that we have aggregate estimates for the impact on
remain unused if we are to meet the Paris target. productivity from climate change and the costs of stranded
assets, we move onto the investment implications. In Part
We calculated the loss that companies’ balance sheets would 2, we outline how we use the productivity estimates for our
register given the fraction of unburnable reserves of oil, coal asset return forecasts cash, bonds, credit, equities, and real
and gas for each equity index in the scenario where mitigation estate, along with a look at the historic evolution of most of
policies lead to some moderation in global temperatures. these forecasts.
Climate change and financial markets – Part 1 7Schroder Investment Management Limited
1 London Wall Place, London EC2Y 5AU, United Kingdom
T +44 (0) 20 7658 6000
schroders.com
@schroders
Important information: This document is intended to be for information purposes investment and/or strategic decisions. Past performance is not a reliable indicator of
only and it is not intended as promotional material in any respect. The material future results, prices of shares and the income from them may fall as well as rise and
is not intended as an offer or solicitation for the purchase or sale of any financial investors may not get back the amount originally invested. Schroders has expressed
instrument. The material is not intended to provide, and should not be relied on for, its own views in this document and these may change. Issued by Schroder Investment
accounting, legal or tax advice, or investment recommendations. Information herein Management Limited, 1 London Wall Place, London EC2Y 5AU, which is authorised and
is believed to be reliable but Schroders does not warrant its completeness or accuracy. regulated by the Financial Conduct Authority. For your security, communications may
No responsibility can be accepted for errors of fact or opinion. Reliance should not be taped or monitored. 600134
be placed on the views and information in the document when taking individualYou can also read