Colonization and genetic diversification processes of Leishmania infantum in the Americas - Nature
←
→
Page content transcription
If your browser does not render page correctly, please read the page content below

ARTICLE
                  https://doi.org/10.1038/s42003-021-01658-5                OPEN

                  Colonization and genetic diversification processes
                  of Leishmania infantum in the Americas
                  Philipp Schwabl1,10, Mariana C. Boité 2,10 ✉, Giovanni Bussotti3,4, Arne Jacobs1, Bjorn Andersson 5,
1234567890():,;

                  Otacilio Moreira6, Anita L. Freitas-Mesquita7, Jose Roberto Meyer-Fernandes7, Erich L. Telleria 8,9,
                  Yara Traub-Csekö8, Slavica Vaselek 9, Tereza Leštinová9, Petr Volf 9, Fernanda N. Morgado 2,
                  Renato Porrozzi2, Martin Llewellyn1, Gerald F. Späth 4 & Elisa Cupolillo 2

                  Leishmania infantum causes visceral leishmaniasis, a deadly vector-borne disease introduced
                  to the Americas during the colonial era. This non-native trypanosomatid parasite has since
                  established widespread transmission cycles using alternative vectors, and human infection
                  has become a significant concern to public health, especially in Brazil. A multi-kilobase
                  deletion was recently detected in Brazilian L. infantum genomes and is suggested to reduce
                  susceptibility to the anti-leishmanial drug miltefosine. We show that deletion-carrying strains
                  occur in at least 15 Brazilian states and describe diversity patterns suggesting that these
                  derive from common ancestral mutants rather than from recurrent independent mutation
                  events. We also show that the deleted locus and associated enzymatic activity is restored by
                  hybridization with non-deletion type strains. Genetic exchange appears common in areas of
                  secondary contact but also among closely related parasites. We examine demographic and
                  ecological scenarios underlying this complex L. infantum population structure and discuss
                  implications for disease control.

                  1 School of Life Sciences, Institute of Biodiversity, Animal Health and Comparative Medicine, University of Glasgow, G12 8QQ Glasgow, UK. 2 Laboratório de

                  Pesquisa em Leishmaniose, Instituto Oswaldo Cruz, FIOCRUZ, 21040-365 Rio de Janeiro, Brazil. 3 Institut Pasteur-Bioinformatics and Biostatistics Hub-C3BI,
                  USR 3756 IP CNRS, 75015 Paris, France. 4 Department of Parasites and Insect Vectors, Institut Pasteur, INSERM U1201, Unité de Parasitology moléculaire et
                  Signalisation, 75015 Paris, France. 5 Department of Cell and Molecular Biology, Science for Life Laboratory, Karolinska Institutet, Biomedicum 9C, 171 77
                  Stockholm, Sweden. 6 Laboratório de Biologia Molecular e Doenças Endêmicas, Instituto Oswaldo Cruz, Fiocruz, 21040-365 Rio de Janeiro, RJ, Brazil.
                  7 Instituto de Bioquímica Médica Leopoldo de Meis (IBqM), Universidade Federal do Rio de Janeiro (UFRJ), 21941-590 Rio de Janeiro, RJ, Brazil. 8 Laboratório

                  de Biologia Molecular de Parasitas e Vetores, Instituto Oswaldo Cruz, 21040-365 Rio de Janeiro, Brazil. 9 Faculty of Science, Department of Parasitology,
                  Charles University, 128 44 Prague, Czech Republic. 10These authors contributed equally: Philipp Schwabl, Mariana C. Boité. ✉email: boitemc@ioc.fiocruz.br

                  COMMUNICATIONS BIOLOGY | (2021)4:139 | https://doi.org/10.1038/s42003-021-01658-5 | www.nature.com/commsbio                                               1
ARTICLE                                                                COMMUNICATIONS BIOLOGY | https://doi.org/10.1038/s42003-021-01658-5

S
       pecies invasion creates unique opportunity for extreme evo-           clarify the emergence of the deletion genotype, quantify its spread,
       lutionary transformation. Small founding populations face             and understand implications for disease treatment and control.
       unfamiliar selection pressures and sampling effects that drive           The present study expands surveillance for the sub-
genetic drift. Rapid changes in genetic makeup can occur and                 chromosomal deletion into 17 states of Brazil, establishing that
potentially dictate long-term population genetic structure                   deletion-carrying isolates occur abundantly in both the country’s
throughout the invasive range1. Subsequent secondary introduc-               North and South. Although non-deletion genotypes appear
tions into the same area can also reshape diversity patterns in the          common in the northern state of Piauí, a North-South gradient in
population, e.g., by promoting introgressive hybridization events            chr31 deletion abundance (previously suggested to increase mil-
between ancestrally allopatric groups2. One medically relevant but           tefosine treatment efficacy in Rio Grande do Norte27) does not
little explored example of species invasion is represented by the            occur in the dataset. Non-deletion type strains also appear
introduction of Leishmania infantum, the parasitic agent of visceral         common in the southwestern state of Mato Grosso do Sul. We go
leishmaniasis (VL), into the New World in conjunction with Eur-              on to explore sequence diversity in 126 L. infantum genomes (59
opean colonization of the Americas beginning ca. 500 years ago3,4.           newly sequenced in this study and 67 others from publicly
Population structure and genetic change in Leishmania populations            archived datasets representing Brazil27,33, Honduras34, Panama34,
are of major concern to public health, as intra-specific genetic              Morocco35, and Europe34) in search of adaptive and/or demo-
variation within this genus is associated with major differences in          graphic drivers of the widespread deletion genotype and
pathology5–7, drug resistance8,9, and other eco-epidemiological              discontinuous population structures in the New World. We
traits10,11. Driven in part by high karyotypic plasticity12,13, Leish-       describe phylogenetic relationships characteristic of one or few
mania parasites are capable of rapid adaptation and epidemic                 early ancestral mutant groups having risen to high prevalence by
expansion after environmental change and/or bottleneck events8.              founder effect and observe a possible compensation for reduced
Genetic recombination among L. infantum populations is another               ecto-3’-nucleotidase activity via increased ecto-ATPase activity in
potential source of phenotypic diversity. Hybridization between              deletion-carrying isolates. We also demonstrate restored ecto-3’-
divergent Leishmania isolates and species that cause distinct forms          nucleotidase activity in parasites with partial (heterozygous) sub-
of disease14 can impact pathogenicity14–16, as well as facilitate            chromosomal deletion that clearly derive from natural mating
vector17 and geographic range expansion18.                                   between divergent deletion-carrying and non-deletion isolates.
    In the Americas, VL is a zoonosis caused by L. infantum                  Several hybridizations appear to involve a secondary contact (SC)
infecting Lutzomyia sandflies, which have evolved in isolation of             process in the West of Brazil but endogamic mating is also
Phlebotomus, the Old World vector genus, for ca. 200 million                 apparent in several states. Our results suggest a dynamic and yet
years19. Domestic dogs represent principal reservoir hosts. The              incompletely charted distribution of L. infantum diversity in the
New World distribution of L. infantum now extends from the                   New World. Volatile genotypes and biomarkers in this intro-
southern United States to northern Argentina20 and Uruguay21,                duced range must be precisely monitored for effective disease
but prevalence and/or reporting varies considerably across this              control.
range. Over 1000 VL cases have been recorded yearly in Brazil
since the 1980s, first limited to the Northeast22 but now increas-
ingly dispersed, including in urban areas such as those in Mato              Results
Grosso, Minas Gerais, and São Paulo state. VL infections are                 High prevalence of multi-kilobase deletion on chr31. Com-
significantly less common elsewhere on the continent compared to              parative analysis of 126 L. infantum genomes (19 from the Old
Brazil23. Atypical cases, e.g., involving dermotropic or, more               World, 107 from the New World) and quantitative PCR (qPCR)
rarely, drug-resistant L. infantum isolates, are also sporadically           screening of 75 additional New World samples (Supplementary
observed in the New World24–26, but direct links between changes             Data 1) confirmed the occurrence of a >12 kb homozygous
in disease progression and specific host or parasite factors are              deletion on tetraploid chr31 (see somy values in Supplementary
rarely established. A recently published genome-wide association             Fig. 1), previously described as a miltefosine sensitivity locus by
study27, however, reports that L. infantum populations from Piauí,           Carnielli et al.27. The deletion occurred in samples from Brazil
Maranhão, and Minas Gerais (Brazil) show resistance to milte-                (126 of 177) and Honduras (2 of 2) but was absent from the Old
fosine, an important anti-leishmanial drug, and associates this              World (0 of 19)34. New World samples without the deletion
resistance to a large (>12 kb) deletion said to increase in pre-             (referred to as “NonDel” as opposed to “Del” in subsequent
valence from northern to southeastern Brazil (e.g., 5% in Rio                whole-genome sequencing (WGS) analyses) were concentrated
Grande do Norte and 95% in Minas Gerais). The deletion is                    primarily in the Brazilian states of Piauí (20 of 38) and Mato
homozygous, spanning across all four copies of tetrasomic chro-              Grosso do Sul (12 of 12) but they also occurred in Bolivia (1 of 1)
mosome 31 (chr31). It covers four open reading frames as follows:            and, as recently noted34, in Panama (2 of 2) (Supplementary
LinJ.31.2370 (ecto-3′-nucleotidase/nuclease), LinJ.31.2380 (ecto-            Data 1 and Fig. 1). The deleted region spans chr31 base pair
3’-nucleotidase precursor), LinJ.31.2390 (helicase-like protein),            positions 1,122,848 to 1,135,161 in most Del samples (but see
and LinJ.31.2400 (3,2-trans-enoyl-CoA isomerase). Ecto-3’-                   slight mapping variability within repetitive boundary regions in
nucleotidases take part in purine salvage, macrophage infection,             Supplementary Data 2) and comprises genes encoding for ecto-3’-
and escape from neutrophil extracellular traps28–30. Helicases are           nucleotidase (LinJ.31.2370), ecto-3’-nucleotidase precursor (LinJ
essential to DNA replication and 3,2-trans-enoyl-CoA isomerase               31.2380), helicase-like protein (LinJ 31.2390), and 3-2-trans-
contributes to fatty acid oxidation, a critical component of glu-            enoyl-CoA isomerase (LinJ.31.2400). Apart from these four genes,
coneogenesis in amastigote parasite forms31. The simultaneous                38 coding regions showed significant copy number variation
deletion of these four genes likely occurs through homologous                (CNV) between Del and New World NonDel groups in haploid
recombination between repetitive elements bordering the deletion             somy estimate (s) comparison using Mann–Whitney U (MWU)-
site27,32. The mechanisms by which the sub-chromosomal dele-                 tests (Supplementary Data 3), but reassessment by analysis of
tion has emerged in multiple different areas of Brazil, however,             covariance (ANCOVA) suggested that most of these differences
remain completely unknown. Its abundance and geographic dis-                 are driven by population structure, i.e., common descent. Sup-
tribution are also only rudimentarily described27. Analyses of               plementary Fig. 2 illustrates how CNV profiles cluster by geo-
demographic history, epidemiological phenotypes, and genetic                 graphic origin, and geographic origin correlates to chr31 read-
covariation in deletion-carrying isolates are urgently required to           depth profile. The five coding regions, which remained

2                          COMMUNICATIONS BIOLOGY | (2021)4:139 | https://doi.org/10.1038/s42003-021-01658-5 | www.nature.com/commsbio
COMMUNICATIONS BIOLOGY | https://doi.org/10.1038/s42003-021-01658-5 ARTICLE
AM N
MA RN
PI 10 - 14
PE 25 - 29
5-9
n
1-4
SE 30 - 34
BA
see Suppl. Fig. 4
Del_MT_3219 NonDel_MS_2935 HTZ_MT_3224
DF
MT 500
Read-
depth
SC-Bol MG Position
(~0.95 – 1.3 Mb)
MS State / Department Del NonDel HTZ MIX
ES Amazonas (AM) 1 0 0 0
Bahia (BA) 1 0 0 0
Distrito Federal (DF) 2 0 0 0
Espírito Santo (ES) 3 0 0 0
SP Maranhão (MA) 2 2 0 2
RJ Mato Grosso (MT) 11 1 3 0
Mato Grosso do Sul (MS) 0 12 0 0
Minas Gerais (MG) 15 1 0 0
Pernambuco (PE) 5 0 0 0
Piauí (PI) 12 20 1 5
Rio de Janeiro (RJ) 4 0 0 0
SC Rio Grande do Norte (RN) 37 0 0 0
Rio Grande do Sul (RS) 1 0 0 0
Salvador (SA) 1 0 0 0
Santa Catarina (SC) 31 2 0 0
Santa Cruz (SC-Bol) 0 1 0 0
RS São Paulo (SP) 3 0 1 0
Sergipe (SE) 1 0 0 0
Fig. 1 Different read-depth profiles found in L. infantum isolates from Brazil. Del isolates contain a >12 kb deletion between 1.122 Mb and 1.135 Mb on
chr31 (e.g., Del_MT_3219 in the left graph). NonDel isolates do not contain the deletion, showing full read-depth at the locus (center graph). 8HTZ isolates
are heterozygous for the deletion, with read-depth dropping to ca. 50% (right graph). Quantitative PCR confirmed heterozygosity at the deletion locus in
monoclonal HTZ subcultures. MIX isolates appear to contain a mixture of NonDel and Del or HTZ profiles based on subclone PCR by Carnielli et al.27.
However, full read-depth is observed at the deletion locus in all MIX isolates, except in MIX_PI_05A and MIX_PI_08A (showing ca. 75% read-depth, see
Supplementary Fig. 4). This suggests that NonDel cells are more abundant than Del and/or HTZ cells within MIX isolates. Circle radius indicates the
number of isolates (each from a different canine or human host) representing the study site. Dotted circles represent study sites where multiple read-depth
profiles occur (see table inset). Fill color indicates the majority read-depth profile at such study sites. The map was created in the open-source geographic
information system Quantum GIS version 2.18.4 using Open Layers plugin access to Bing Aerial imagery. Microsoft product screen shot(s) reprinted with
permission from Microsoft Corporation.
significantly differentiated between Del and New World NonDel heterozygous sub-chromosomal deletion (i.e., cells in which two
groups after controlling for geographic origin, encode amastin- copies of chr31 carry the deletion and two copies do not) or an
like protein, nucleoside transporter, and paraflagellar rod protein equally mixed population of Del and NonDel isolates. We
paralogs (see asterisked columns in Supplementary Fig. 2). Effect therefore extracted DNA from 11 monoclonal subcultures
size, however, is low (0.317 ≤ |Δs | ≤ 0.552) (Supplementary established from two isolates representing putative heterozygotes
Data 3). We also did not note any substantial evidence for a direct (IOCL 2949 and 3134) and measured relative abundance of the
relationship between the presence of deletion on chr31 and deletion target by qPCR. Results from ten monoclonal sub-
single-nucleotide polymorphism (SNP) or insertion-deletion cultures showed a reduction of ca. 50% in the abundance of the
variant (INDEL) differentiation among New World isolates amplified target sequence relative to the NonDel representative
(Supplementary Note 1, Supplementary Fig. 3, and Supplemen- NonDel_MS_2666 (Fig. 2), confirming the presence of cells het-
tary Data 4 and 5). erozygous at the deletion locus as opposed to a mix of (homo-
zygous) Del and NonDel genotypes. Clone 2949 G1 showed 25%
relative target amplification (Fig. 2b), suggesting the presence of
Partial deletions occur via hybridizations between Del and three chromosome copies with the deletion and one copy with-
NonDel isolates. Six L. infantum samples sequenced in this study out. Subpopulations with different levels of heterozygosity appear
had an intermediate read-depth profile within the chr31 deletion to occur but equivalent heterozygotes—i.e., cells in which two
site (Supplementary Data 1). In such genotypes, sequences copies of chr31 carry the deletion and two copies do not—appear
mapped to the deletion site achieve ~50% read coverage relative most abundant based on read-depths from parental culture
to the rest of the chromosome (Supplementary Fig. 4), suggesting sequencing (Supplementary Fig. 4). Aside from these six isolates
one of two scenarios: an abundance of cells with “equivalent” (hereafter termed “HTZ”), seven isolates sequenced by Carnielli
COMMUNICATIONS BIOLOGY | (2021)4:139 | https://doi.org/10.1038/s42003-021-01658-5 | www.nature.com/commsbio 3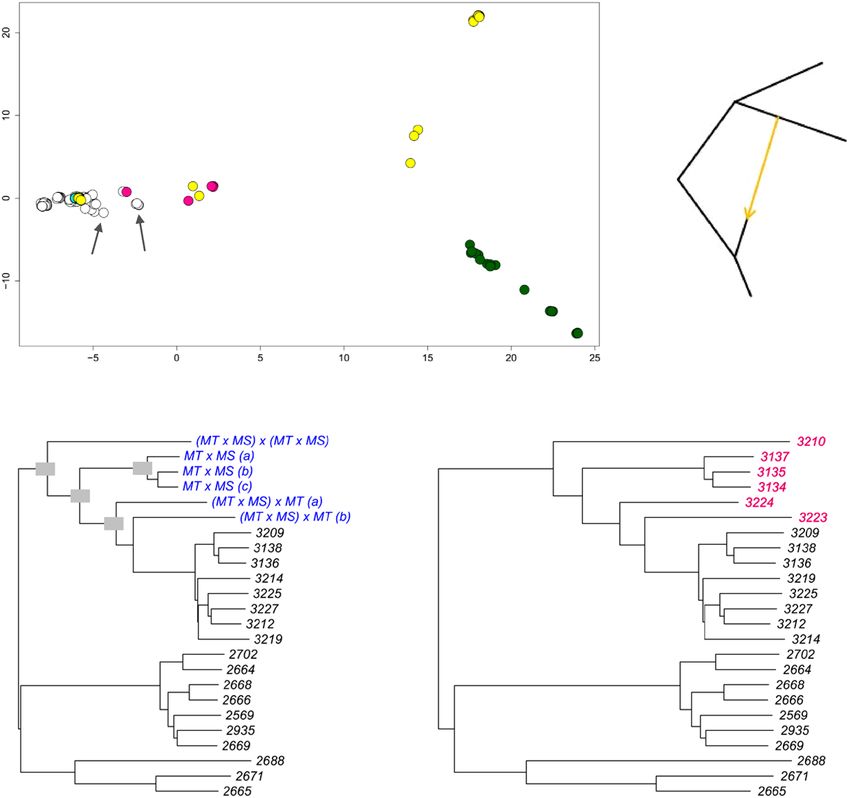
ARTICLE                                                                   COMMUNICATIONS BIOLOGY | https://doi.org/10.1038/s42003-021-01658-5

                            a
                                                        *                                        b

                                               1.0
                                                                                                                  1.0

                            (NonDel_MS_2666)
                               Fold Change

                                                                                                  (HTZ_PI_2949)
                                                                                                   Fold Change
                                               0.5                                                                                                *
                                                                                                                  0.5

                                               0.0                                                                0.0

                                                                                                                        HTZ_PI_2949

                                                                                                                                        2949 B2

                                                                                                                                                  2949 G1
                                                     NonDel_MS_2666
                                                       HTZ_MT_3134
                                                        HTZ_PI_2949
                                                             3134 C3
                                                             3134 C4
                                                             3134 D3
                                                             3134 E6
                                                             3134 G2
                                                             2949 B2
                                                             2949 C1
                                                             2949 D1
                                                             2949 F7
                                                             2949 G1
                                                             2949 G7
                                                                                                                                      Sample
                                                                Sample

Fig. 2 Quantitative PCR confirms that intermediate read-depth profiles represent heterozygous deletions in L. infantum clones. a HTZ_PI_2949 and
HTZ_MT_3134 were selected as representatives of isolates for which read-depth drops to ca. 50% between 1.122 Mb and 1.135 Mb on chr31 (see
Supplementary Fig. 4). DNA from monoclonal subcultures established from these two isolates was analyzed in qPCR targeting LinJ.31.2380 (within the
chr31 deletion site) and LinJ.31.2330 (downstream of the chr31 deletion site). Differences in Ct values for LinJ.31.2330 between each HTZ sample and the
NonDel reference (NonDel_MS_2666) were used to normalize a fold change estimate at LinJ.31.2380 based on the ΔΔCt method by Livak and
Schmittgen75. Student’s t-test was applied to test whether fold change estimates obtained from n = 3 independent reactions differed significantly from the
1 : 1 ratio represented by the reference sample. Results were considered significant at *p < 0.05 and indicate that intermediate read-depth profiles represent
abundant heterozygous deletions as opposed to mixtures of deletion-carrying and non-deletion-type cells within isolates. b Fold change was calculated the
same way for monoclonal HTZ subcultures using the parental isolate as the reference. Results indicate that “unbalanced” heterozygotes also occur, e.g.,
subclone 2949 G1 appears to contain three chromosome copies with the chr31 deletion and one copy without.

et al.27 simultaneously showed Del and NonDel deletion site PCR                 occurred in peripheral positions relative to monophyletic Del
amplicons in the previous study but ca. 80–100% read-depth                      subclades in maximum-likelihood phylogeny (Fig. 4) and showed
within the deletion site (Supplementary Fig. 4). We refer to these              intermediate positions on PCoA axis 1 (Fig. 5a). We also
samples as “MIX” without resolving the extent to which their                    constructed neighbor-joining trees from phased chromosomes
sequence reads represent mixed-strain or monoclonal cell                        (Supplementary Fig. 6) and homologous haplotypes of Mato
populations.                                                                    Grosso HTZ isolates generally divided between Mato Grosso Del
   Given the vast geographic range occupied by Del isolates                     and Mato Grosso do Sul NonDel clades (i.e., one HTZ haplotype
(Fig. 1), we considered the possibility of independent deletion                 appearing similar to both haplotypes of Mato Grosso Del isolates
emergence as an adaptive process recurring frequently across the                and the other HTZ haplotype appearing more similar to both
American continent. Under such scenario, HTZ isolates might                     haplotypes of NonDel isolates from Mato Grosso do Sul). This
represent former NonDel genotypes currently in transition to the                divided HTZ haplotype clustering suggested a process of nuclear
homozygous (i.e., complete, fourfold) deletion state. This                      genetic exchange in which homologous chromosomes from
NonDel to Del transition might occur via successive independent                 distinct progenitors are found within hybrid offspring, consistent
locus deletion on different chromosome copies or via locus                      with sexual mating or, less parsimoniously (because ploidy levels
deletion on a single chromosome copy followed by over-                          did not appear aberrant (Supplementary Fig. 1)), genome fusion
replication of the deletion-containing copy and under-                          events. FST differentiation to Mato Grosso do Sul samples also
replication of non-deletion copies during mitosis. Following                    fluctuated among HTZ chromosomes, consistent with chromo-
ADMIXTURE analysis (Supplementary Fig. 5), however, in                          somal reassortment as a result of mating between Del and
which HTZ_MT_3134, HTZ_MT_3135, HTZ_MT_3137,                                    NonDel isolates (Supplementary Fig. 7). We further examined a
HTZ_MT_3224, and HTZ_SP_3254 (i.e., all HTZ samples,                            potential hybrid origin by comparing the phylogenetic positions
except HTZ_PI_2949) received simultaneous Del + NonDel                          of HTZ isolates from Mato Grosso with those generated by
group assignment, we also considered the alternate hypothesis                   simulated sexual mating (see Supplementary Codes36) between
that HTZ isolates represent hybrid offspring forming at contact                 populations from Mato Grosso and nearby Mato Grosso do Sul.
zones between Del and NonDel groups (Fig. 1). Support for this                  Phylogenetic positions for simulated hybrids corresponded to
alternate hypothesis quickly accumulated through several                        those observed for HTZ isolates (Fig. 5b). In these simulations, we
analyses and metrics.                                                           also hypothesized the presence of second-generation (F2) hybrids,
   HTZ samples showed marked, statistically significant reduc-                   i.e., we simulated backcrossing and hybrid inter-crossing to
tions in total homozygosity and FIS values (which describe the                  account for the origin of Mato Grosso samples Del_MT_3223
extent to which individual heterozygosity is reduced by inbreed-                and NonDel_MT_3210 (respectively). These two samples are not
ing) relative to Del and to New World NonDel isolates (Fig. 3a                  heterozygous for the deletion on chr31 but show low genome-
and Supplementary Data 6). Median FIS was lowest in HTZs                        wide FIS (Fig. 3a) and place near HTZ samples in Principal
(relative to Del and New World NonDel groups) in 33 of 36                       Coordinates Analysis (PCoA) (Fig. 5a). Phylogenetic positions of
chromosomes (Fig. 3b). Except for HTZ_PI_2949, HTZs                             the simulated F2 hybrids matched those observed for

4                             COMMUNICATIONS BIOLOGY | (2021)4:139 | https://doi.org/10.1038/s42003-021-01658-5 | www.nature.com/commsbio
COMMUNICATIONS BIOLOGY | https://doi.org/10.1038/s42003-021-01658-5 ARTICLE
a b
NonDel_PI_2972
NonDel_PI_12A
NonDel_PI_07A
Del_MG_17A Del_PI_02A, Del_SP_3250
Del_RN_19VLh Del_MG_15A
NonDel_MS_2671 Del_HN_336
NonDel_MT_3210 Del_MG_3380
Inbreeding coefficient (FIS)
NonDel_MS_2688 MIX_MA_05A
Del_MG_12A
Chromosome
HTZ_SP_3254
HTZ_PI_2949 Del_MG_3381
MIX_PI_08A MIX_PI_05A
Del_HN_167
Del_RJ_3015
Del_MG_3379 NonDel_MG_14A
Del_MT_3223
HTZ_MT_3224
-1.0 -0.5 0.0 0.5 1.0
Median inbreeding coefficient (FIS)
HTZ_MT_3135
HTZ_MT_3137
HTZ_MT_3134
NonDel Del HTZ MIX
Fig. 3 Homozygosity relative to Hardy–Weinberg expectations in New and Old World L. infantum isolates. a The box plot shows median and
interquartile ranges of genome-wide inbreeding coefficients (FIS). Values are generally high for New World isolates. Values for HTZ isolates, however, all
occur below the second quartile and strong excess heterozygosity is suggested in HTZ_MT_3134, HTZ_MT_3135, and HTZ_MT_3137. b Relatively low
genome-wide FIS in HTZ isolates is not driven by values from a subset of chromosomes. Values appear low throughout the genome. Circle fill color
indicates New vs. Old World origin and read-depth profile on chr31.
Del_MT_3223 and NonDel_MT_3210. Similar F2 hybridization simulated individual genome-wide SNP diversity in three variations
events may also explain the outlying phylogenetic positions of relating to bottleneck (yes/no in Mato Grosso founder population),
samples such as NonDel_MG_14A or NonDel_MS_2688 (Figs. 4 admixture type (hard introgression and/or permanent migration vs.
and 5a, and Supplementary Fig. 6). temporary genetic exchange), and rate of gene flow (constant or
variable over time). We also ran simulations for two implausible
models of Mato Grosso do Sul—Mato Grosso divergence, “strict
Demographic drivers of patchy population structure and isolation” (SI, i.e., gene flow between the two populations
hybridization events. The L. infantum group from Mato Grosso permanently ceased) and “ancient migration” (AM, i.e., gene flow
do Sul stood out in above analyses given its complete lack of Del between the two populations permanently ceased following an early
genotypes and its basal phylogenetic position relative to all other period of continuous gene flow). These served as “negative” controls
New World isolates (Fig. 4). This outgroup also showed higher for the Approximate Bayesian Computation via Random Forests
nucleotide diversity (π) per site (0.046 vs. 0.061, respectively), (ABCRF)37 method, which uses random forests to rank the fit of
more than twice as many private SNP sites per sample (15.3 vs. observed vs. simulated summary statistics. Simulations for Mato
31.8) and lower FST-differentiation to Old World isolates (0.413 Grosso do Sul—Old World and Mato Grosso—Old World
vs. 0.303) than did the rest of the New World sample set population pairs, both assumed to follow an AM with bottleneck
(Table 1). (AMbot) model of divergence, provided additional “positive”
We used a pattern-process modeling approach to better under- controls (see fastsimcoal238 template files and model illustrations
stand the divergence history of the MS group and its paths to in Supplementary Data 7, see Supplementary Codes36, and
contemporary admixture with Mato Grosso isolates. We considered Supplementary Fig. 8). Following expectations, the AMbot model
a “SC” model of divergence, in which Mato Grosso do Sul parasites achieved highest support for both Mato Grosso do Sul—Old World
diverged in isolation from Mato Grosso parasites but later and Mato Grosso—Old World divergence (Table 2). Also as
reestablished gene flow, perhaps due to separate introductions expected, AM and SI models received lowest (near zero) support for
from the Old World into Brazil. Alternatively, Mato Grosso do Sul the Mato Grosso do Sul—Mato Grosso population pair. Support
and Mato Grosso groups may have followed an “isolation with was highest for the SC base model (350 of 1000 votes, Table 2), with
migration” (IM) model of divergence, whereby gene flow between subsequent parameter optimization specifying slightly higher gene
them never fully ceased but Mato Grosso do Sul parasites flow (Migration - MIG) towards Mato Grosso than towards Mato
underwent significant divergence due to local selection pressures Grosso do Sul (Table 2) as also previously indicated by tree-to-
or secondary bottleneck events. For both SC and IM models, we graph optimization and F4-statistics (Fig. 5c). The IMchange model,
COMMUNICATIONS BIOLOGY | (2021)4:139 | https://doi.org/10.1038/s42003-021-01658-5 | www.nature.com/commsbio 5ARTICLE COMMUNICATIONS BIOLOGY | https://doi.org/10.1038/s42003-021-01658-5
Geographic origin
Read-depth
profile on chr31
Fig. 4 Phylogenetic relationships among New and Old World L. infantum isolates. The maximum-likelihood tree was built using a general time-reversible
substitution model with branch lengths corrected for ascertainment bias (i.e., the use of only nonvariant sites in sequence alignment). Pairwise genetic
distances are haplotype-based, defined as the proportion of non-shared alleles across all SNP sites for which genotypes are called for all individuals (i.e., no
missing data in alignment). Outlier isolates NonDel_MS_MAM, NonDel_FR_47, NonDel_PT_151, NonDel_PA_317, and NonDel_PA_85 are excluded. L.
donovani strain MHOM/NP/03/BPK282/0 was temporarily included as an outgroup, to identify an L. infantum sample to subsequently root the tree.
NonDel_ES_1345 became the outgroup. Circle fill color indicates New vs. Old World origin and read-depth profile on chr31. Font color specifies states
sampled in Brazil. Isolates from other countries are labeled in black.
6 COMMUNICATIONS BIOLOGY | (2021)4:139 | https://doi.org/10.1038/s42003-021-01658-5 | www.nature.com/commsbioCOMMUNICATIONS BIOLOGY | https://doi.org/10.1038/s42003-021-01658-5 ARTICLE
a
OW
MS c
NW (non-MS)
Axis 2
MS
MT_3134
MS_2688
MT_3210 MT_3135
* MT_3223 MT_3137
** MT_3224
MG_14A
MT_3254 MT
OW
RJ_3015 Del_RN_1VLh90
Del_RN_2VLh90
RN_13VLh
RN_4VLh90 RN
Axis 1
b 100 100 simulated hybrids putative hybrids
(observed)
100
100
MT MT
MS MS
Fig. 5 Metric multidimensional scaling, simulated mating, and tree-to-graph conversion suggest admixture and hybridization between Del and NonDel
L. infantum groups. a Metric multidimensional scaling separates New and Old World (NW and OW) isolates on two axes of variation (goodness-of-fit =
0.40). NonDel isolates from Mato Grosso do Sul (MS) and Del isolates from Rio Grande do Norte (RN, see asterisk) and Mato Grosso (MT, see double-
asterisk) position at opposite ends of axis 1, the primary axis of divergence within and between NW populations. HTZ isolates occur at intermediate
positions (see pink circles) between these dissimilar groups. Other isolates with such intermediate positions are labeled and may also represent mating
events between dissimilar groups. Gray, white, and cyan fill colors, respectively, indicate NonDel, Del, and MIX read-depth profiles found in the NW. Circles
for OW (NonDel) isolates are green. Five outlier isolates are excluded as in Fig. 4. b Neighbor-joining positions of simulated hybrids (blue font, left tree)
correspond to those of observed HTZ isolates (pink font, right tree) from MT. Hybrids were simulated in two steps. Random 50% haplotype contributions
were first drawn from Del and NonDel isolates observed in MT and MS. The resultant offspring genotypes were then either let diversify through random
mutation or subjected to a second round of Mendelian recombination as before. The same tree topology resulted in each of 100 simulation replicates.
Trees are midpoint-rooted as opposed to outgroup-rooted as in Fig. 4. c Given that mating can create non-treelike divergence patterns within species,
TreeMix66 was used to search iteratively for up to five migration edges that improve the fit of a maximum-likelihood tree built based on Gaussian
approximation of genetic drift among isolates from MT, MS, RN, and OW groups. This input tree (black edges) suggests dichotomous differentiation into
MT/RN and MS/OW clades and has a log-likelihood of 84.9206. Tree-to-graph conversion by addition of a migration edge from MS to MT increases log-
likelihood to 84.9775. No other edges further increase the fit of the input tree. A four-population test76 also supports post-split admixture between MS and
MT or RN, because differences in allele frequencies between MT and RN isolates correlate with those within the other population pair
(F4-statistic = 5 × 10⁻⁵, Z-score = 3.51).
Table 1 Population genetic descriptive metrics for New World and Old World L. infantum groups.
Group (n) K Het. PS PRS π FST to OW FST to MS FST to non-MS
Non-MS (80) 2.01 0.122 1782 15.3 0.046 0.419 0.495 0.000
MS (11) 2.00 0.324 903 31.8 0.061 0.304 0.000 0.495
Old World (17) 2.00 0.195 3069 149.1 0.125 0.000 0.304 0.419
FST between-group fixation index, Het. mean heterozygosity, K mean number of alleles per locus, MS Mato Grosso Do Sul, n sample size, non-MS New World, excluding MS, PRS private sites, per sample,
PS total polymorphic sites, π nucleotide diversity.
HTZ and MIX genotypes are not used in this analysis.
which suggests that rate of gene flow between Mato Grosso do Sul SC model achieved a much clearer majority (627 votes) over IM
and Mato Grosso changed but never fully ceased over time, received (264), SI (65), and AM (44), and posterior probability rose to 61%.
the second-highest support (253 votes). Overall posterior prob- Taken together, the above analyses suggest that hybrid genotypes
ability (0.504), however, was low due to the inclusion of two highly observed in Mato Grosso involve a SC process after the
similar additional variants of each IM and SC base model in bottlenecking of L. infantum from the Old World into Brazil. It
analysis (Table 2). We therefore re-ran the ABCRF process using remains to be established, however, if Mato Grosso do Sul and Mato
only the four base models SC, IM, SI, and AM. In this analysis, the Grosso parasites temporarily diverged in isolation due to
COMMUNICATIONS BIOLOGY | (2021)4:139 | https://doi.org/10.1038/s42003-021-01658-5 | www.nature.com/commsbio 7ARTICLE COMMUNICATIONS BIOLOGY | https://doi.org/10.1038/s42003-021-01658-5
Table 2 Demographic simulation in fastsimcoal2 and model selection by Approximate Bayesian Computation via Random Forests
(ABCRF).
Model Pop. 1/Pop. 2 CV Ndraws
Models of divergence between MT and MS L. AM MT/MS 0.035 474,177
infantum groups IMbot MT/MS 0.086 452,533
IMchange MT/MS 0.243 476,483
IM MT/MS 0.085 474,263
SC MT/MS 0.350 473,082 *Selected model
SCbotnomig MT/MS 0.109 427,249
SCnomig MT/MS 0.078 474,782
SI MT/MS 0.014 466,136
PP = 0.504
MIGMT>>>MS = 0.254
MIGMS>>>MT = 0.300
Models of divergence between MT and OW L. AMbot MT/OW 0.304 432,323 *Selected model
infantum groups AM MT/OW 0.186 458,125
IMchange MT/OW 0.106 470,330
IM MT/OW 0.215 459,566
SC MT/OW 0.161 421,405
SCnomig MT/OW 0.013 464,907
SIbot MT/OW 0.003 385,170
SI MT/OW 0.012 409,244
PP = 0.485
FOU = 0.204
Models of divergence between MS and OW L. AMbot MS/OW 0.385 413,704 *Selected model
infantum groups AM MS/OW 0.161 472,457
IMchange MS/OW 0.145 473,388
IM MS/OW 0.170 471,073
SC MS/OW 0.025 471,677
SCnomig MS/OW 0.031 472,251
SIbot MS/OW 0.035 463,789
SI MS/OW 0.048 457,084
PP = 0.521
FOU = 0.292
CV classification vote, i.e., the number of times a model is selected in a forest of 1000 trees (the model with the most votes corresponds to the model best suited to the dataset), FOU bottleneck size, i.e.,
the fraction of prior population size at the end of the bottleneck, MIGx»>y migration rate from x to y, MS Mato Grosso do Sul, MT Mato Grosso, Ndraws number of parameter draws simulated by
fastsimcoal2 as input for ABCRF, OW Old World, Pop. population, PP ABCRF approximation of the posterior probability of the selected model.
In fastsimcoal2 simulation, values for past and present population sizes were drawn randomly from a uniform distribution between 100 and 106 individuals. Values for time of secondary contact were
drawn randomly from a uniform distribution between 0 and 2 × 10⁴ generations before present. Values for relative migration rates between populations were drawn randomly from a log-uniform
distribution between 10−10 and 0.1. Values for bottleneck size were drawn randomly from a uniform distribution between 0.05 and 0.5. The mutation rate was fixed at 1.99 × 10⁻⁹ mutations per bp on all
chromosomes. The ten different demographic models are illustrated in Supplementary Fig. 8 and template file content is provided is provided in Supplementary Data 7 at Zenodo36.
independent importations or whether temporary isolation began differentiation) on most other chromosomes. This subtle chr31-
after common introduction to the New World. specific divergence from Del isolates was not statistically
significant (Tukey and Kramer (Nemenyi) test) but was
Introgression disrupts monophyletic ancestry of Del isolates. substantiated by analysis focused on “Del-distinctive” sites, i.e.,
In light of the ample evidence for frequent hybridization descri- sites at which >90% of Del isolates and 1 Mb) chromosomes (i.e., chromosomes 26 to 36), chr31 chr30, 71% for chr32, 74% for chr33, 66% for chr34, 46% for
ranked highest in FIS for these 3 samples and for Non- chr35, and 37% for chr36.
Del_MA_01A (FIS = 0.85). For all other samples, the median These observations are consistent with the hypothesis that the
rank of FIS for chr31 relative to other large chromosomes was 3. nesting of Piauí/Maranhão NonDel isolates in Fig. 4 represents an
We also noted that FST between the nested NonDel clade and admixture process between Del isolates and closely related
phylogenetically similar Del isolates increased specifically on NonDel isolates, whereby introgression of polymorphisms on
chr31 (Supplementary Fig. 7), showing higher values only on the chr31 may be preserved more so than on other chromosomes
(small) chromosomes 3 and 16 and near zero (i.e., no during subsequent backcrossing or mitotic haplotype selection
8 COMMUNICATIONS BIOLOGY | (2021)4:139 | https://doi.org/10.1038/s42003-021-01658-5 | www.nature.com/commsbioCOMMUNICATIONS BIOLOGY | https://doi.org/10.1038/s42003-021-01658-5 ARTICLE
Fig. 6 Ecto-3’-nucleotidase and ecto-ATPase activity correlates to read-depth profiles on chr31. a Ecto-3′-nucleotidase activity was quantified by
measuring the rate of inorganic phosphate (Pi) release during adenosine 3’-AMP hydrolysis as described in Freitas-Mesquita et al.28. Bar plots show mean
and S.E. for at least three replicate assays (n = 3 independent experiments). Welch’s t-test was applied to test for statistical significance between pairs of
samples at *p < 0.05. Results indicate a significant reduction of enzymatic activity in Del isolates relative to all NonDel and HTZ isolates. Activity appears
significantly higher in NonDel_SC_3737 than in other NonDel and HTZ samples. Activity also appears significantly higher in NonDel_PI_2972 relative to
HTZ_3134_B1 and HTZ_2949_B2 subcultures. b Ecto-ATPase activity was quantified with the same protocol except replacing 3’-AMP with equimolar ATP
and Mg2+. T-tests between NonDel and Del isolates suggest higher ecto-ATPase activity in Del isolates than in all NonDel isolates, but larger samples
sizes are required to substantiate the effect.
events13. This possibility of introgression perturbing Del mono- enzyme thought to be involved in purine salvage pathways40,41
phyly is also supported by evaluating the likelihood of trees independent of ecto-3’-nucleotidase) in Del and NonDel isolates
constructed under a constraint that forces Piauí/Maranhão (Fig. 6b). Higher ecto-ATPase activity occurred in Del isolates
NonDel isolates to group outside of the Del clade, specifically, than in NonDel isolates (p < 0.05), suggesting the possibility that
applying newick constraint = ((Piauí/Maranhão NonDel isolates, alternative molecular pathways compensate effects of ecto-3’-
Mato Grosso do Sul NonDel isolates), (all Del isolates)). The nucleotidase deletion on chr31.
Shimodaira–Hasegawa test39 suggests that maximum likelihood
resulting from such constrained tree construction is not
Discussion
significantly lower than that of Fig. 4’s unconstrained
Our results reveal the widespread distribution of a major genetic
maximum-likelihood tree (p = 0.431). A constraint forcing
alteration found in New World L. infantum isolates, clarifying
Honduran Del samples out of the Del clade, by contrast, does
that a four-gene deletion on chr31 predominates in southeastern,
result in a significantly less likely tree (p = 0.045), further
eastern, and (unlike previously suggested27) northeastern Brazil.
substantiating the geographically widespread expansion of a
In addition to two Panamanian non-MON-1 samples that do not
monophyletic Del clade. Nevertheless, we cannot conclude
show this drug resistance-associated mutation34, a divergent
definitively whether the deletion found in all isolates of this
non-deletion group occurs in the southwestern Brazilian state of
clade stems from a single ancestral mutant lineage or if multiple,
Mato Grosso do Sul. Coalescence modeling suggests a SC process
closely related ancestral lineages experienced separate deletion
between these divergent NonDel parasites and members of the
events (see Supplementary Notes 2 and 3, which describe a
widespread, likely monophyletic, Del clade. This admixture
phylogenetic signal on deletion stop site coordinates listed in
involves genome-wide hybridization events that transfer Del
Supplementary Data 2; although stop site variation is minimal, its
chr31 homologs into paraphyletic NonDel groups. Genetic
phylogenetic signal raises the possibility that distinct deletion
exchange between closely related Del and NonDel strains, fol-
mutations or post-deletion modifications occurred among
lowed by further inbreeding and/or mitotic haplotype selec-
progenitors the Del clade).
tion13, may also explain the presence of NonDel isolates with
high homozygosity and low (chromosome-specific) divergence to
Phenotypic consequences of the sub-chromosomal deletion. Del strains in other regions of Brazil, e.g., in Piauí and
Finally, we performed an assay for ecto-3’-nucleotidase activity Maranhão.
(Fig. 6a) in Del, NonDel, and HTZ samples representing different The extensive evidence of genetic exchange we describe sub-
levels of phylogenetic similarity and various states of Brazil. stantiates the importance of this process in trypanosomatid
Results demonstrate heavily reduced ecto-3’-nucleotidase activity evolution. We observed a direct effect of hybridization on phe-
in Del isolates relative to HTZ and NonDel isolates (p < 0.05) notype, showing substantially higher activity of the potential
(despite no polymorphisms observed in an ecto-3’-nucleotidase virulence factor ecto-3’-nucleotidase40 in putative F1 hybrids
paralogue present on chr12). Inter-individual variation in ecto-3’- relative to parental Del genotypes. Changes to human patho-
nucleotidase activity also occurred among NonDel and HTZ genicity are also directly implied by the association between locus
samples: NonDel_SC_3737 showed significantly higher activity deletion and miltefosine treatment efficacy suggested by Carnielli
than all other NonDel and HTZ samples (p < 0.05) and et al.27. Our observations add to a growing body of evidence that
NonDel_PI_2972 showed significantly higher activity than genetic exchange plays an important role in the spread of epi-
monoclonal HTZ subcultures HTZ_3134_B1 and HTZ_2949_B2 demiologically relevant traits through natural trypanosomatid
(p < 0.05). Activity in these two subcultures did not significantly populations (e.g., drug resistance in Leishmania donovani9, vector
differ to that in the uncloned HTZ isolate HTZ_MT_3134 infectivity in Leishmania major/L. infantum17, and human
(p < 0.05). We also measured the activity of ecto-ATPase (an infectivity in Trypanosoma brucei42,43) and are consistent with a
COMMUNICATIONS BIOLOGY | (2021)4:139 | https://doi.org/10.1038/s42003-021-01658-5 | www.nature.com/commsbio 9ARTICLE COMMUNICATIONS BIOLOGY | https://doi.org/10.1038/s42003-021-01658-5
“mixed mating model of reproduction”44 in the Leishmania Methods
genus. Similar to observations in Trypanosoma cruzi45, different Parasite samples and whole-genome sequencing. All 201 L. infantum samples
rates of sex and clonality may occur in L. infantum depending on assessed in this study are listed in Supplementary Data 1, which also provides
information on alternative nomenclatures, geographic origin, chr31 read-depth
demographic or ecological variation within landscapes or between profile (i.e., whether or not isolates carry the sub-chromosomal deletion described
the parasite’s evolutionarily native (Old World) and introduced by Carnielli et al.27) and analysis type (i.e., WGS analysis or quantitative real-time
(New World) range. Our study suggests that hybridization occurs PCR). All 59 L. infanum strains sequenced in this study were obtained from the
frequently at SC zones as well as the possibility that mating is Coleção de Leishmania da Fundação Oswaldo Cruz (CLIOC). In all cases Leish-
mania were isolated from patients as part of normal diagnosis and treatment with
generally common, and perhaps advantageous, in non-native no unnecessary invasive procedures and with written and/or verbal consent
and/or bottlenecked groups. Plasmodium parasites, e.g., have recorded at the time of clinical examination. All strains were cultured in biphasic
been suggested to alter sex allocation and inbreeding rates to (Novy–MacNeal–Nicolle (NNN) + Schneider’s) medium prior to genomic DNA
enhance success in the mosquito vector, with rates dependent on extraction (DNeasy Blood & Tissue Kit (Qiagen). Fragmented DNA (mean insert
size = 377 nt) was sequenced using Illumina NextSeq 500 and HiSeq 2500
the diversity of sympatric strains46,47. instruments, and mapped to the MCAN/ES/98/LLM-724 (termed JPCM5 else-
This study also substantiates that CNV is a highly heritable where in the text) reference assembly available at https://tritrypdb.org/common/
form of polymorphism in the Leishmania genus48. In genome- downloads/release-33/LinfantumJPCM5/fasta/ using default settings for BWA-
wide read-depth analysis excluding the focal deletion on chr31, mem v0.7.355. Publicly archived and/or previously published L. infantum
reads27,33–35 were mapped using the same conditions as the newly generated WGS
CNV-based hierarchical clustering mirrored the SNP-based data (see mapping coverage per sample in Supplementary Data 1). For enzymatic
phylogeny and geographical origins of the sample set, suggest- assays (see below), parasites were cultivated in flasks containing Schneider’s
ing that baseline gene copy numbers or deletion/amplification medium with 20% fetal calf serum (FCS) and 2% filtered urine until late log-phase
programs triggered in vitro are conserved among related isolates. expansion. Growth curves were obtained to rule out samples with possible con-
founding differences in replication rate. All parasites used in the experiments
Results do not suggest that any single CNV regime underlies
showed similar replication rates. These parasites had been kept in culture between
enzymatic changes (e.g., ecto-ATPase upregulation) that might be 10 and 20 passages after isolation and cryopreservation by CLIOC.
occurring to compensate loss of function within the deleted locus
on chr31. Such compensation may occur through unique (i.e.,
sample specific) CNV solutions or by various other epigenetic, Phylogenetic, demographic modeling, and selection analyses. SNPs and
post-transcriptional or posttranslational effects. The five copy INDELs were called using population-based genotype and likelihood assignment in
Genome Analysis Toolkit (GATK) v3.7.056 (programs “HaplotypeCaller” and
number differences showing statistical significance between Del “GenotypeGVCFs”). We excluded tightly clustered variants (i.e., more than three
and New World NonDel groups do nevertheless deserve further SNPs or INDELs within ten bases) as well as those achieving 100,000 random parameter sets simulated per divergence
tion structure and hidden genetic diversity in future disease model, 12 summary statistics (total number of polymorphic sites; mean total
control. heterozygosity; number of segregating sites per population; number of private sites
10 COMMUNICATIONS BIOLOGY | (2021)4:139 | https://doi.org/10.1038/s42003-021-01658-5 | www.nature.com/commsbioCOMMUNICATIONS BIOLOGY | https://doi.org/10.1038/s42003-021-01658-5 ARTICLE
per population; number of pairwise differences per population; mean and SD of 50.0 mM HEPES (pH 7.4), and 3.0 mM 3’-AMP. Reactions were terminated by
segregating sites over populations; and mean and SD of pairwise differences over adding 1.0 ml ice-cold 25% charcoal in 0.1 M HCl and centrifuged at 1500 × g for
populations) were computed in ARLSUMSTAT v3.5.267. Model selection and 15 min to remove nonhydrolyzed 3’-AMP. Equal volumes of supernatant and Fiske
parameter estimations followed by ABCRF using 1000-tree regression forests in the & Subbarow reagent (0.1 ml each) were mixed to affect the (phosphate-dependent)
“abcrf” package v1.737 in R v3.4.161. Observed genotypes of putative F1 and F2 reduction of ammonium molybdate to phosphomolybdate and absorbance at 660
hybrids were not included in the calculation of summary statistics for modeling nm in samples and Pi standards measured after 30 min to derive sample Pi. Ecto-
divergence between New World groups. ATPase activity was measured with the same protocol except replacing 3’-AMP
Selection analyses between predefined groups (deletion-carrying and non- with 1.0 mM adenosine 5’-triphosphate and 1.0 mM MgCl2. Experiments were
deletion type isolates) were performed by assessing site-wise FST neutrality with performed in technical triplicates using IOCL 2664, 2666, 2972, 3598, and 3634,
BayeScan v2.168. We set prior odds for the neutral model to 100 and retained loci and monoclonal subcultures 2949 B2 and 3134 B1.
with log10 q-values < −2, where false discovery rate is expected to fall below 1%.
Results were then filtered for coding regions and SNP and INDEL effects predicted
with SNPEff v3t69 using the JPCM5 annotation file available at https://tritrypdb. Statistics and reproducibility. Statistical analyses of the data, sample sizes,
org/common/downloads/release-33/LinfantumJPCM5/gff/data/. number of replicates, and general information on the reproducibility of experi-
ments are depicted at each specific description within the “Methods” section.
Chromosomal and gene copy number analyses. To estimate chromosomal somy,
Reporting summary. Further information on research design is available in the Nature
we calculated mean-read-depth (m) for successive 1 kb windows using SAMtools
v0.1.1870 “depth” (default options) and then calculated a “median-of-means” (Mm) Research Reporting Summary linked to this article.
for each chromosome. We let the 40th percentile (p40) of Mm values represent
expectations for the disomic state, estimating copy number for each chromosome Data availability
by dividing its Mm by the sample’s p40 value and multiplying by two. Copy New sequence data generated by this study is available at Sequence Read Archive (SRA)
numbers were then visualized with the “heatmap.2” function in the “gplots” BioProject PRJNA658892 (BioSamples SAMN15892565 – SAMN15892623). All other
package v3.0.1.271 in R v3.4.161. Samples were organized in the heatmap based on relevant data are available from the corresponding author on reasonable request.
UPGMA clustering of Bray–Curtis dissimilarities measured using the “vegdist”
function in the “vegan” package v2.4.472.
Gene copy number analyses were performed using scripts from Imamura et al.9. Code availability
Briefly, we calculated median read-depth for each coding region (c) in the JPCM5 Codes can be accessed at the public repository Zenodo (http://zenodo.org) under the
annotation file and then divided each c value by the median of c-values across the https://doi.org/10.5281/zenodo.4276188736.
chromosome to obtain a normalized copy number estimate (s) for each coding
region of each sample. We then averaged s-values from corresponding coding
regions across samples within each of two predefined groups (deletion-carrying Received: 11 March 2020; Accepted: 4 January 2021;
and non-deletion type isolates). Coding regions for which group means differed by
>0.3 were selected for MWU significance tests using SciPy v1.3.173. Following
Bonferroni correction (i.e., dividing the standard p-value cutoff of 0.05 by the
number of coding regions submitted to MWU), we generated a heatmap of s-values
at coding regions, which showed significant differences between the two groups,
organizing samples by UPGMA clustering of Bray–Curtis similarities as in References
chromosomal somy visualization above. Coding regions with significant MWU 1. Petit, R. J. Early insights into the genetic consequences of range expansions.
results were also reassessed by ANCOVA using the “car” package v3.0.274 in R Heredity 106, 203–204 (2011).
v3.4.161 to determine whether p-values remained significant after controlling for 2. Kolbe, J. J. et al. Genetic variation increases during biological invasion by a
sample geographic origin. Isolates from Teixeira et al.33 (see Supplementary Cuban lizard. Nature 431, 177–181 (2004).
Data 1) were excluded from gene copy number analyses as these had not been 3. Kuhls, K. et al. Comparative microsatellite typing of new world Leishmania
made available as complete read-pairs in public sequence archives. infantum reveals low heterogeneity among populations and its recent old
world origin. PLoS Negl. Trop. Dis. 5, e1155 (2011).
Monoclonal subcultures and qPCR. Single cell sorting was performed on a 4. Leblois, R., Kuhls, K., François, O., Schönian, G. & Wirth, T. Guns, germs and
MoFLO ASTRIOS Cell Sorter (Beckman Coulter) at the Oswaldo Cruz Institute in dogs: on the origin of Leishmania chagasi. Infect. Genet. Evol. 11, 1091–1095
Rio de Janeiro, Brazil. L. infantum isolates IOCL 2949 and IOCL 3134 entered cell (2011).
sorting at 106 cells/µl and individual cells were collected in a 96-well plate, each 5. Gradoni, L. & Gramiccia, M. Leishmania infantum tropism: strain genotype or
well containing 200 µl Schneider’s medium supplemented with 2% FCS. Wells were host immune status? Parasitol. Today 10, 264–267 (1994).
inspected five days later using an inverted microscope and liquid from those 6. Sulahian, A., Garin, Y. J., Pratlong, F., Dedet, J. P. & Derouin, F. Experimental
containing single parasites transferred to separate tubes of NNN. Parasites were pathogenicity of viscerotropic and dermotropic isolates of Leishmania
pelleted three days later at 1,200 g for 15 min and DNA extracted with DNeasy infantum from immunocompromised and immunocompetent patients in a
Blood and Tissue Kit (Qiagen). Primer sequences 5′-ACGATCGGCCTCAAAAC murine model. FEMS Immunol. Med. Microbiol. 17, 131–138 (1997).
ACT-3′ (forward) and 5′- GGTGAAGTCTTCGTCCGTGT-3′ (reverse) were 7. Guerbouj, S., Guizani, I., Speybroeck, N., Le Ray, D. & Dujardin, J. C.
designed to target LinJ.31.2380 (within the chr31 deletion site), and primer Genomic polymorphism of Leishmania infantum: a relationship with clinical
sequences 5′-CGAACCTTGGAGCTTCCCTT-3′ (forward) and 5′-TCAAGGTTG pleomorphism? Infect. Genet. Evol. 1, 49–59 (2001).
TGTCCGTCGAG-3′ (reverse) were designed to target LinJ.31.2330 (downstream 8. Dumetz, F. et al. Molecular preadaptation to antimony resistance in
of the chr31 deletion site). IOCL 2666 was used as a reference sample to calibrate Leishmania donovani on the Indian subcontinent. mSphere 3, e00548–17
the ΔΔCt method described by Livak and Schmittgen75. Briefly, qPCR cycle (2018).
thresholds (Ct values) for both chr31 sequence targets were determined for the 9. Imamura, H. et al. Evolutionary genomics of epidemic visceral leishmaniasis
samples of interest (IOCL 2949 and 3134, and their monoclonal subcultures) and in the Indian subcontinent. eLife 5, e12613 (2016).
for IOCL 2666. Ct values for the LinJ.31.2330 target were assumed to be equivalent 10. Ishikawa, E. A. Y. et al. Genetic variation in populations of Leishmania species
between the sample of interest and the reference in the case of equal quantities of in Brazil. Trans. R. Soc. Trop. Med. Hyg. 96, S111–121 (2002).
input DNA. Deviations from the 1 : 1 ratio for the LinJ.31.2330 target were used to 11. Cupolillo, E. et al. Genetic polymorphism and molecular epidemiology of
normalize Ct ratios for the LinJ.31.2380 target between the sample of interest and Leishmania (Viannia) braziliensis from different hosts and geographic areas in
the reference. The normalized ratios were considered to represent a fold change Brazil. J. Clin. Microbiol. 41, 3126–3132 (2003).
estimate of gene dose within the deletion site relative to that within downstream 12. Victoir, K. & Dujardin, J.-C. How to succeed in parasitic life without sex?
sequence. The qPCR reaction used 0.2 nM primer input and 1× SYBR Green Asking Leishmania. Trends Parasitol. 18, 81–85 (2002).
Master Mix with 40 amplification cycles and an annealing temperature of 62 °C. 13. Barja, P. P. et al. Haplotype selection as an adaptive mechanism in the protozoan
Three experiments were performed per sample, each in technical triplicate. The
pathogen Leishmania donovani. Nat. Ecol. Evol. 1, 1961–1969 (2017).
same fold change estimation protocol was performed in follow-up analysis of
14. Romano, A. et al. Cross-species genetic exchange between visceral and
monoclonal subcultures 2949 B2 and 2949 G1 using the parental culture IOCL
cutaneous strains of Leishmania in the sand fly vector. Proc. Natl Acad. Sci.
2949 as the reference.
USA 111, 16808–16813 (2014).
15. Cortes, S. et al. In vitro and in vivo behaviour of sympatric Leishmania (V.)
Ecto-3’-nucleotidase and ecto-ATPase activity measurement. Ecto-3′-nucleo- braziliensis, L. (V.) peruviana and their hybrids. Parasitology 139, 191–199
tidase activity was quantified by measuring inorganic phosphate (Pi) release during (2012).
adenosine 3’-monophosphate (3’-AMP) hydrolysis as in Freitas-Mesquita et al.28. 16. Akopyants, N. S. et al. Demonstration of genetic exchange during cyclical
Briefly, L. infantum promastigotes (107 cells/ml) were incubated at 25 °C for 1 h in development of Leishmania in the sand fly vector. Science 324, 265–268
0.5 ml reaction mixture containing 16.0 mM NaCl, 5.4 mM KCl, 5.5 mM D-glucose, (2009).
COMMUNICATIONS BIOLOGY | (2021)4:139 | https://doi.org/10.1038/s42003-021-01658-5 | www.nature.com/commsbio 11You can also read