Columbia Center on Global Energy Policy 16 March 2021
←
→
Page content transcription
If your browser does not render page correctly, please read the page content below
Columbia Center on Global Energy Policy
                                                                       16 March 2021

    E. Larson, C. Greig, J. Jenkins, E. Mayfield, A. Pascale, C. Zhang, J. Drossman, R. Williams, S. Pacala, R. Socolow, EJ Baik, R. Birdsey, R. Duke, R. Jones, B. Haley, E. Leslie,
    K. Paustian, and A. Swan, Net-Zero America: Potential Pathways, Infrastructure, and Impacts, interim report, Princeton University, Princeton, NJ, December 15, 2020.
    Full report available for download at https://environmenthalfcentury.princeton.edu/.

1
FIVE MODELED LEAST-COST PATHS TO NET-ZERO IN 2050 SHOW
                      IMPLICATIONS OF DIFFERENT APPROACHES
                                            2020         2050                                   Net-Zero America pathways, 2050
                                                           REF                   E+                     E-                 E- B+                 E+ RE-                 E+ RE+
                                                       No new policies   High electrification        Less high       Less electrification,   High electrification, High electrification,
                                                      (EIA, AEO 2019)     (vehicles & bldgs)       electrification      high biomass           constrained RE        all RE by 2050

                                            uranium
    Primary Energy Supply, EJ (HHV basis)

                                            coal

                                             gas
                                                                                                                                                                               wind
                                                                          76%                    64%                  67%                    56%                   100%
                                                                          less
                                                                         oil &
                                                                           gas
                                                                         than
                                             oil                         2020                                                                                                   sun

                                                                                                0.9 to 1.7 GtCO2/y sequestered in 2050                                           bio        0.7 GtCO2/y
2                                                                                                          in these 4 scenarios                                                            captured/used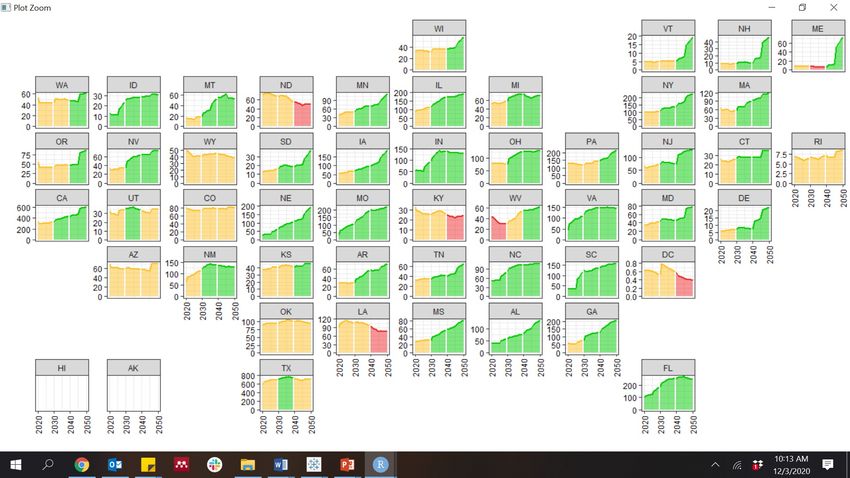
BIG, BUT AFFORDABLE, TRANSITION: SHARE OF GDP SPENT ON
    ENERGY IS BELOW HISTORICAL LEVELS
                                                      Oil price shocks                                                    E+ RE+
                                                                                                                          E-
                                                                                                                          E- B+
                                                                                                                          E+
       Energy System Cost (% of GDP)

                                                                                  Global financial crisis                 E+ RE-
                                                                                                                          REF

                                                                                                                                   E+ RE+
                                                                                                                                   E-
                                                             Energy System Cost                                                    E- B+
                                                                (% of GDP)                                                         E+
                                                                                                                                   E+ RE-
                                       Notes
                                                                                                                                   REF
                                       • Significant reduction in exposure to oil price shocks in net-zero scenarios.
                                       • All modeled cases, including REF, assume low oil & gas prices. Because demand
                                         for oil and gas is higher in REF, it is plausible that oil and gas prices would also
                                         be higher. In that case, net-zero pathways may cost less than REF.

3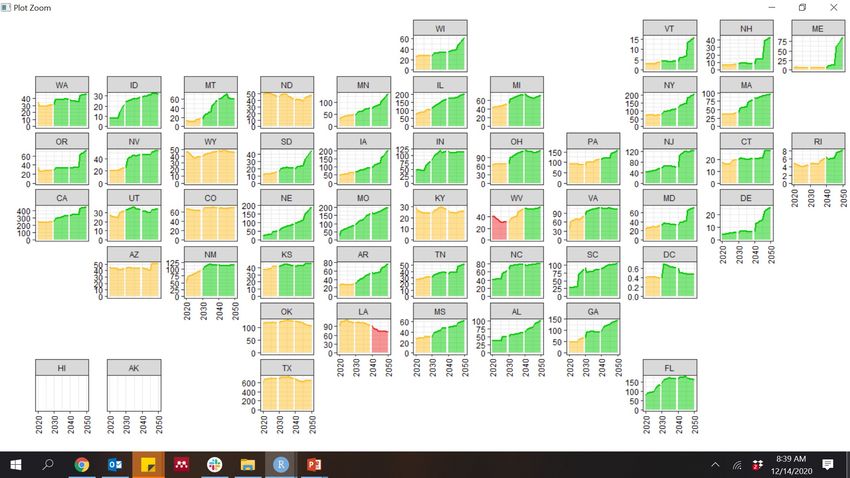
CHALLENGE 1: MOBILIZING CAPITAL (AND LABOR);
     2.5 T$ OF ADDITIONAL CAPITAL SPENT OVER THE NEXT DECADE
    Total additional capital invested, 2021-2030, by sector and subsector for any of the net-zero pathways vs. REF (billion 2018$)

         Includes capital invested pre-financial investment decision (pre-FID) and capital committed to projects under construction in 2030 but in-service in later years.
         All values rounded to nearest $10b and should be considered order of magnitude estimates. Incremental capital investment categories totaling less than $5B excluded from graphic.
         Other potentially significant capital expenditures not estimated in this study include establishment of bioenergy crops, decarbonization measures in other industries
4        besides steel and cement, non-CO2 GHG mitigation efforts, and establishing enhanced land sinks.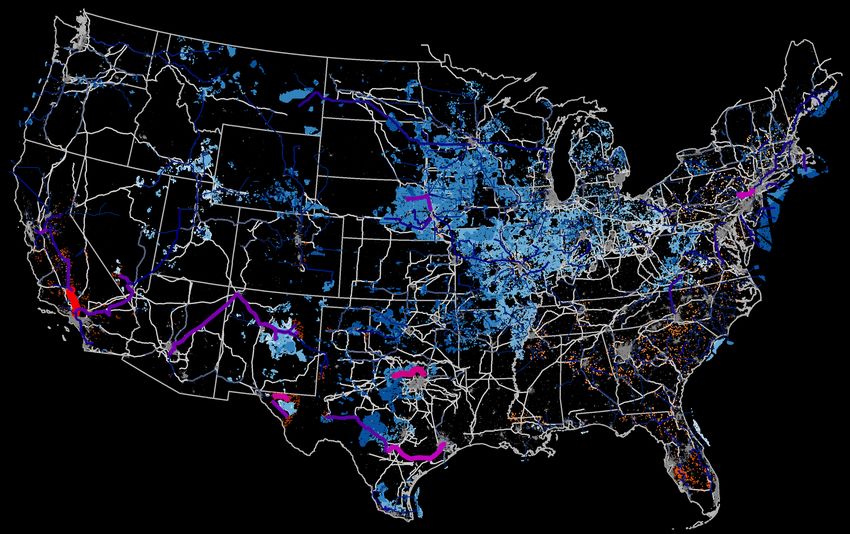
CHALLENGE 2: TRADEOFFS, NOT AGGREGATE COSTS;
    MORE REAL OPTIONS MEANS GREATER PROBABILITY OF SUCCESS
    ordinal ranking
    100 = most challenging                                                                          E+
                                                  Electrification
      0 = least challenging                         100                                             E-
                                                     90
                                                                          Solar/wind                E-B+
                           CO2 pipelines             80
                                                                           capacity
                                                     70                                             E+RE-
                                                     60
                                                                                                    E+RE+
                                                     50
                                                     40
                                                     30
                                                     20                              High-voltage
                     CO2 storage
                                                     10                              transmission
                                                      0

                           Nuclear                                                   Labor
                           capacity                                                mobilization

                                      Bioenergy                       Capital
                                       industry                     mobilization

5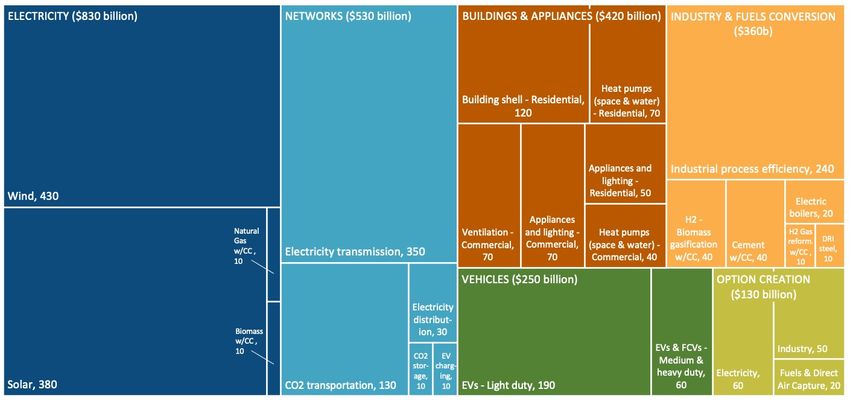
EXTENSIVE SOLAR, WIND & TRANSMISSION BUILD ACROSS U.S.
        As of end of 2020
         (modeled year)                                                                                                    2020
                   Wind Solar
    Capacity installed (TW)
                    0.15  0.07
    Land used (1000 km2)
      Total          58    1.08
      Direct        0.6    0.97

    Transmission capacity
      GW-km         320,000

    Transmission Capacity (GW)

6                      Note: Transmission expansion is visualized along existing rights of way (>160 kV); paths are indicative not definitive.
EXTENSIVE SOLAR, WIND & TRANSMISSION BUILD ACROSS U.S.
2020 - 2050
(cumulative) 2050 E+
Wind Solar
Capacity installed (TW)
1.48 1.45
Land used (1000 km2)
Total 550 38.3
Direct 5.5 34.5
Capital invested (2018$)
Trillion $ 1.84 1.39
Transmission capacity
1,012,000
GW-km
(3.2x 2020)
Transmission Capacity (GW)
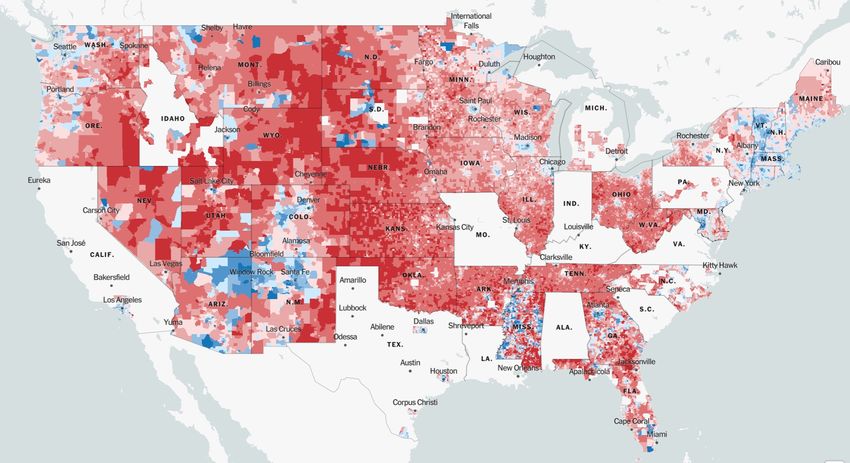
7 Note: Transmission expansion is visualized along existing rights of way (>160 kV); paths are indicative not definitive.CHALLENGE 3: ALL POLITICS IS LOCAL; DECISION SUPPORT NEEDS
TO OFFER GRANULAR GUIDANCE AND POLITICALLY SALIENT RESULTS
Image source:
8MOST STATES SEE NET GROWTH IN ENERGY-RELATED EMPLOYMENT,
BUT MAJOR SHIFTS IN LOCAL ECONOMIES MUST BE MANAGED
Annual employment based on
downscaled E+ scenario
(thousand jobs)
Green, yellow, and red indicate average annual employment
in a decade is >15% above, within + 15%, or >15% below
2021 employment, respectively.
Note: Spatial redistribution of solar and wind manufacturing facilities and increasing the domestic manufacturing share offer opportunities
to ameliorate losses in fossil fuel extraction states. For assumptions used here in siting solar and wind manufacturing jobs.
9CLEAN ELECTRICITY AND ELECTRIFYING VEHICLES DELIVER LARGE
AIR QUALITY AND PUBLIC HEALTH IMPROVEMENTS ACROSS STATES
Coal Plants
premature deaths per
county (log scale)
- 300
Coal power plant
2020
Motor Vehicles
premature deaths per
county per 100,000 people
10200,000-300,000 PREMATURE DEATHS AVOIDED THROUGH 2050 BY
A NET-ZERO TRANSITION (~$2-3T IN DAMAGES)
Coal Plants
premature deaths per
county (log scale)
- 300
Coal power plant
2050
E+
Motor Vehicles
premature deaths per
county per 100,000 people
11FULL REPORT AND NEW (BETA) STATE-LEVEL DATA VIEWER AVAILABLE AT
https://netzeroamerica.princeton.edu/You can also read