ELECTRICITY SUPPLY CORPORATION OF MALAWI (ESCOM) - EXECUTIVE EXCHANGE ON DEVELOPING AN ANCILLARY SERVICE MARKET FOR SAPP
←
→
Page content transcription
If your browser does not render page correctly, please read the page content below
ELECTRICITY SUPPLY CORPORATION OF
             MALAWI (ESCOM)

                 PRESENTATION

EXECUTIVE EXCHANGE ON DEVELOPING AN ANCILLARY
           SERVICE MARKET FOR SAPP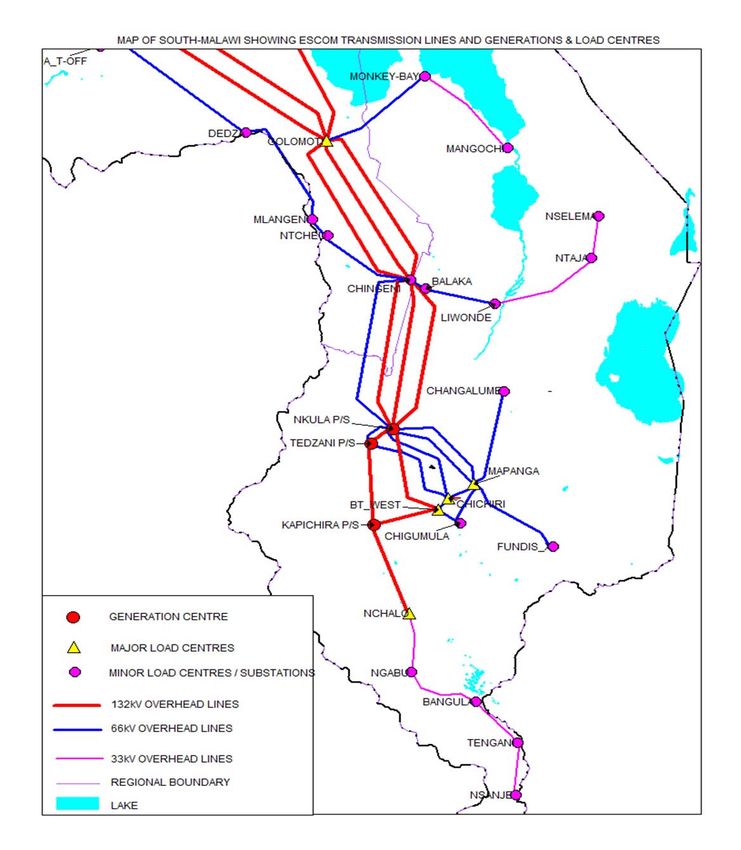
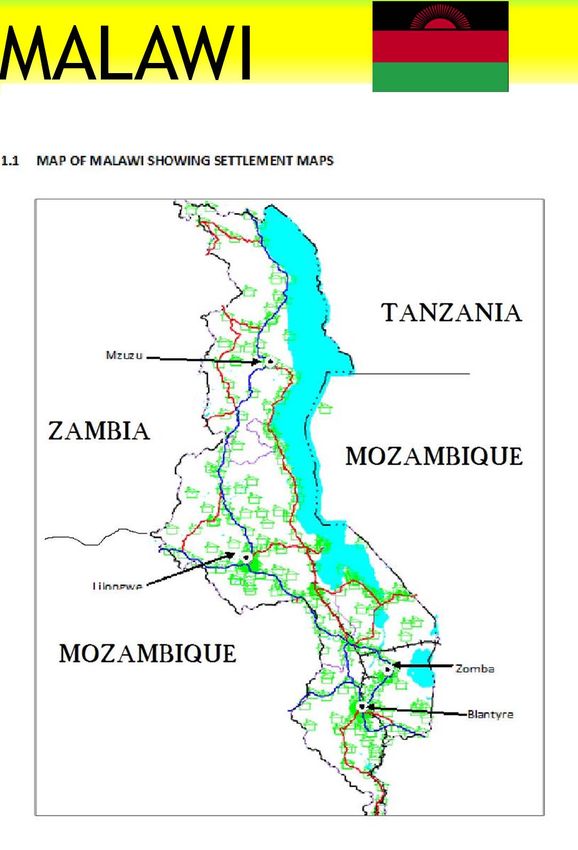
BACKGROUND INFORMATION Malawi-119 thousand square kilometers Malawi population-15 million-2011 Lilongwe is the capital city (Central region) Blantyre commercial (Southern) Mzuzu commercial (Northern) with fast growing industries.
MAP OF MALAWI

ECONOMIC FREEDOM Malawi's economic freedom score is 55.3 making its economy the 118th freest in the 2013 world Index; Malawi is ranked 20th out of 46 countries in the Sub- Saharan Africa region overall score is only a few points below the world average. Malawi scores slightly above average in investment freedom and financial freedom
Electricity Supply Corporation of
Malawi (ESCOM)
is a statutory corporation that generates, transmit,
and distribute electrical energy in Malawi.
The corporation is divided into business units
according to its operations; Generation Business
Unit (GBU), Transmission Business Unit (TBU), and
Distribution Business Unit (DBU).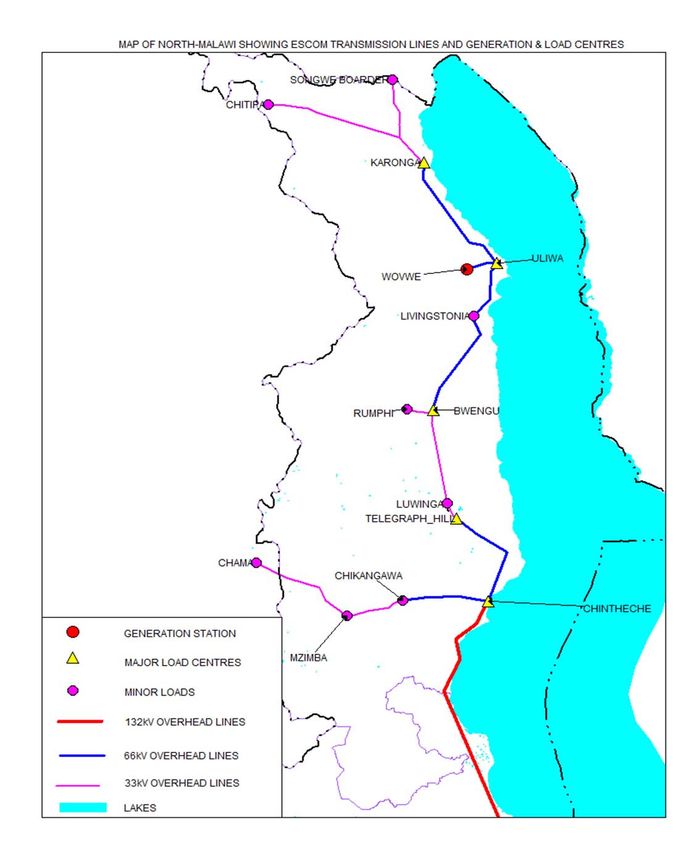
GENERATION BUSINESS UNIT
(GBU)
is a unit that operationally deals with generation of
electricity.
The Business Unit comprise of:
Nkula A Power Station :8X3=24MW
Nkula B Power Station :20X5=100MW
Tedzani 1&2 Power Station :10X4=40MW
Tedzani-3 Power Station :26.35X2=52.7MW
Kapichira Power Station :32.4X2=64.8MW
TOTAL : 281.5MW
ESCOM GRID
Malawi’ s Total
power Demand is
around 360MW and
projected 400MW by
end of 2013;
(Against a total
available capacity of
281.5MW).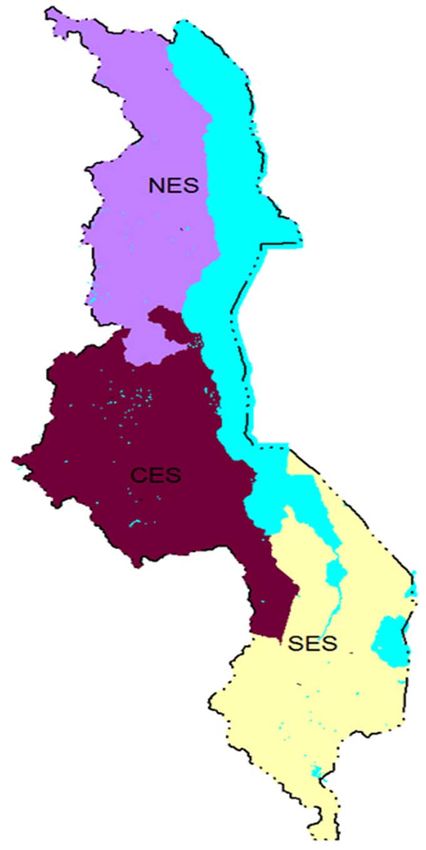
SOUTHERN REGION
Southern region:
Heavy industrials i.e.
Blantyre city, the
commercial city and
Zomba city-
commercial loads;
Illovo Sugar company,
Tea and cotton
companies-industrial
and agricultural loads.
CENTRAL REGION
Central region:
Heavy industrials i.e.
Lilongwe the capital
city-commercial;
Dwangwa (Illovo) Sugar
Company and Flue
cued tobacco-
industrial; Lilongwe,
Kasungu, and Mchinji-
agricultural loads.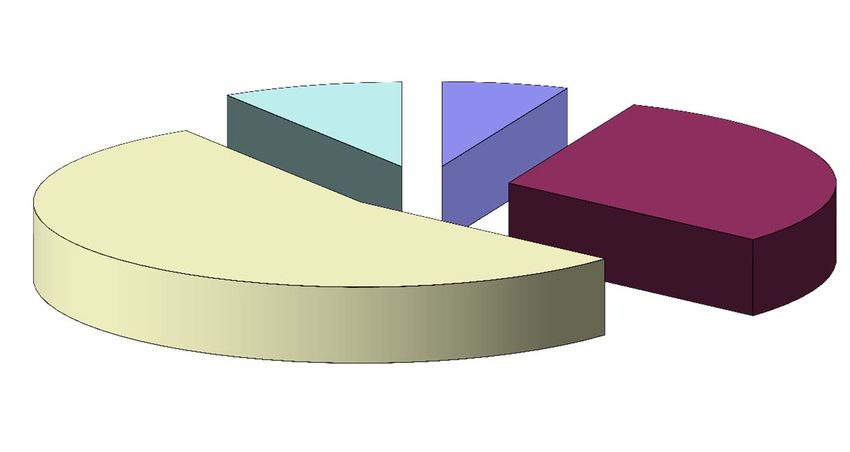
NORTHEN REGION
Northern region:
Mzuzu city-
commercial, Coal
mines, Uranium mines,
Chikangawa Timber Ri-
ply-industrial loads.PROBLEMS and RISKS The system is incurring higher transmission losses (due to I2R- high resistance effect) caused by long transmission distances at low voltages i.e. 66kV and 33kV.; and consequently; Low voltage drops are experienced at the load centers. This means that currents are high in the distribution network hence I2R losses high in the distribution network Imbalance that exists between generation and transmission sometimes deprive supply of electricity when generation capacity is available i.e. low voltages.
PROBLEMS and RISKS /Continued Stopping one machine for annual maintenance purposes is a problem; it means more load shedding and the maintenance procedures are just brief The load shedding processes have also retarded industrial and economic growth in the country, as most investors ran away from a business environment that is marred with power cut short transactions. There is a risk that if Malawi does not receive enough rains or experience again a two year drought that was experienced in the year 1914, Shire River would stop flowing and there would be power crisis. This is so because all the three (100%) generation stations lie along the Shire River.
SOLUTIONS
1.   (MCC-Sponsored) Interconnection to SAPP through
     Mozambique Agreement to be signed by end February;
        a. Proposed line from Matambo-MZ to Phombeya-MW
           (79km)
        b. ESCOM TRADE FAIR

2.   (MCC-Sponsored) CFL Project.

3.   Issuing Licenses to Independent Power Producers (IPP);
SOLUTIONS/ Video
SOLUTIONS /Continued
4.   Power Factor Correction
        a. Installed Capacitor Banks
        b. Installed Capacitor Banks
        c. 30Mvars at Chintheche; 33kV
        d. 10Mvars at Lilongwe A; 11kV
        e. 10Mvars at Lilongwe B; 11kV

5.   Vertical unbundling of the utility
            a. Generation
            b. Transmission
            c. Distribution

6.   Efficient Appliance and Sell Reactive Power as well
SOLUTIONS /Continued
7. Privatization: Partially freeing it from Political influence
and resource squandering.
8. Planning for New Generation stations
a. Fufu falls in the northern region with potential
capacity of 175MW.
b. Kholombidzo falls in the southern region with
potential capacity of 140MW
c. Mpatamanga falls in the southern region with
potential capacity of 120MWJANUARY, 2013 ENERGY TRANSACTIONS
ENTITY USING ENERGY MWh
1 NES 9,205.24
2 CES 44,777.95
3 SES 80,191.02
4 GRID USE & LOSSES 13,235.39
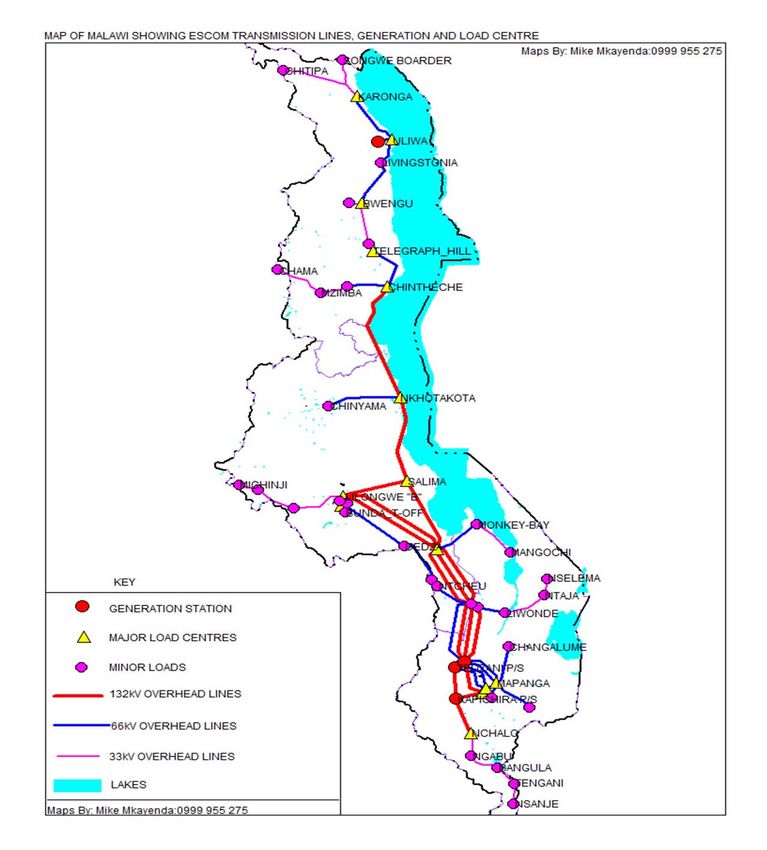
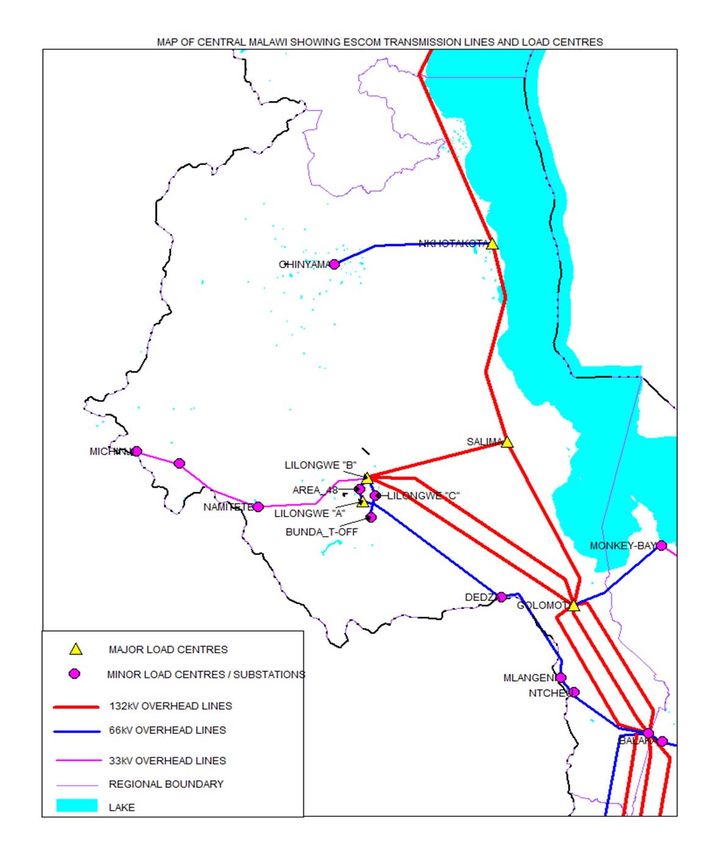
5 TRANSMISSION PURCHASED 147,409.59ESCOM TRANSMISSION AND LOADS
DISTRIBUTION MAPINTER-BUSNESS UNIT ENERGY TRADE
LOSSES
+ GRID NES
CES
SES
6.2%
54.4% 9.0% 6.2%
30.4%
CES
30.4%
54.4%
NES CES SES Grid use + lossesWorst Overloaded Substations
All substations in
Substation Capacity (MVA) Apparent Power (MVA) Real Power (MW) % Loading the table
Liwonde 5.0 5.62 5.23 112.46%
indicate
overload in the
Chinyama 7.5 7.86 7.57 104.82% month of
January 2013.
Lilongwe_A‐T2 12.5 13.81 12.04 110.44%
Note Lilongwe A
T2 is being
overloaded
every month;
this month it
reduced from
119.28% to
110.44%.GEN-Sales Vs. Grid Use+Losses
TREND‐ GEN vs LOSS The graphs
180.00
indicate that
160.00 Generation sales
140.00
increased slightly
as compared to
120.00
December 2012;
ENERGY in MWH'000
100.00 but decreased by
80.00
2.40% as
GEN Sales (MWh '000)
Grid use + losses (MWh '000)
compared to
60.00
January 2012; and
40.00 Grid uses+losses
20.00
almost remained
same.
0.00
Nkula B Unit 8 was
not available in the
MONTHS month.GEN-Sales Vs. SES, CES NES
TREND‐GEN, SES,CES &NES In month of
180.00 January 2013,
160.00
SES almost
remained the
140.00
same as last
120.00 month; while CES
ENERGY IN MWH'000
100.00 increased slightly .
NES
80.00
CES
SES
60.00 GEN Sales (MWh '000)
40.00
20.00
0.00
MONTHSYou can also read