Mike Nasi A Debrief of the Texas Power Outages & The Financial & Policy Implications Partner, Jackson Walker LLP, Senior Advisor, Life:Powered ...
←
→
Page content transcription
If your browser does not render page correctly, please read the page content below
A Debrief of the Texas Power Outages
                          & The Financial & Policy Implications
                              Mike Nasi
                       Partner, Jackson Walker LLP,
                       Senior Advisor, Life:Powered

                       NCC 2021 Spring Annual Meeting
                               April 27, 2021

© Jackson Walker LLP                                       JW.com
2
We Have Been Dodging the Bullet for Several Summers

                                               In August 2019, the
                                                   EEA 1 events
                                                occurred on days
                                               following the day of
                                                 highest demand.

                                                Had the wind been
                                                 low on the day of
                                                highest demand, a
                                               shortage would have
                                                  occurred in both
                                                  2019 and 2020.

Source: ERCOT
For more information, visit lifepowered.org.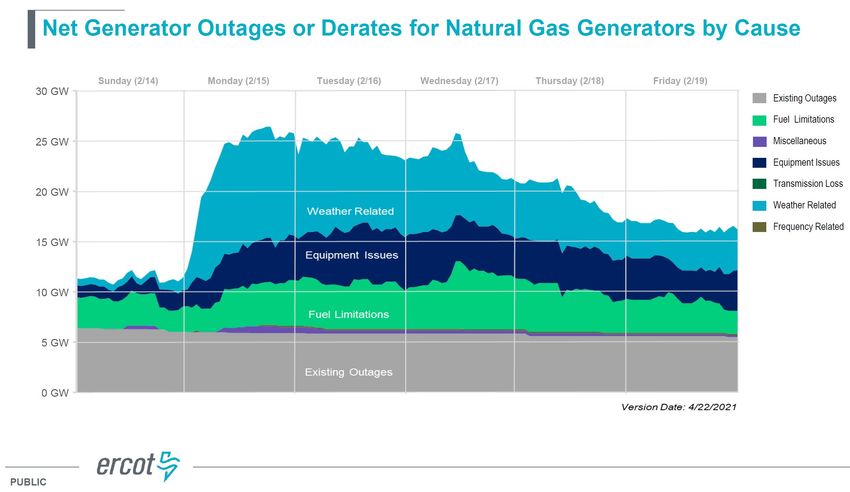
The Bullet Hit Texas This Time: February 15 – 19
                                          Installed Capacity           February 9-19
                                  80000 Wind              28%     Wind Avg            9%                           Forecast Demand
                                        Solar              5%     Solar Avg           1%
                                        Gas               49%     Gas Avg            61%
                                  70000 Coal              12%     Coal Avg           19%
                                                                                                                   White space = Shortages
                                        Nuclear            4%     Nuclear Avg         9%
       Generation and Load (MW)

                                  60000
                                                                                                                                             Solar
                                  50000
                                                                                                                                             Wind

                                  40000                                                                                                      Gas

                                                                                                                                             Coal
                                  30000
                                                                         Demand High – Wind Low: Margin Disappears,                          Nuclear
                                                                           Prices Soar, System Disruption Triggered
                                  20000                                                                                                      Demand

                                  10000                                      Demand Low – Wind High: Gas & Coal
                                                                            Pushed off Grid due to Negative Pricing
                                      0
                                     2/6/2021      2/8/2021     2/10/2021     2/12/2021    2/14/2021   2/16/2021    2/18/2021   2/20/2021

Source: Energy Information Administration Hourly Grid Monitor
For more information, visit lifepowered.org.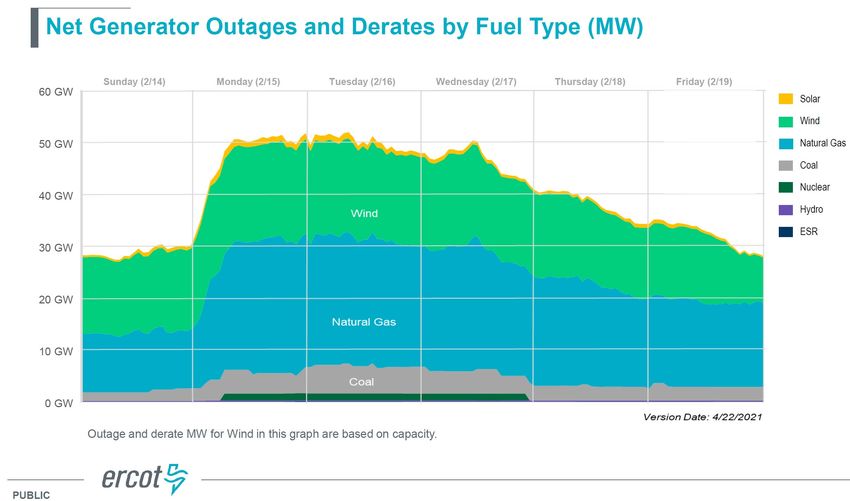
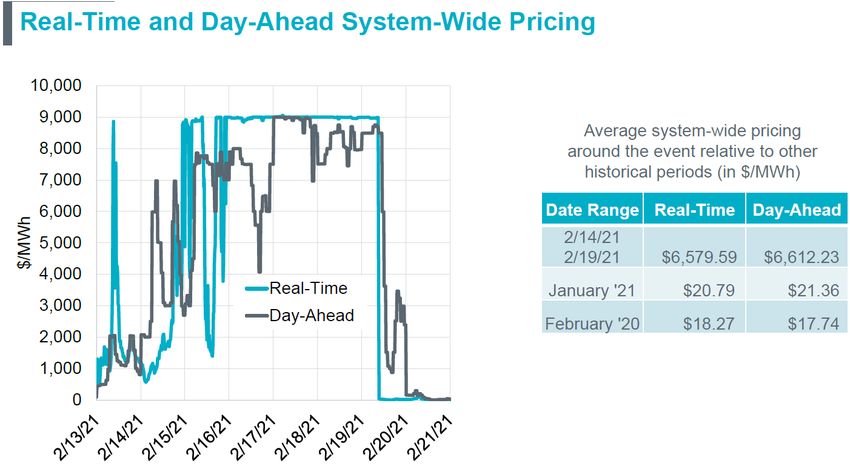
The Night the Grid Almost Went Down for a Month

                                             5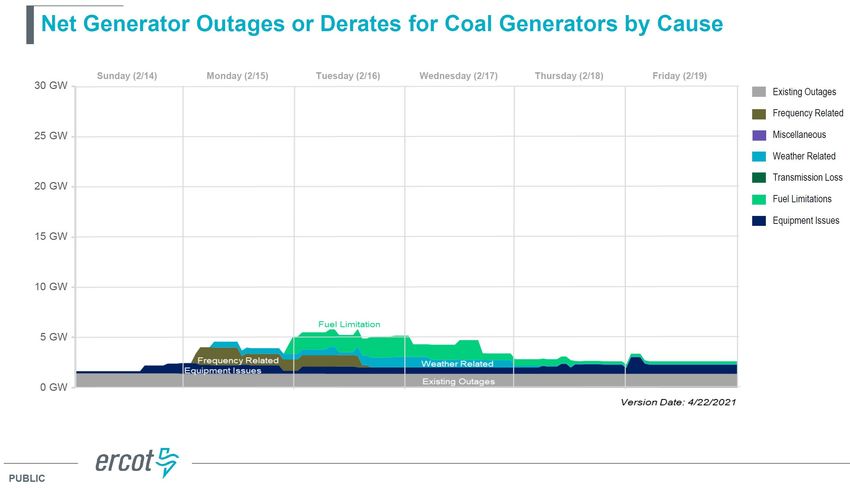
The ERCOT Market Exchange Value
 During the ONE WEEK (of Winter
  Storm Uri Was Larger than the
    PRIOR 4 YEARS COMBINED
                          6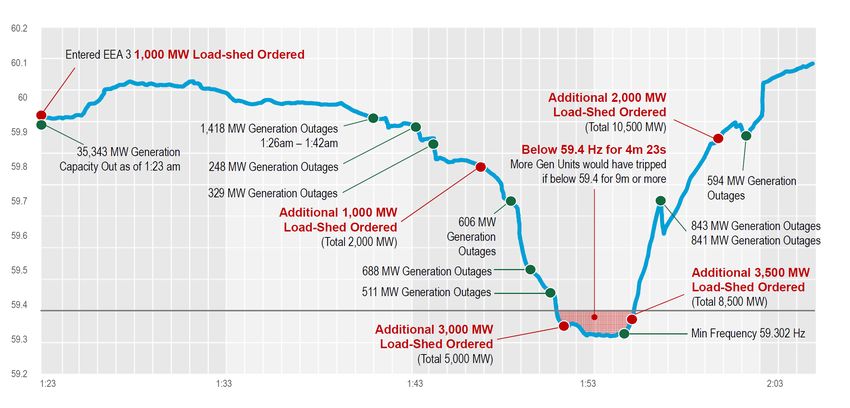
7
8
9
10
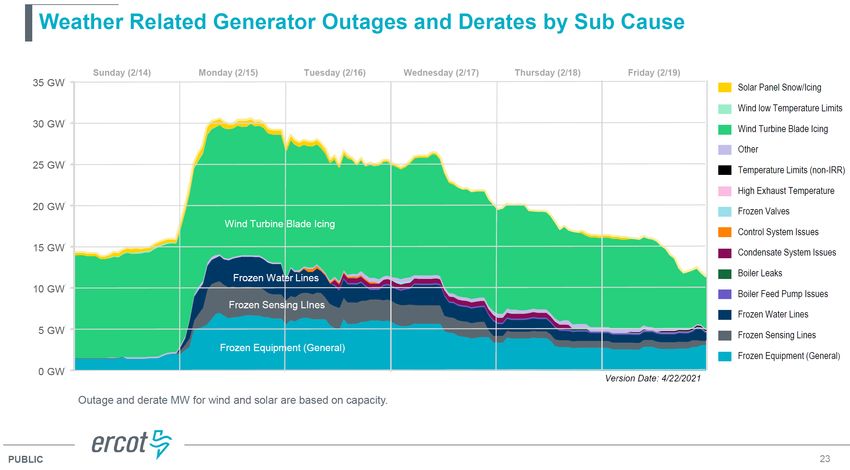
Lack of Wind/Sun
       +

                   11
12
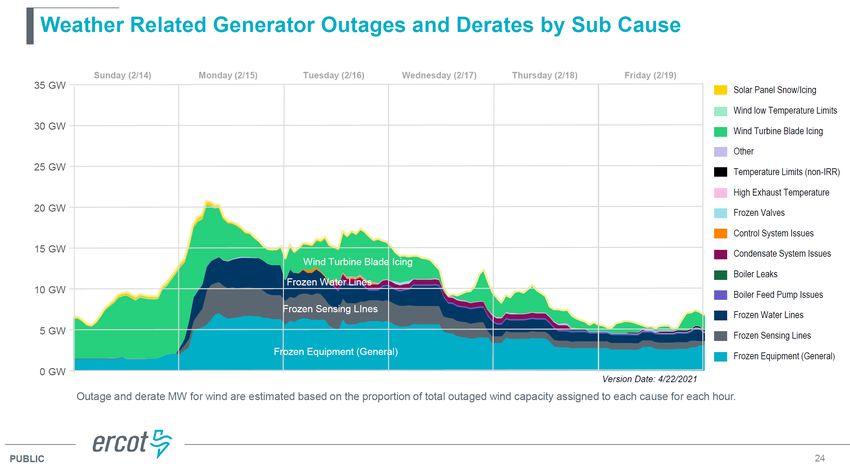
MYTH BUSTING: This Event Was NOT Just About Winterization –
      It Shows that Texas Has a Dispatchable Capacity Shortage
Texas would have still endured over 24 hours of outages even if all thermal remained online
                                        90000
                                                Actual Generation Prior to Blackout      Projection for Blackout Days With No Failures
                                        80000
                                                                                                       Blackouts
                                        70000
             Generation and Load (MW)

                                                                                                                                         Solar
                                        60000                                                                                            Wind

                                        50000                                                                                            Gas

                                        40000                                                                                            Coal

                                        30000                                                                                            Nuclear

                                        20000                                                                                            Demand

                                        10000

                                           0
                                          2/12/2021                  2/14/2021        2/16/2021                  2/18/2021

Source: Energy Information Administration Hourly Grid Monitor
For more information, visit lifepowered.org.
MYTH BUSTING: The Premature Retirement of Coal/Gas
Over the Past Five Years WAS a Major Contributing Factor
- There would have been 80% fewer hours of outages if they were still around
90000
Projection for Blackout Days With No Failures
Actual Generation Prior to Blackout
and Restoration of Retired Coal and Gas
80000
70000
Generation and Load (MW)
60000 Solar
Wind
50000
Gas
40000
Coal
30000 Nuclear
Retired Coal &
Gas = Lost Margin Demand
20000
10000
0
2/12/2021 2/14/2021 2/16/2021 2/18/2021
Source: Energy Information Administration Hourly Grid Monitor
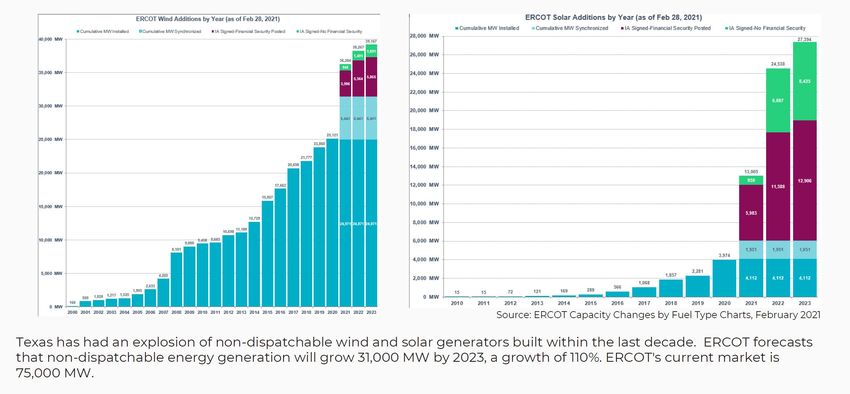
For more information, visit lifepowered.org.THE BUFFER WE LOST – 6200 MWs in 5 years
15ADDITIONS OF
INTERMITTENT RESOURCES
(Wind)
16ADDITIONS OF
INTERMITTENT RESOURCES
(Solar)
17And Gas Additions Did Not Fill the Gap
Annual capacity change of natural
gas, wind, & solar since 2015MISO Concerns = ERCOT Harsh Reality
-Renewable Penetration > 33% Causes Problems
19WILL THINGS GET
BETTER OR
WORSE?
© Jackson Walker LLP JW.comSUMMER – Will We Keep Dodging the Bullet?
90000
July 16, 2018: Close to
80000
Level 1 emergency
70000
Wind +
August 13 and 15, 2019:
Generation and Load (MW)
60000
Solar
Level 1 emergencies, 1
50000 GW away from Level 3
Thermal
emergency
40000
30000 August 14, 2020: Close
Extreme to a Level 1 emergency,
20000 Demand
likely a Level 3 if not for
10000 reduced demand due to
COVID-19
0
2015 2016 2017 2018 2019 2020 2021 2022 2023 2024 2025
Estimated generation and load for a summer day with low wind and solar output, normal
thermal outages and high peak demand.
Source: ERCOT
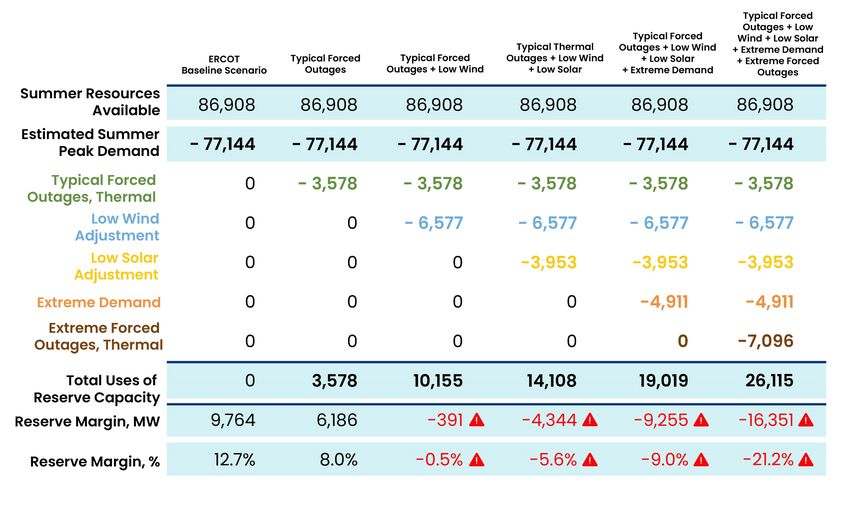
For more information, visit lifepowered.org.This summer will be extremely tight, if not a big problem
ERCOT Report: Low
risk of outages,
sufficient generation to
meet summer demand
based on expected
system conditions.
Reality: Shortages are
likely with any
combination of low
wind and solar and
high demand
1Reserve margins include 1,734 MW of ancillary service reserves that are ordinarily held back until an emergency is declared.
2An additional 2,341 MW of emergency resources are theoretically available, according to ERCOT’s Summer SARA report.
Less than 1,000 MW of reserves after deployment of emergency resources indicates a need for rotating outages.
Source: ERCOTWINTER – The Bullet Looks to Hit Again
80000
70000
60000 Wind +
Generation and Load (MW)
Solar
50000
Thermal
40000
30000
Extreme
20000
Demand
10000
0
2015 2016 2017 2018 2019 2020 2021 2022 2023 2024 2025
Estimated generation and load for a winter day with low wind and solar output, normal thermal outages, and high peak demand.
Source: ERCOT
For more information, visit lifepowered.org.A PREVIEW OF SHOULDER MONTHS TO COME
MILD WEATHER – STILL PROBLEMS: EMERGENCY CONDITIONS CAUSED BY LACK
OF ADEQUATE BUFFER AS SOLAR DROPS OFF, DEMAND STAYS, & WIND LAGS
Source: ERCOT
For more information, visit lifepowered.org.CURRENT POLICY
DEBATE IN TEXAS
LEGISLATURE
© Jackson Walker LLP JW.comEmergency Alerts, Homeowner Consumer
Securitization
Alerts &
Backup & Rate Plans
Rate Plans
Protection
Backup & Relief Coops REPs
HB 12 HB 16
(Raymond) HB 3460
GRID RELIABILITY
(Hernandez) HB 3544 HB 4492
HB 17
(Holland) (Paddie)
(Deshotel)
SB 3, Sect. 15
SB 3, Sect. 1
SB 2194 (so the public knows this will SB 1580
(Hancock)
SB 1757
(Hancock)
(Schwertner)
(Schwertner)
SB 1279
NEVER happen again) SB 1950
(Paxton)
(Hancock)
Weatherization Market Reliability Accountability & RRC-PUC-TCEQ
ERCOT & PUC
Reform Coordination
Out-of-Market Fix Market Refinement Governance Coordination
Weatherization: Reserves: PUC/RRC:
Firming: PUC: TERC:
HB 11 (Paddie), HB 3749 Transmission: SB Capacity ERCOT: HB 1501
HB 4466 (King, P) HB 10 & 3627 (Paddie) HB 13 (Paddie)
HB 2000 (Huberty), (Lucio, III) 1281 & 1282 Market: HB 10 (Paddie) (Dean)
SB 1278 (Hancock) SB 857 (Zaffirini) SB 3, Sect. 3
SB 3, Sect. 12 SB 2109 (Hancock); HB HB 4378 SB 2 (Hancock) SB 1225 (Huffman) (Schwertner) SB 1750
(Schwertner), (Schwertner) SB 3, Sect. 13 4502 (Vasut) (Paddie)
SB 1316 (Lucio) (Hancock)
SB 1682 (Hancock) (Schwertner)
SB 2079 (Menendez)ANIMATED EDUCATIONAL VIDEO SERIES ON ELECTRICITY
(more coming soon!)
VIDEO 1 - Energy 101: Why We Need Electricity
https://youtu.be/ZfrBnddgFAU
VIDEO 2 - Energy 101: The Electric Grid
https://youtu.be/WiMtU6O1SxM
VIDEO 3 - Energy 101: Where Electricity Comes From
https://youtu.be/AKuoIeupGHc
VIDEO 4 - Energy 101: Energy Density
https://youtu.be/6d-HGzZHPG4
VIDEO 5 - Energy 101: Mining and Rare Earths
https://youtu.be/yu3mkFpiGmo
VIDEO 6 - Energy 101: Environmental Technology
https://youtu.be/aodsngzbZqA
27QUESTIONS?
CONTACT INFO:
Mike Nasi
mnasi@jw.com
512-736-9200
© Jackson Walker LLP JW.comYou can also read