Reanalysis for wind and solar electricity simulations: challenges and lessons learned in the Renewables.ninja project - 2018-07-17.key
←
→
Page content transcription
If your browser does not render page correctly, please read the page content below
Reanalysis for wind and solar
electricity simulations: challenges
and lessons learned in the
Renewables.ninja project

Stefan Pfenninger                            1st International Symposium on Regional Reanalysis
Dept of Environmental Systems Science                                                 17.7.2018
                                                                                Bonn, Germany
With Iain Staffell, Imperial College London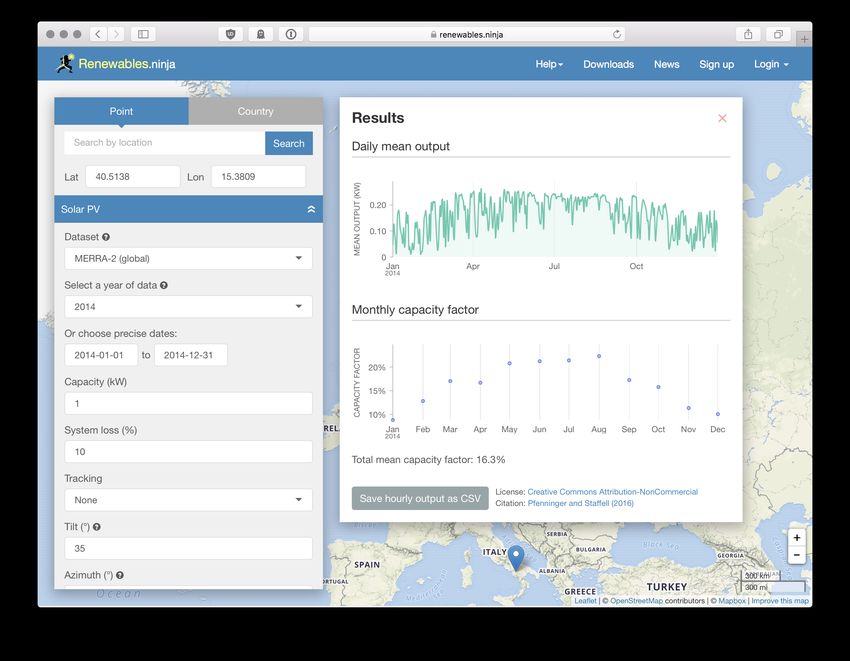
1.             2.           3.          4.
Why weather   How we use    Comparing    The ninja
  matters      reanalysis   reanalyses    project

                                                     2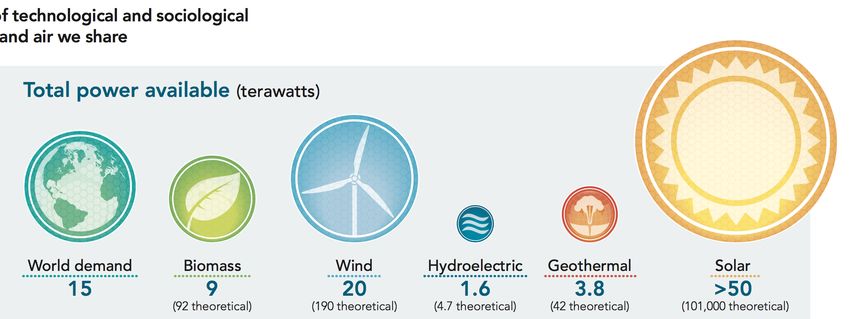
1.
Why weather
  matters

              3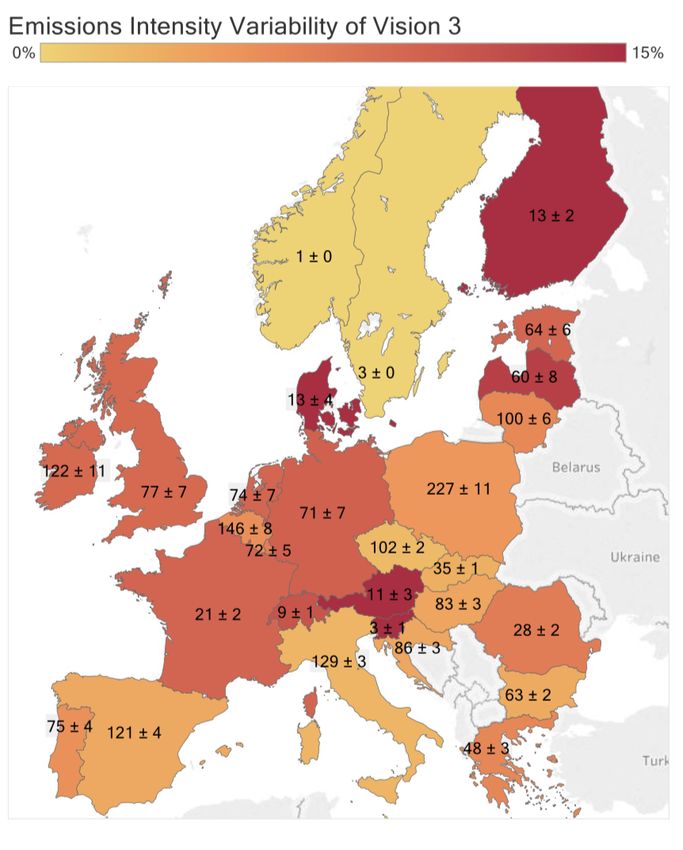
Goal: eliminate greenhouse gas
              emissions from the energy sector

Cho (2010). Science                              4
100 GW
                                                 Why variability is problematic
GW 8080
     GW
                                                                                         Electricity
   Power generation and consumption

                                        60
                                      60 GW
                                                                                         Demand
                                                                                                                                                                                     Conventional
                                                                                                                                                                                      (coal, gas)
                                        40
                                      40 GW
                                                      Germany, May 2014
                                                                                                                                                                                             PV
                                        20
                                      20 GW

                                                                                                                                                                                             Wind
                                          0 10. May
                                       0 GW
                                                        04:00   08:00    12:00   16:00    20:00   11. May      04:00   08:00     12:00       16:00    20:00    12. May      04:00    08:00    12:00       16:00        20:00
                                                                        10. May                                                11. May                                                  12. May
 Conventional power plants                                      Solar     Wind       Wind Offshore          Water      Biomass           Electricity Consumption         Hard coal      Lignite       Nuclear             Pumped hydro
 Natural gas                                    Other

                                                • Demand and generation must match second by second                                                                                                   Agora Energiewende; Current to: 16.07.2016, 19:10

                                                • Electricity is difficult to store
                                                • Demand is not very controllable
                                                • Power stations are not like light bulbs
                                                • Everything must be carefully coordinated and scheduled
https://www.agora-energiewende.de/en/topics/-agothem-/Produkt/produkt/76/Agorameter/                                                                                                                                                                 5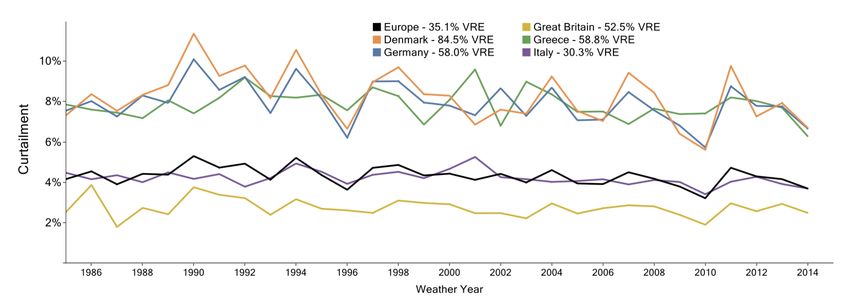
Power System                              Localised Long-term
                                                       Dispatch                                  Wind and Solar
                                                      Modelling                                 Resource Profiles

                                                                               Long-term
                                                                              Multi-scenario
                                                                                European
                                                                              Power System
                                                                                 Model

                                                                                                        x5
                                             70                                                       Five-fold
                                                                                                increase in variability
                    Total Generation Costs

                                             65                  Calm/Dull
                                                                                                  of CO2 emissions
                        (€bn per year)

                                             60                                                  and total generation
                                             55
                                                                Windy/Sunny
                                                                                                    costs by 2030
                                             50    Calm/Dull
                                                                                                    Power system
                                             45
                                                  Windy/Sunny                                    functions well with
                                             40                                                   high penetrations
                                                    2015          2030                              of renewables

Collins et al. (2018). Joule [press embargo until 11:00am EST 26 July 2018]                                               6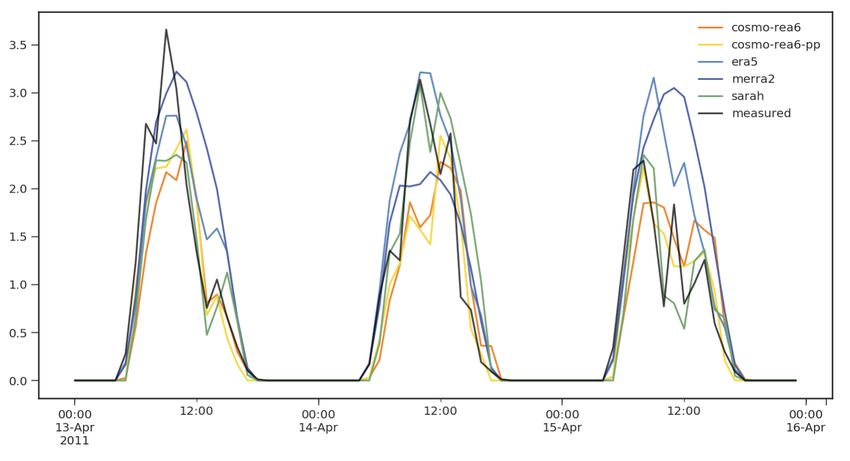
Variable weather = variable curtailment
     Curtailment in ENTSO-E vision 3
     (~35% of EU electricity from
     solar and wind)

Collins et al. (2018). Joule [press embargo until 11:00am EST 26 July 2018]   7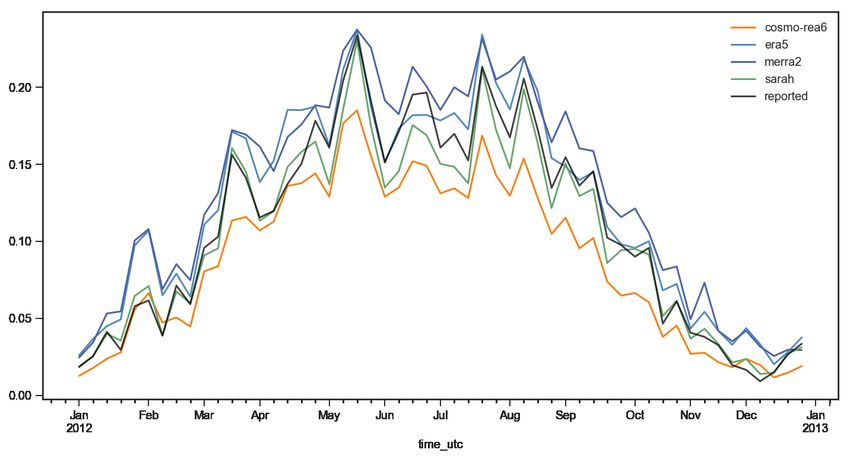
Variability of CO2 emissions will rise
                                                                              0%

                                                                                   Emissions intensity
                                                                                   variability in 2030
                                                                                   under ENTSO-E
                                                                                   vision 3 (30% VRE)

                                                                              15%

Collins et al. (2018). Joule [press embargo until 11:00am EST 26 July 2018]                              8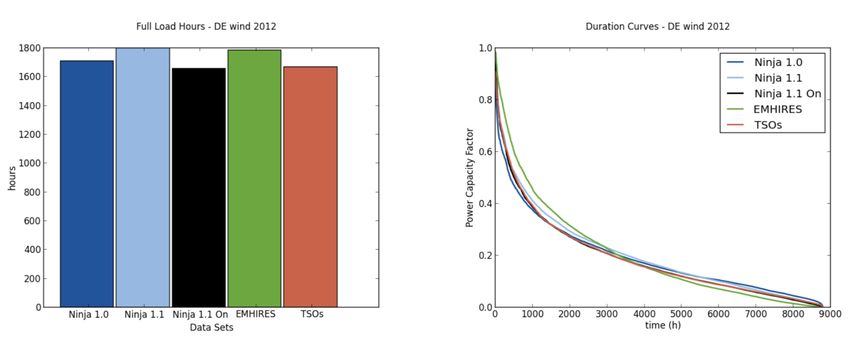
2.
How we use
 reanalysis

              9
Virtual Wind Farm Model
                                                                  25 m/s

                                                                  20          Take hourly
                                                                                                                                               Interpolate
                                                                           wind speeds
                                                                  15                                                                        from grid
                                                                           from a
                                                                                                                                            points to site
                                                                  10       reanalysis
                                                                                                                                            of actual wind
                                                                           (originally
                                                                  5                                                                         farms
                                                                           MERRA)
                                                                  0

                       100
                                                                                                      100%
     Height above ground (m)

                               80                                             Extrapolate                                                      Convert
                                        NASA data                                                         80%
                                                                           wind speeds                                                      from wind
                                                                                            Load factor
                               60       Log wind profile
                                                                                                          60%
                                                                           to hub height                                                    speed to
                                        Extrapolated speed
                               40       at hub height                      with place-                    40%                               power output
                                                                           and time-                      20%
                                                                                                                           Farm             using whole-
                               20
                                                                                                                           Turbine
                                                                           specific                                                         farm power
                                                                                                          0%
                               0                                           parameters                           0    10         20     30   curve
                                    0   2    4    6     8    10   12
                                                                                                                    Wind speed (m/s)
                                            Wind speed (m/s)

Staffell and Pfenninger (2016)                                                                                                                               10
Bias correction: not optional
Average wind capacity factors in Europe
Original model
Actual data
(uncorrected MERRA-1)
Bias
correction
Staffell and Pfenninger (2016) 11Bias correction using electric generation data
Hourly weather conditions Bias-correct
(wind speeds, sunlight, …)
Solar and wind electricity Measured electricity
simulation models generation data
Hourly estimates of
solar/wind power generation Validate
Pfenninger and Staffell (2016), Staffell and Pfenninger (2016) 12Bias-corrected wind simulations
Simulating the UK wind fleet with the MERRA reanalysis:
R² = 0.95
6
British Fleet Output (GW)
5
Actual Simulated
4
3
2
1
0
Jul-13 Aug-13 Sep-13 Oct-13 Nov-13 Dec-13 Jan-14
Staffell and Pfenninger (2016); actual data from Elexon & National Grid 1325 years of daily variability
Simulated UK wind and PV fleets, 1991-2015
143.
Comparing
reanalyses
(solar PV only,
for now)
Image source: http://xarray.pydata.org/ 15lower resolution
Reanalysis and satellite datasets more coverage
higher resolution
less coverage
Urraca et al., 2018: “We conclude that ERA5 and
COSMO-REA6 have reduced the gap between
reanalysis and satellite-based data” (for solar
irradiance data)
Urraca et al. (2018). Solar Energy
Pfenninger and Staffell. Work in progress. 16Germany: PV capacity factors (2012)
7-day mean capacity factor
Pfenninger and Staffell. Work in progress. 17Single PV system:
SARAH best, COSMO-REA6 not bad
Pfenninger and Staffell. Work in progress.
Post-processed COSMO-REA6 data from Frank et al. (2018). Solar Energy 184.
The ninja
project
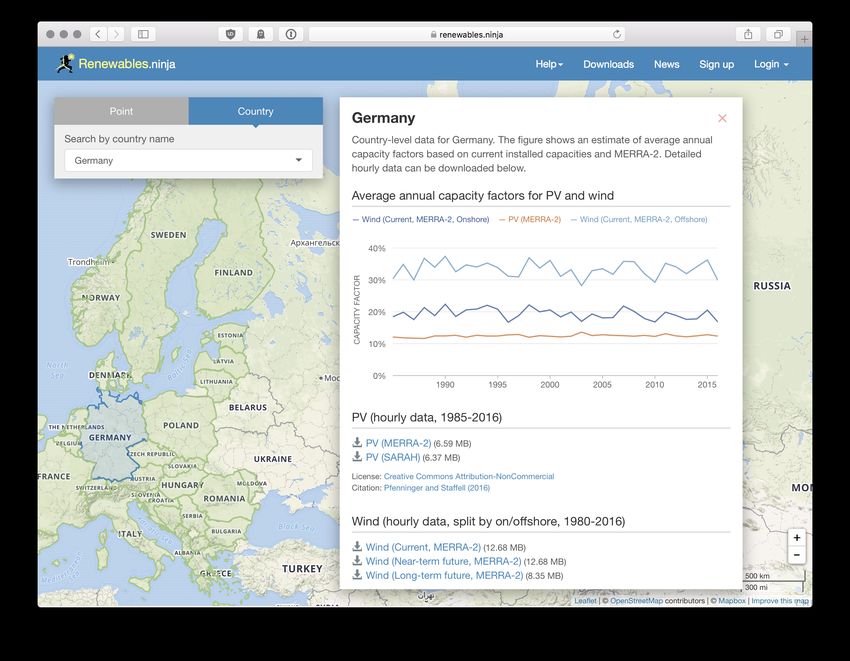
19www.renewables.ninja
Goal: provide easy access to
validated wind and PV
simulations worldwide.
>1500 users from >250
institutions in 65 countries.
Pfenninger and Staffell (2016). Energy; Staffell and Pfenninger (2016). Energy 20renewables.ninja
21renewables.ninja
22External validation — National level
PV
Wind
Moraes et al. (2018). Applied Energy 23External validation — NUTS-2 level Moraes et al. (2018). Applied Energy 24
External validation

         “The lack of a trust-worthy source of data for
         comparison makes the evaluation of data quality
         challenging in many countries.”

         “[…] the chain of methods used to convert wind
         speeds and solar radiation into power outputs
         are decisive in this process, and the use of
         reanalysis data is promising”

Moraes et al. (2018). Applied Energy                       25
Renewables.ninja:
Upcoming improvements
• NUTS-2 level data for Europe should be online
by end of this week
• Global country and sub-country level data (e.g.
U.S. states, Chinese provinces) later this year
• New generation of reanalyses and better bias
correction
261. 2. 3. 4.
Why weather How we use Comparing The ninja
matters reanalysis reanalyses project
Discussion
• What is ground truth? Reference energy datasets →
better reanalysis validation and bias correction.
• Which reanalyses have which strengths? Or, how to
choose the right reanalysis for a particular task?
• What improvements for energy applications are
easily possible within existing / next-gen reanalyses?
stefan.pfenninger@usys.ethz.ch | www.renewables.ninja | www.callio.pe
Own publications available on www.pfenninger.org/publications
27You can also read