Analysis of the passenger car market in various EU Member States

Page created by Judy Reynolds
 
CONTINUE READING
Analysis of the passenger car market in various EU Member States
Analysis of the passenger car
     market in various
     EU Member States
                                             FuelsEurope workshop
                                          “Ensuring social inclusiveness”
                                                  11 June 2021
 The information presented in these slides is provisional, may
 contain errors or inaccuracies and is subject to change. Any
 opinions expressed are those of the author only, and do not
 represent the views of The European Petroleum Refiners
 Association AISBL ( “FuelsEurope”) or its member companies.
                                                                        Loes Knotter
 FuelsEurope does not guarantee the accuracy or reliability of the
 information provided herein. The content of the information            Loes.knotter@studiogearup.com
 provided is for your general information and use only.
 FuelsEurope does not accept any liability for any loss caused by
 the understanding and/or use of these slides or its content. These     +31-6-48889363
 slides should not be copied or otherwise distributed, in whole or in
 part, to any other person.                                             www.studiogearup.com
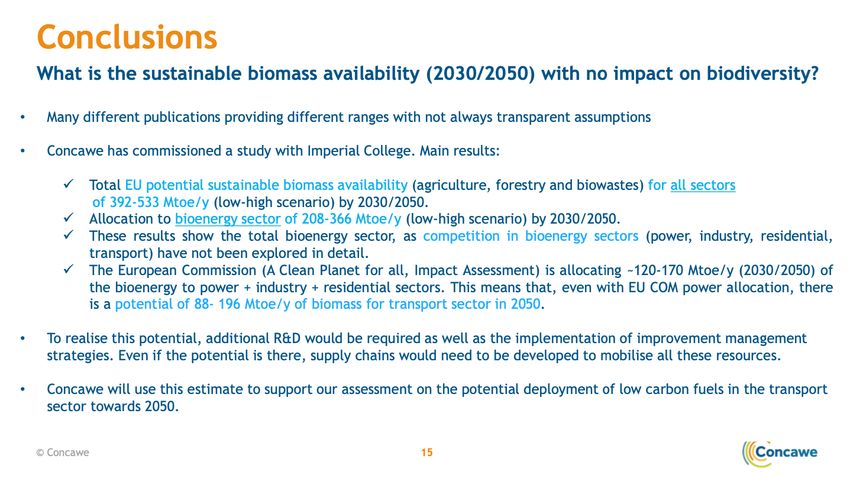
Analysis of the passenger car market in various EU Member States
2

In the total energy consumption of all transport segments the road segment has by far the
largest share in Europe
                                               300

                                               250
 Energuy consumption in EU27, 2019 (In Mtoe)

                                                                                                                         Approx. 50% is passenger (light
                                               200                                                                       duty) transport

                                               150

                                               100

                                                                                                                         Approx. 50% is medium/heavy
                                                                                                                         duty transport
                                                50

                                                 0
                                                     International maritime   International aviation     Rail   Road   Domestic navigation       Domestic aviation   Pipeline transport   Not elsewhere specified
                                                            bunkers

                                                     Source: Eurostat, (Complete Energy Balance, 2021)
Reference to Panoutsou’s presentation on 8th June on biomass availability for transport

                                                   Assuming a 50% conversion factor to final
                                                     biofuel, this waste and residue base
                                                      represents approx. 45 – 100 Mtoe
                                                        equivalent amount of biofuels
4

In the total energy consumption of all transport segments the road segment has by far the
largest share in Europe
                                               300

                                               250
                                                                                                                  45 Mtoe
 Energuy consumption in EU27, 2019 (In Mtoe)

                                                                                                                              Approx. 50% is passenger (light
                                               200                                                                            duty) transport
                                                                                                                100 Mtoe

                                               150

                                               100

                                                                                                                              Approx. 50% is medium/heavy
                                                                                                                              duty transport
                                                50

                                                 0
                                                     International maritime   International aviation     Rail    Road       Domestic navigation       Domestic aviation   Pipeline transport   Not elsewhere specified
                                                            bunkers

                                                     Source: Eurostat, (Complete Energy Balance, 2021)
5

Contribution of European measures to lower TTW emissions in transport by 2030 largely rely
on efficiency improvements and renewable fuels
                                                              Projections of EU-27 passenger car fleet by power train                                                                            Impact of EU road transport measures on TTW emissions
                                              300                                                                                                                                 1.000
 Millions

                                                                     ICEVs
                                                                     PHEVs
                                                                                                                                                                                   900
                                                                     BEVs

                                              250
                                                                                                                                                                                   800

                                                                                                                                Road transport TTW emissions in EU-27 [MtCO₂/a]
 Total passenger car registrations in EU-27

                                                                                                                                                                                   700
                                              200

                                                                                                                                                                                   600

                                              150                                                                                                                                  500

                                                                                                                                                                                   400

                                              100
                                                                                                                                                                                   300

                                                                                                                                                                                   200
                                               50

                                                                                                                                                                                   100

                                                0                                                                                                                                    0
                                                    1990

                                                           1995

                                                                     2000

                                                                              2005

                                                                                       2010

                                                                                                2015

                                                                                                         2020

                                                                                                                  2025

                                                                                                                         2030

                                                                                                                                                                                          1990

                                                                                                                                                                                                   1995

                                                                                                                                                                                                            2000

                                                                                                                                                                                                                     2005

                                                                                                                                                                                                                               2010

                                                                                                                                                                                                                                        2015

                                                                                                                                                                                                                                                 2020

                                                                                                                                                                                                                                                         2025

                                                                                                                                                                                                                                                                2030
New passenger car registrations: Case Germany
     100,0%
                                                                                                                               92,8%

     90,0%

     80,0%

     70,0%

     60,0%

     50,0%

     40,0%

     30,0%

     20,0%

     10,0%                                                                                                                             6,7%

                                                                                                                                              0,6%
      0,0%
                                   2017                                            2018                                 2019           2020

                                                                                             ICEVs        BEVs   APVs

              Source: ACEA (2018-2021): Statistics - Alternative fuel vehicle registrations
              APV = includes natural gas vehicles (NGV), LPG-fueled vehicles and ethanol (E85) vehicles
Second hand market: case Germany. EVs in the used car segment essential
for the accelerated uptake of EVs in the market.
     100,0%                                                                                                         98,8%

      90,0%

      80,0%

      70,0%

      60,0%

      50,0%

      40,0%

      30,0%

      20,0%

      10,0%

                                                                                                                     0,3%          0,9%
      0,0%
                        2015                     2016                     2017                     2018      2019           2020
                                                                           ICEVs   BEVs    APVs

              Source: KBA (2015-2020), Besitzumschreibungen von Kraftfahrzeugen und Kraftfahrzeuganhängern
              APV = includes natural gas vehicles (NGV), LPG-fueled vehicles and ethanol (E85) vehicles
France | Average budgets of various income groups for new car purchase
(sales prices June 2021) (5 income groups: Q1: 20% lowest income to Q5: 20% highest income group)

      Q5

                                                                                        Renault Zoe        Volkswagen ID.3          Tesla Model 3
                                                                                          (BEV)                 (BEV)                   (BEV)

      Q4

      Q3

                                                   Volkswagen Polo
                                                        (ICEV)

      Q2

                                    Renault Clio
                                      (ICEV)

      Q1

           0    5.000       10.000          15.000           20.000          25.000          30.000          35.000          40.000           45.000   50.000
                        Available budget for new car purchase on basis of Eurostat household income data and the share of mobility expenses
Germany | Average budgets of various income groups for new car purchase
(sales prices June 2021) (5 income groups: Q1: 20% lowest income to Q5: 20% highest income group)

      Q5

                                                                                   Renault Zoe        Volkswagen ID.3                          Tesla Model 3
                                                                                     (BEV)                 (BEV)                                   (BEV)

      Q4

                                                Volkswagen Polo
                                                     (ICEV)

      Q3

                                     Renault Clio
                                       (ICEV)

      Q2

      Q1

           0    5.000       10.000          15.000           20.000          25.000          30.000          35.000          40.000           45.000       50.000
                        Available budget for new car purchase on basis of Eurostat household income data and the share of mobility expenses
Hungary | Average budgets of various income groups for new car purchase
(sales prices June 2021) (5 income groups: Q1: 20% lowest income to Q5: 20% highest income group)

      Q5

                              Renault Clio Volkswagen Polo                         Renault Zoe         Volkswagen ID.3         Tesla Model 3
                                (ICEV)          (ICEV)                               (BEV)                  (BEV)                  (BEV)

      Q4

      Q3

      Q2

      Q1

           0    5.000       10.000          15.000           20.000          25.000          30.000          35.000          40.000           45.000   50.000
                        Available budget for new car purchase on basis of Eurostat household income data and the share of mobility expenses
Case for Hungary: Average budgets of various income groups for new car purchase
(sales prices June 2021) (5 income groups: Q1: 20% lowest income to Q5: 20% highest income group)

      Q5

      Q4

      Q3

      Q2

      Q1

           0      1.000            2.000                3.000               4.000               5.000               6.000                   7.000   8.000
                      Available budget for new car purchase on basis of Eurostat household income data and the share of mobility expenses
Comparing total cost of ownership – for the 1st 5 years – in a West-European country
Example of a VW model : Golf lower in cost than ID.3
                                                                            ICEV: VW Golf                                           BEV: VW ID.3
                                                € 30.000

                                                                                                                                      € 26,287
                                                € 25.000                      € 24,319

                                                € 20.000

                                                                                                                                                                 € 17,313

                                                € 15.000

                                                € 10.000

                                                 € 5.000

                                                      €0

                                                 -€ 5.000
     Assumptions:
     • Vehicles purchase costs based on
        June 2021 prices
     • Total cost of ownership calculated for
        a 5 years period                        -€ 10.000
     • Based on annual distance driven of                   Depreciation           Vehicle VAT                Purchase subsidy (government)   Manufacturer subsidy
        12,000 km/a                                         Taxes                  Maintenance                Maintenance VAT                 Insurance
     • Charging: at home
                                                            Insurance VAT          Energy costs excl. taxes   Energy excise taxes             Energy VAT
Comparing total cost of ownership – for the 1st 5 years – in a Central-European country
Example of Renault: Zoe 1,5 times more expensive than its ICEV-equivalent Clio
                                                                            ICEV: Renault Clio                                   BEV: Renault Zoe
                                                € 30.000

                                                                                                                                        € 25,078
                                                € 25.000

                                                € 20.000

                                                                                € 16,784

                                                € 15.000

                                                € 10.000

                                                 € 5.000

                                                      €0

                                                 -€ 5.000
     Assumptions:
     • Vehicles purchase costs based on
        June 2021 prices
     • Total cost of ownership calcualted for
        a 5 years period                        -€ 10.000
     • Based on annual distance driven of                   Depreciation              Vehicle VAT                Purchase subsidy (government)   Manufacturer subsidy
        12,000 km/a                                         Taxes                     Maintenance                Maintenance VAT                 Insurance
     • Charging: at home
                                                            Insurance VAT             Energy costs excl. taxes   Energy excise taxes             Energy VAT
In reflection
     • A substantial amount of public funding is spent on stimulating consumers to buy an
       electric vehicle.
     • In our analysis we see amounts of €6000,- over a 5 years period of time. This would
       equal a fuel subsidy of approx. €1,5 a liter (gasoline).
     • Just imagine this budget is used to cover the extra costs to shift to the use of 100% low
       carbon fuels.
     • (For instance, in the Netherlands we know the extra costs for renewable fuels are in
       the range of 0,50 cent a liter)
     • Such an amount of subsidy would cover for the extra costs of 100% renewable fuels
       for 15 years (on basis of 12.000 km a year)
     • With the same amount of support a significant climate reduction can be realised.
     • It is not that we should spend this money in this way, but it makes clear we have more
       options for green mobility.
     • Equal treatment of options from the perspecive of climate reductions could mean to
       have any car driver on board in the sustainable mobility transition
You can also read