North American Commission - NAC(19)07 Presentation of the ICES Advice to the North American Commission - NASCO
←
→
Page content transcription
If your browser does not render page correctly, please read the page content below
North American Commission

          NAC(19)07

 Presentation of the ICES Advice
to the North American Commission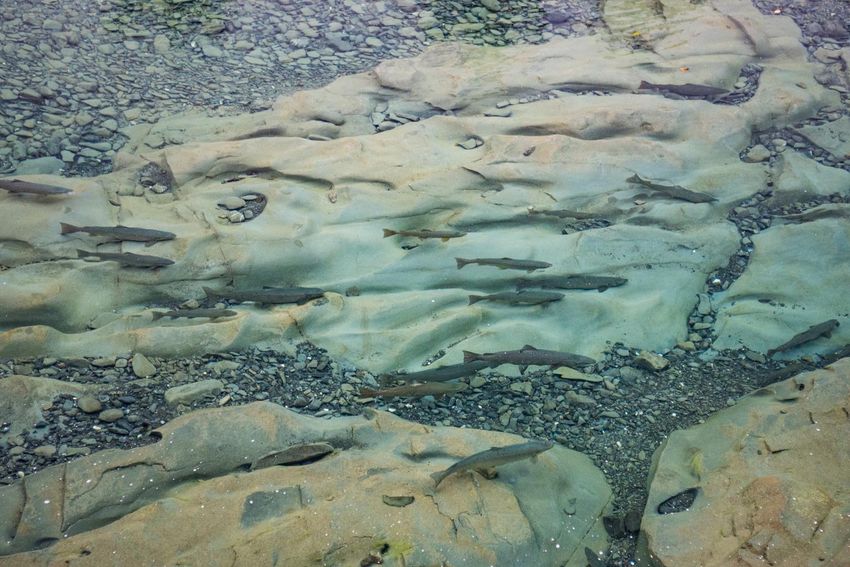
sal.nac.all
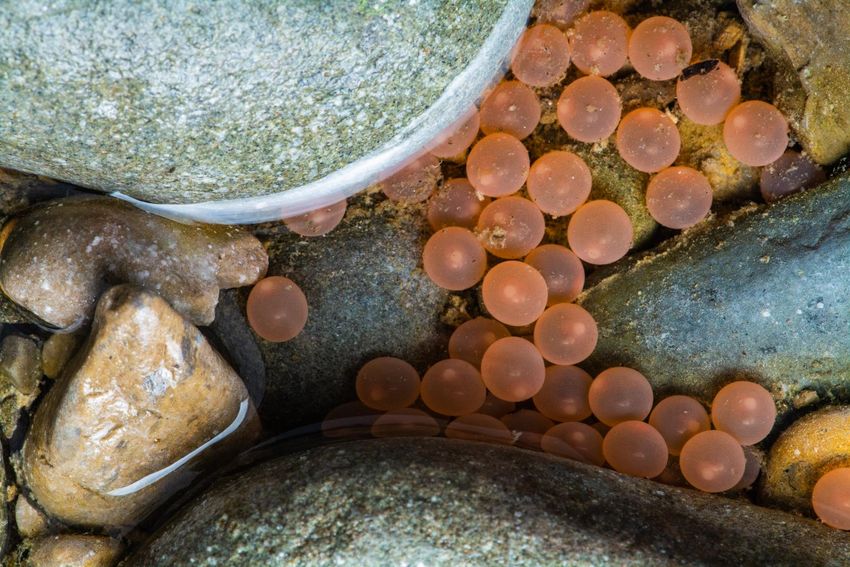
Atlantic salmon from North America
Photo by Nick Hawkins 1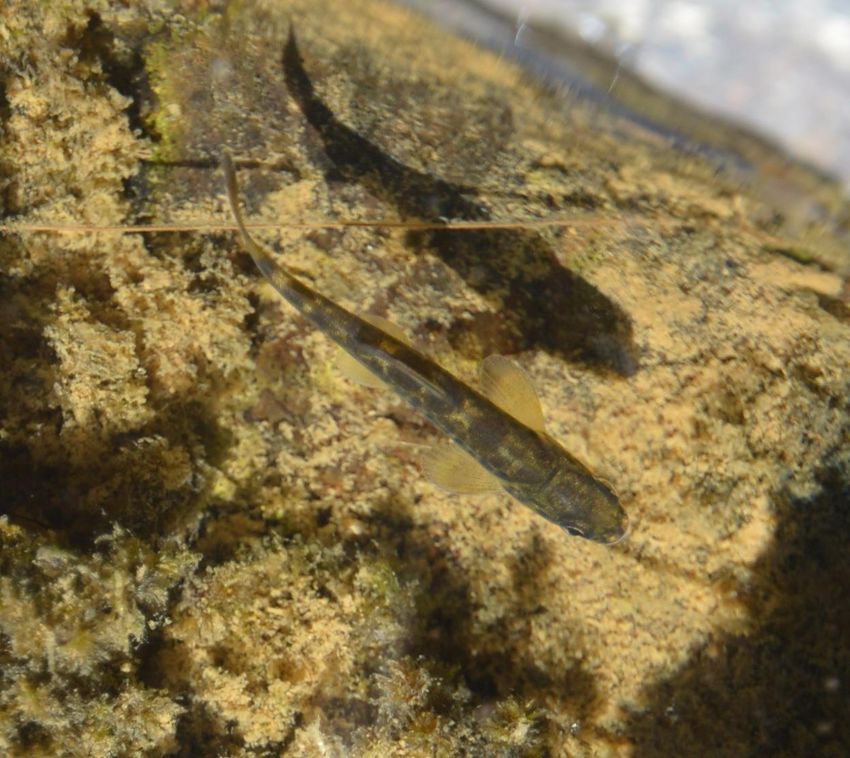
Terms of Reference

3. With respect to Atlantic salmon in the North American Commission area:

3.1   describe the key events of the 2018 fisheries (including the fishery at St Pierre and Miquelon);
3.2   update age-specific stock conservation limits based on new information as available, including
      updating the time-series of the number of river stocks with established CLs by jurisdiction;
3.3   describe the status of the stocks, including updating the time-series of trends in the number
      of river stocks meeting CLs by jurisdiction;
       The NASCO Framework of Indicators was applied in 2019 and there was no indication of
       underestimated abundance forecasts. Therefore, a full reassessment was not required
       and the 2018 ICES catch advice remains valid. Consequently, there are no mixed-stock
       fishery options on 1SW non maturing and 2SW salmon components from North
       American stocks in the period 2019 to 2021.

                                                 2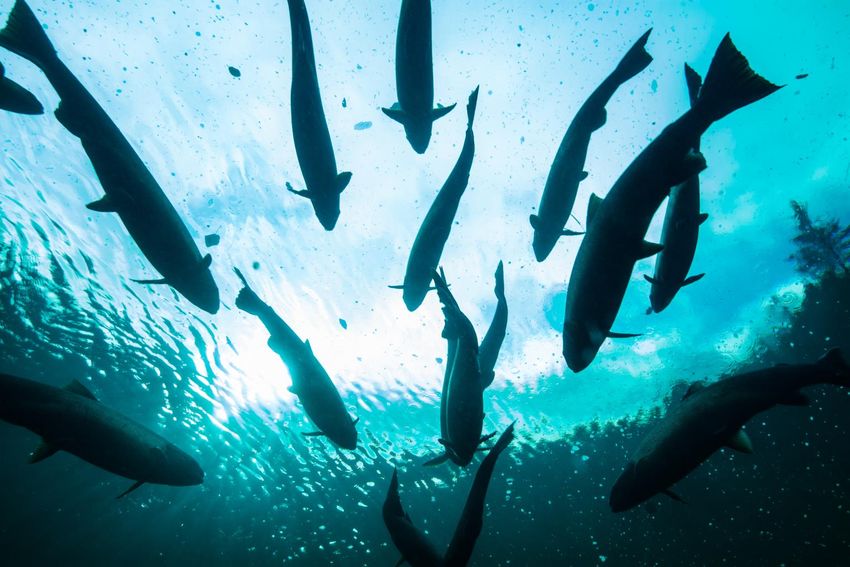
3.1 Key Events 2018 Fisheries: Catch

Table 1: sal.nac.all
                                             Canada                                St Pierre &
                                                                                                             North
       2018                         Indigenous   Labrador
                                                                                   Miquelon       USA
                                                                                                            America
                       Commercial                           Recreational   Total      (SPM)
                                       (FSC)     Resident

 Reported catch               0t          53 t        2t           35 t     90 t             1t     0t          91 t
 % of NAC total                 -         59%         2%            38%      99%             1%         -        100

 Unreported catch                                                           24 t             na     0t          24 t
 Location of catches
 % in-river                                                                  41%                                40%
 % in estuaries                                                              51%                                51%
 % coastal                                                                    8%          100%                   9%

                                                            3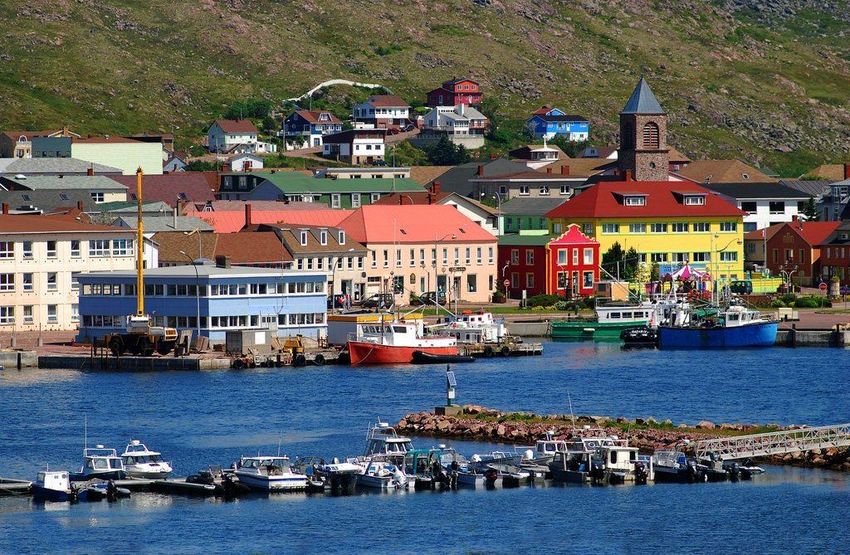
3.1 Key Events 2018 Fisheries: Canada
 • Total Harvest (t) Canada 1960-2018                               • Exploitation Rates 1971-2018
     • 89.5 t: 27,765 small (49.7 t) and 8,420 large (39.8 t)           • lowest in time-series
     • lowest in time-series
     Figure 1: sal.nac.all                                            Figure 3: sal.nac.all

• Recreational Fisheries (34.7 t)
    • Recreational Harvest:    18,587 salmon
    • Catch and Release:       50,184 (73% Recreational Catch)

                                                                4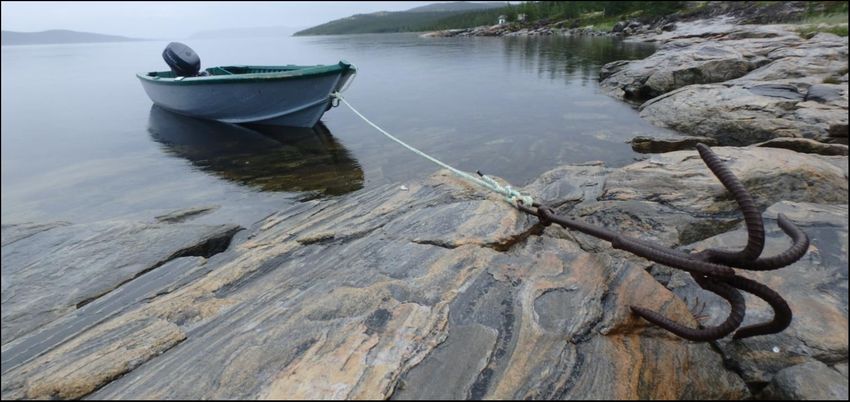
3.1 Key Events 2018 Fisheries: Saint Pierre & Miquelon

• 2018 reported catch of 1.3 t
• catches declining since 2016
            • 76% lower than previous 5 year mean of 4 t
            6

            5
Catch (t)

            4

            3

            2

            1

            0
                1990   1995   2000   2005   2010   2015   2020

                                                                 5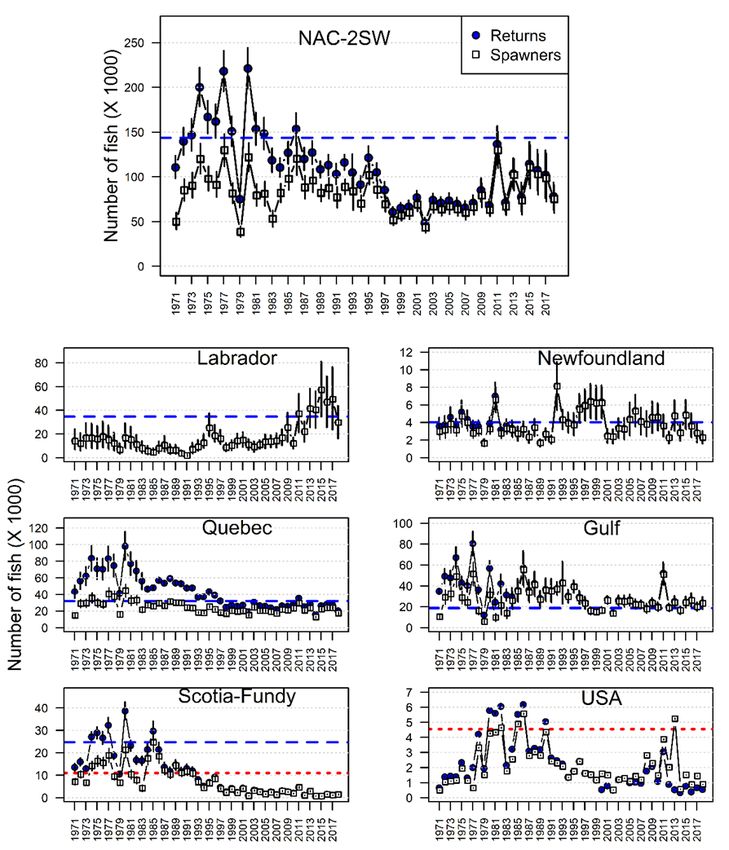
3.1 Origin and Composition of Catches
      Figure 4: sal.nac.all

                       • SNP Genetic Baseline
                              • 31 Reporting groups
                                 • 21 North America

                                 • 10 European

                                                  6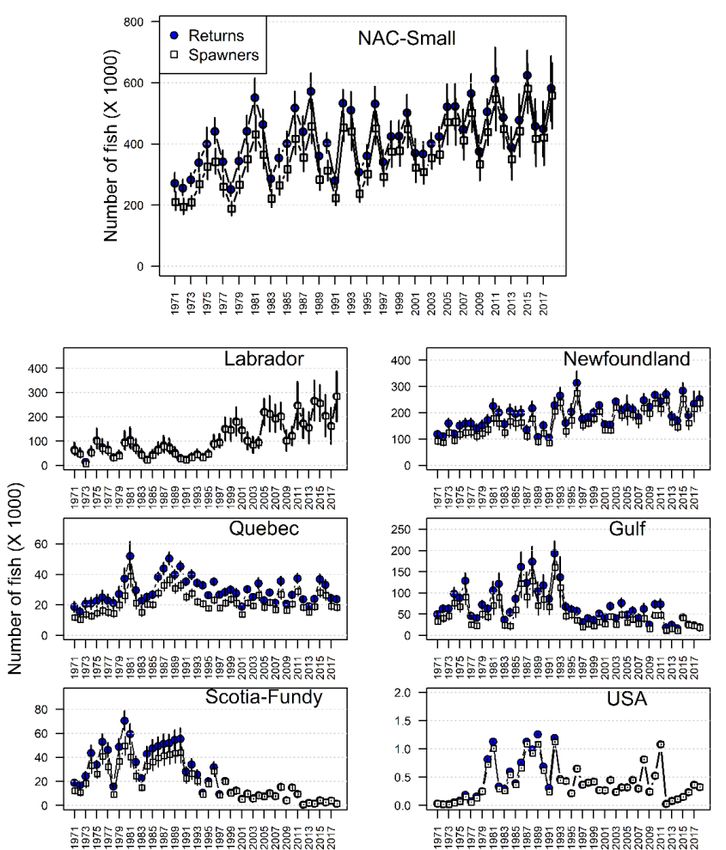
3.1 Origin and Composition of Catches: Labrador

Figure 5: sal.nac.all

                        2018:
                           • 799 scale and tissue samples collected
                           • 6% of harvest

                        2017 and 2018:
                           • 994 samples analysed for genetic region of origin
                           • > 98.0% assigned to Labrador reporting group (LAB)
                           • 2 assigned to USA in 2017, 0 USA in 2018

                                                        7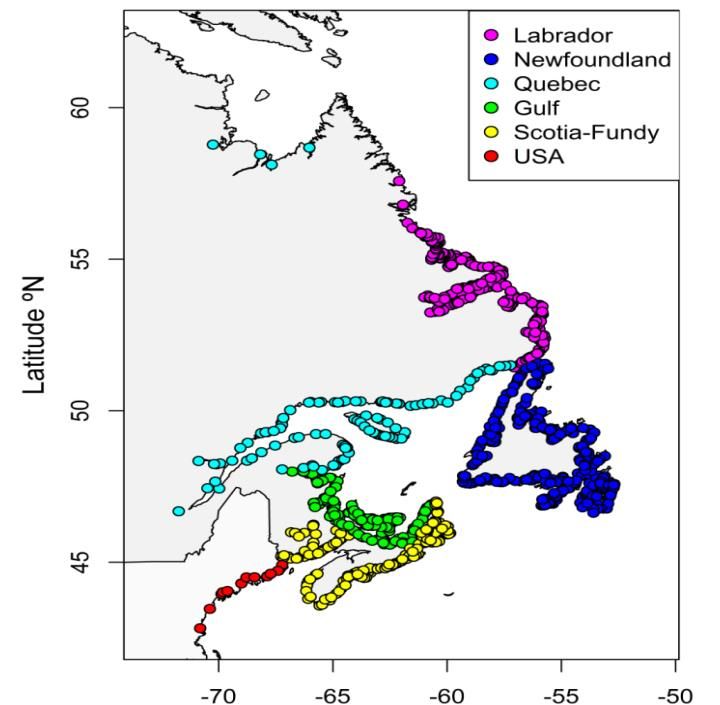
3.1 Origin and Composition of Catches:
Saint Pierre and Miquelon
                                                     Figure 6: sal.nac.all
2017 to 2018:
• 193 scale and tissue samples
•   12% (2017) and 9% (2018) of harvest
•   83-89% assigned to 3 reporting groups
     • Southern Gulf of St. Lawrence (GUL)
     • Gaspe Peninsula (GAS)
     • Newfoundland (NFL) - > 60%
•   Samples mostly small salmon (< 63 cm)
•   Not fully representative of total catch
    •   Harvest – 77% small
    •   Samples – 93% small

                             Figure 6: sal.nac.all

                                                         8
3.2 Stock Conservation Limits (CLs)
Figure 8: sal.nac.all
498
33
16
70
0
38
Photo by Nick Hawkins
93.3 Status of Stocks
• Six regions and overall for North America
• Size groups:
• small (1SW)
• large (MSW and repeat spawners)
• 2SW salmon (a subset of large)
Figure 2: sal.nac.all
103.3 Returns of Small Salmon
• Includes homewater fisheries catch, except in
Newfoundland and Labrador
• 581,900 returns of small salmon (1SW)
• 29% higher than 2017
• 3rd highest in 48 year time series
• four of six geographical regions declined from 2017
• 92% of small salmon return to Newfoundland and
Labrador rivers
Figure 9: sal.nac.all
113.3 Returns Large Salmon
(MSW and Repeats)
• 131,800 large salmon
• 24% lower than 2017
• four of six geographical regions declined from 2017
• 81% of large salmon return to rivers in Labrador,
Quebec and Gulf
Figure 10: sal.nac.all
123.3 2SW Returns
78,100 2SW salmon
• 23% lower than 2017
• four of six geographical regions declined from 2017
• among lowest on record with the exception of Labrador
• 81% of 2SW salmon return to rivers in Labrador, Quebec and Gulf
Figure 11: sal.nac.all
133.3 Status of Stocks: Reference Points
Risk Assessment Framework
• Full Reproductive Capacity :
• lower bound of the 90% confidence interval of the estimate above reference point
• equivalent to a probability of at least 95% of meeting reference point
• At Risk of Suffering Reduced Reproductive Capacity:
• lower bound of the confidence interval is below reference point, but the midpoint is above
• Suffering Reduced Reproductive Capacity:
• midpoint is below reference point
14Figure 12: sal.nac.all
3.3 Status of Stocks: By Region
• 2018: 2SW median estimates of returns to
rivers and spawners were below CLs
(suffering reduced reproductive capacity)
for five of the six assessment regions
• Particularly large deficits relative to CLs
and rebuilding/management objectives
are noted for Scotia-Fundy (13%) and USA
regions (12% and 19%)
Full reproductive Risk suffering reduced Suffering reduced
capacity reproductive capacity reproductive capacity
153.3 Degree of CL Attainment
• Proportion CL Attained = egg deposition / CL
• 38 of 86 (44%) achieved or exceeded CLs
• 28 of 86 (33%) were at, or less, than 50% CL
• Canada
• 1991-2018 CL time-series
• Number of rivers assessed ranged from 61 to 91
• percentage rivers achieving CL ranged from 26% to 67%
• USA
• None of the assessed rivers have achieved CLs
Figure 14: sal.nac.all
163.3 Pre-Fishery Abundance (PFA)
• Number of salmon at sea prior to all marine fisheries
(1 August second summer at sea) Figure 12: sal.nac.all
• Two components:
• 1SW maturing (return as 1SW)
• 1SW non-maturing (return as MSW)
• 2017 PFA year was 592 700 fish
• abundance declined 65% over the time-series from a
peak of 1 705 000 fish in 1975
• PFA estimates suggest continued low abundance of
salmon (suffering reduced reproductive capacity)
173.3 Status of Stocks: Summary • Despite major management changes and increasingly more restrictive fisheries, returns have remained near historical lows, except for returns to Labrador and Newfoundland • All salmon populations within the USA and the Scotia-Fundy regions have been or are being considered for listing under country specific species at risk legislation • Factors acting on survival in the first and second years at sea at both local and broad ocean scales are constraining abundance of salmon • Smolt production declines in some eastern Canadian rivers may also be contributing to lower adult abundance Photo by Nick Hawkins 18
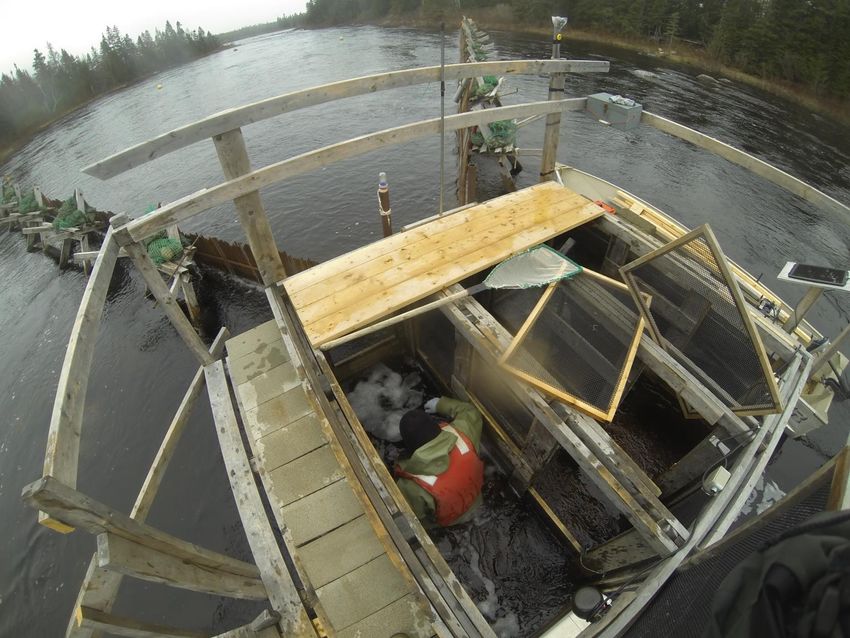
Relevant data deficiencies, monitoring needs, and research requirements
• Complete and timely reporting of catch statistics from all fisheries and all areas of eastern Canada

• Improved catch statistics and sampling of the Labrador and Saint Pierre and Miquelon fisheries to ensure samples are
  representative of the entire catch

• Additional monitoring be considered in Labrador to estimate stock status for that region. Additionally, efforts should be
  undertaken to evaluate the utility of other available data sources (e.g. Indigenous and recreational catches and effort) to
  describe stock status in Labrador                            19
20
You can also read