Commonwealth of Massachusetts Tropical Cyclone Profile - August, 2020 - Mass.gov
←
→
Page content transcription
If your browser does not render page correctly, please read the page content below
Commonwealth of Massachusetts Tropical
Cyclone Profile
August, 2020
Commonwealth of Massachusetts Tropical Cyclone Profile
Description
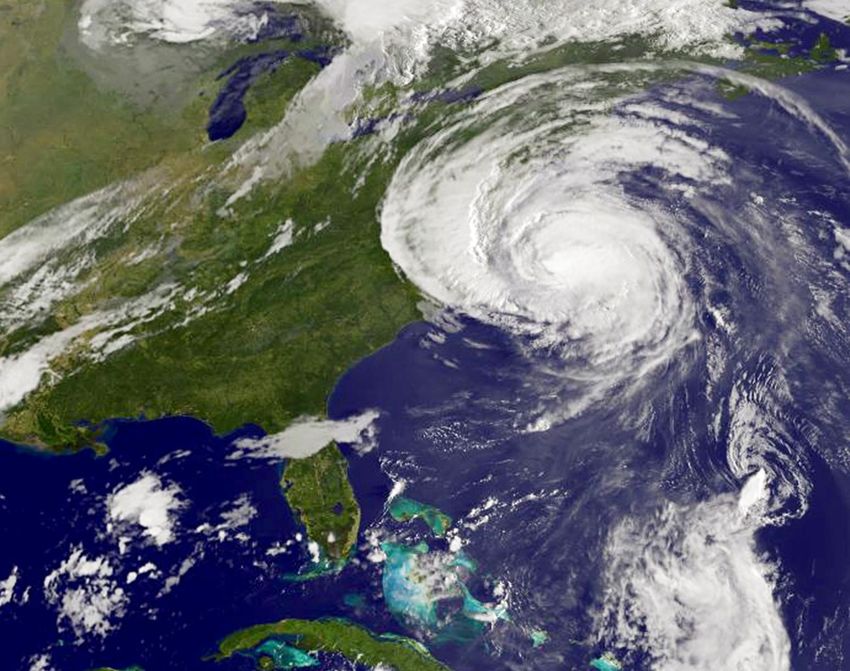
Tropical cyclones, a general term for tropical storms and hurricanes, are low pressure systems that usually
form over the tropics. These storms are referred to as “cyclones” due to their rotation. Tropical cyclones
are among the most powerful and destructive meteorological systems on earth. Their destructive
phenomena include high winds, heavy rain, lightning, tornadoes, and storm surge. As tropical storms
move inland, they can cause severe flooding, downed trees and power lines, and structural damage. Once
a tropical cyclone no longer has tropical characteristics, it is then classified as a post tropical system.
The National Hurricane Center (NHC) has classified four types of tropical cyclones:
• Tropical Depression: A tropical cyclone with maximum sustained winds of 38 mph (33 knots) or
less.
• Tropical Storm: A tropical cyclone with maximum sustained winds of 39 to 73 mph (34 to 63
knots).
• Hurricane: A tropical cyclone with maximum sustained winds of 74 mph (64 knots) or higher.
• Major Hurricane: A tropical cyclone with maximum sustained winds of 111 mph (96 knots) or
higher, corresponding to a Category 3, 4 or 5 on the Saffir-Simpson Hurricane Wind Scale.
Most Atlantic tropical cyclones begin as atmospheric easterly waves that propagate off the coast of Africa
and cross the tropical North Atlantic Ocean and Caribbean Sea. When a storm starts to move toward the
north, it begins to leave the area where the easterly trade winds prevail, and enters the temperate
latitudes where the westerly winds dominate. This produces the eastward curving pattern of most tropical
storms that pass through the Mid-Atlantic region. When the westerly steering winds are strong, it is easier
to predict where a hurricane will go. When the steering winds become weak, the storm follows an erratic
path that makes forecasting very difficult.
Primary Hazards
Storm Surge and Storm Tide
Storm surge is an abnormal rise of water generated by a storm, over and above the predicted
astronomical tide. Storm surge and large waves produced by hurricanes pose the greatest threat to life
and property along the coast, as well as posing a significant risk for drowning.
Storm tide is the water level rise during a storm due to the combination of storm surge and the
astronomical tide. This rise in water level can cause extreme flooding in coastal areas particularly when
storm surge coincides with normal high tide, resulting in storm tides reaching up to 20 feet or more in
some cases.
Coastal areas, including areas away from the immediate shoreline, are vulnerable to storm surge. The
destructive power of storm surge and large battering waves can result in loss of life, destruction of
homes and other buildings, beach erosion, and road damage along the coast.
1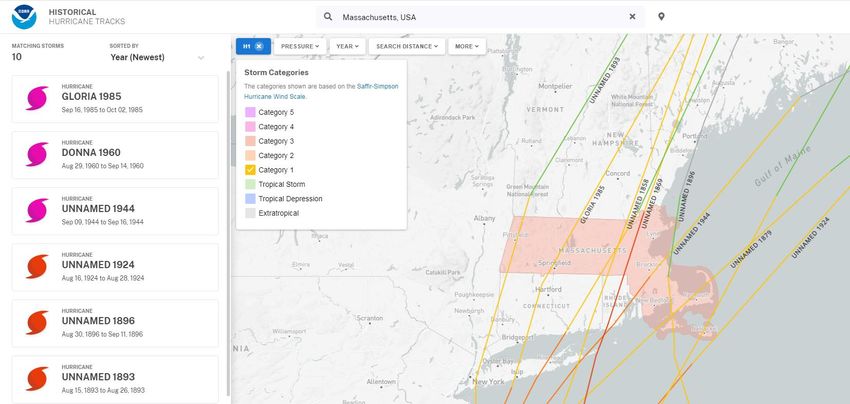
The National Weather Service (NWS), in coordination with the National Hurricane Center (NHC), issues a
storm surge watch when there is a possibility of life-threatening inundation, from rising water moving
inland from the coastline, in the watch area during the next 48 hours. NWS/NHC issues a storm surge
warning when there is a danger of life-threatening inundation, from rising water moving inland from the
coastline, during the next 36 hours in the warning area.

Heavy Rainfall and Inland Flooding
Tropical storms and hurricanes often produce widespread, torrential rains in excess of 6 inches, which
may result in deadly and destructive floods.

Flash flooding (defined as a rapid rise in water levels) and urban (street) flooding can occur quickly due
to intense rainfall.

Rainfall amounts are not directly related to the strength of tropical cyclones but rather to the speed and
size of the storm, as well as the geography of the area. Slower moving and larger storms produce more
rainfall. Generally, the heaviest rain will occur to the north and west of a hurricane or tropical storm
track.

Rip Currents
The strong winds of a tropical cyclone can cause dangerous waves that pose a significant hazard to
mariners and coastal residents and visitors. When the waves break along the coast, they can produce
deadly rip currents - even at large distances from the storm.

Rip currents are channeled currents of water flowing away from shore, usually extending past the line of
breaking waves.

The south coast of Massachusetts is particularly vulnerable to this hazard due to the depth of coastal
waters south of New England.

Tornadoes
Hurricanes and tropical storms can produce tornadoes. These tornadoes most often occur in
thunderstorms embedded in rain bands well away from the center of the hurricane; however, they can
also occur near the eyewall. Usually, tornadoes produced by tropical cyclones are relatively weak and
short-lived, but they still pose a significant threat.

High Winds
Hurricanes are categorized according to the Saffir-Simpson Hurricane Wind Scale (SSHWS) as outlined in
Table 1 below. The scale categorizes a tropical cyclone base on wind speed and barometric pressure
measurements. Hurricane categories range from one (1) through five (5), with Category 5 being the
strongest (winds greater than 155 mph). The scale is designed to give public officials and the general public
usable information on the magnitude of a storm. It gives an indication of the potential wind damages
associated with each hurricane category.

                                                                                                             2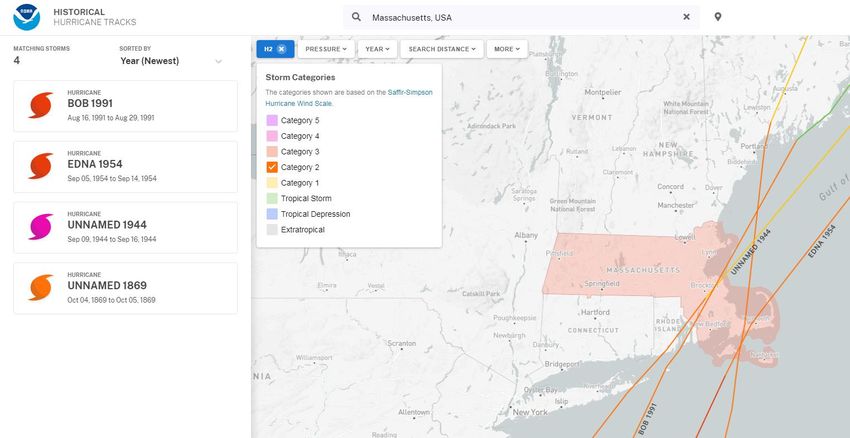
Table 1: Saffir-Simpson Hurricane Wind Scale
 Wind Speed Wind Speed                         Typical Effects
 Category One (1) Hurricane – Weak
 74-95 mph                                     Minimal Damage: Damage is primarily to
 (64-82kt)                                     shrubbery, trees, foliage, and unanchored mobile
                                               homes. No real damage occurs in building
                                               structures. Some damage is done to poorly
                                               constructed signs.
 Category Two (2) Hurricane – Moderate
 96-110 mph                                    Moderate Damage: Considerable damage is done
 (83-95kt)                                     to shrubbery and tree foliage; some trees
                                               typically are blown down. Major structural
                                               damage occurs to exposed mobile homes.
                                               Extensive damage occurs to poorly constructed
                                               signs. Some damage is done to roofing materials,
                                               windows, and doors; no major damage occurs to
                                               the building integrity of structures.
 Category Three (3) Hurricane – Strong
 111-130 mph                                   Extensive damage: Foliage torn from trees and
 (96-113kt)                                    shrubbery; large trees blown down. Practically all
                                               poorly constructed signs are blown down. Some
                                               damage to roofing materials of buildings occurs,
                                               with some window and door damage. Some
                                               structural damage occurs to small buildings,
                                               residences, and utility buildings. Mobile homes
                                               are destroyed. There is a minor amount of failure
                                               of curtain walls (in framed buildings).
 Category Four (4) Hurricane - Very Strong
 131-155 mph                                   Extreme Damage: Shrubs and trees are blown
 (114-135kt)                                   down; all signs are down. Extensive roofing
                                               material and window and door damage occurs.
                                               Complete failure of roofs on many small
                                               residences occurs, and there is complete
                                               destruction of mobile homes. Some curtain walls
                                               experience failure.
 Category Five (5) Hurricane – Devastating
 Greater than                                  Catastrophic Damage: Shrubs and trees are
 155 mph (135kt)                               blown down; all signs are down. Considerable
                                               damage to roofs of buildings. Very severe and
                                               extensive window and door damage occurs.
                                               Complete failure of roof structures occurs on
                                               many residences and industrial buildings, and
                                               extensive shattering of glass in windows and
                                               doors occurs. Some complete buildings fail. Small
                                               buildings are overturned or blown away.
                                               Complete destruction of mobile homes occurs.

                                                                                                    3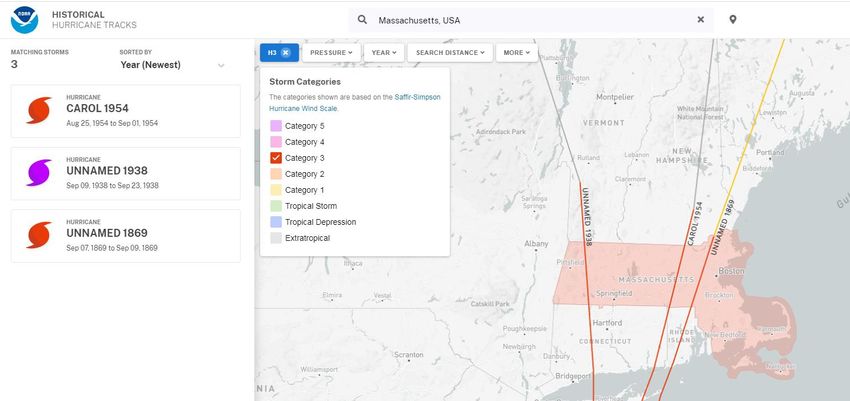
Tropical storm-force winds are strong enough to be dangerous to those caught in them. For this reason,
evacuations and other preparedness actions should be completed before the onset of tropical storm-
force winds, not hurricane-force winds.

NWS issues a tropical storm/hurricane watch when tropical storm/hurricane conditions are possible
within the watch area within the next 48 hours, and a tropical storm/hurricane warning when tropical
storm/hurricane conditions are expected within the warning area within 36 hours or less.

Situation
The National Hurricane Center (NHC) cannot predict with 100% certainty the track of a hurricane or
timing and extent of storm surge flooding. Surge impact may occur before, during, or after storm
landfall, may impact areas far from the storm’s track, is the greatest potential threat in a tropical storm
or hurricane, and may result in thousands of homes and businesses destroyed and affected areas
requiring long-term recovery.

The official hurricane season for the Atlantic Basin (the Atlantic Ocean, the Caribbean Sea, and the Gulf
of Mexico) is from 1 June to 30 November. Peak hurricane season in Massachusetts occurs from mid-
August to late October. However, hurricanes can occur anytime in the hurricane season. Because
Massachusetts’ hurricane season overlaps with tourist season, response operations must consider
evacuation and sheltering of tourists and other visitors.

Direct landfall in Massachusetts by a hurricane or tropical storm is unusual, though not impossible. It is
more likely that these types of storms, which can extend hundreds of miles across, will make landfall at a
different location, further south along the Atlantic coastline of the United States and may subsequently
impact Massachusetts.

Atlantic Hurricane Season Prediction for 2020: August 6 Update
Atmospheric and oceanic conditions are primed to fuel storm development in the Atlantic, leading to
what could be an “extremely active” season, according to forecasters with NOAA’s Climate Prediction
Center, a division of the National Weather Service.

Historically, only two named storms form on average by early August, and the ninth named storm
typically does not form until October 4. An average season produces 12 named storms, including six
hurricanes of which three become major hurricanes (Category 3, 4, or 5).

The updated outlook calls for 19-25 named storms (winds of 39 mph or greater), of which 7-11 will
become hurricanes (winds of 74 mph or greater), including 3-6 major hurricanes (winds of 111 mph or
greater). This update covers the entire six-month hurricane season, which ends Nov. 30, and includes
the nine named storms to date.

                                                                                                              4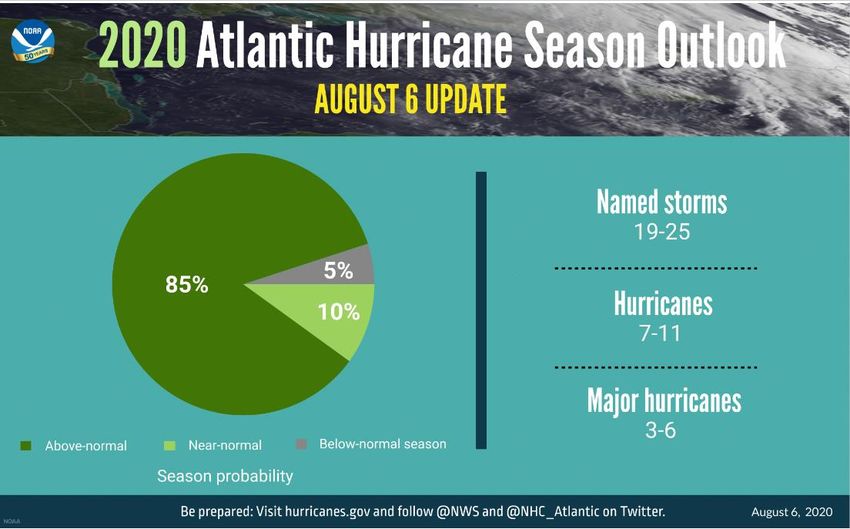
Figure 1: NOAA’s 2020 Hurricane Season Outlook: August 6 Update

Location
Massachusetts, as with other New England states, is vulnerable to hurricanes and tropical storms, as seen
in Figures 2-5 below in part because of the geography of southern New England in relation to the Atlantic
seaboard. Connecticut’s, Rhode Island’s, and Massachusetts’s land masses project easterly into the
Atlantic, and all 3 states have southern exposed shorelines. This geography places these states in direct
line of any storm that tracks all the way to New England, thus placing these states at a greater statistical
risk than states closer to the tropics. Historically, most hurricanes that have struck the New England region
re-curved northward on tracks, which paralleled the eastern seaboard, maintaining a slight north-
northeast track direction.

The entire Commonwealth is vulnerable to hurricanes and tropical storms, depending on each storm’s
track. Massachusetts’s 78 coastal communities are more susceptible to damaging impacts of high winds
and storm surge associated with hurricanes and tropical storms. As coastal development increases, the
amount of property and infrastructure exposed to this hazard will increase. Inland areas, especially those
in floodplains, are at risk for flooding from heavy rainfall associated with tropical storms and hurricanes,
as well as wind damage.

Previous Occurrences
Hurricanes and tropical cyclones impact Massachusetts infrequently. Massachusetts often prepares for
hurricanes and tropical cyclones that are forecasted to potentially impact Massachusetts; however, more
often than not, the track veers and Massachusetts is not impacted.

                                                                                                           5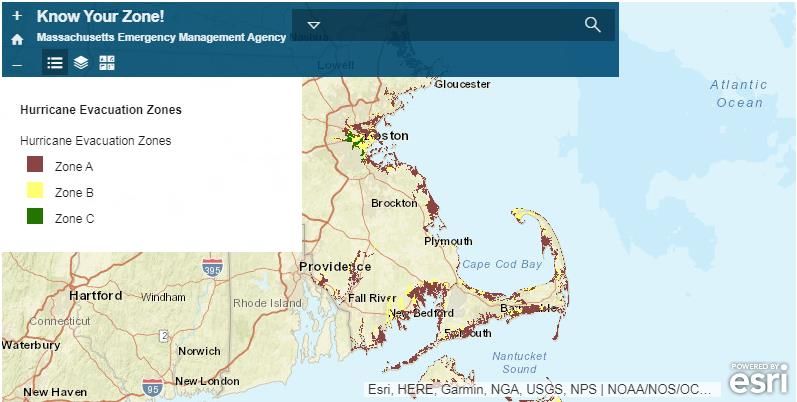
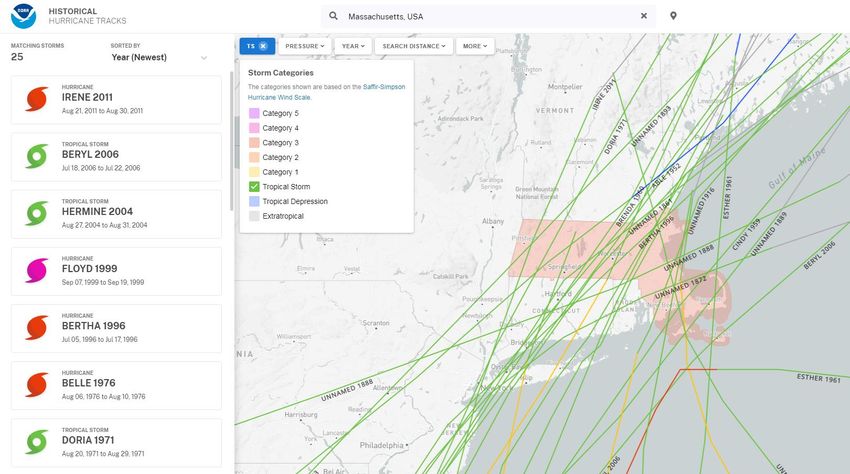
According to NOAA’s Historical Hurricane Tracker, 39 hurricane or tropical storm events have occurred in
the vicinity of Massachusetts between 1842 and 2019. Within this time period the Commonwealth was
not impacted by any Category 4 or 5 hurricanes, however the state was impacted by three Category 3
hurricanes, four Category 2 hurricanes, ten Category 1 hurricanes, and twenty-five tropical storms. In
addition, within this time period a total of 31 tropical depressions and extratropical events impacted the
Commonwealth.

Figure 2: Number of Category 3 Hurricanes Impacting MA from 1842- 2019

Figure 3: Number of Category 2 Hurricanes Impacting MA from 1842- 2019

                                                                                                        6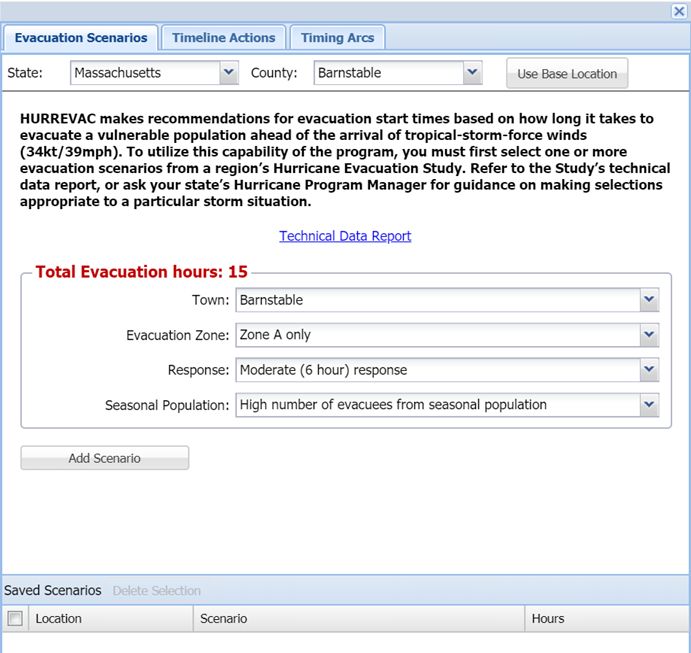
Figure 4: Number of Category 1 Hurricanes Impacting MA from 1842- 2019

Figure 5: Number of Tropical Storms Impacting MA from 1842- 2019

Risk and Vulnerability to Populations
All of the population of Massachusetts is at risk for impacts from hurricanes and tropical storms.
The population of Suffolk County is the most exposed to the hurricane-related storm surge hazard.
Barnstable and Middlesex Counties also have relatively high exposure to this hazard. It should be noted,
however, that impacts from individual hurricane events vary widely; therefore, the populations of all

                                                                                                      7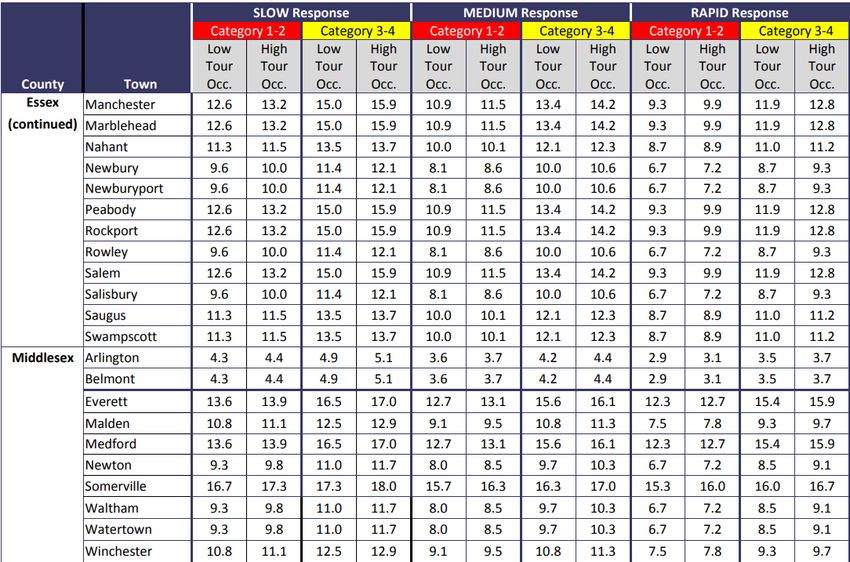
coastal counties are vulnerable to the impacts of a hurricane or tropical storm. In addition, all populations
in Massachusetts are vulnerable to the risks associated with inland flooding when hurricanes and tropical
storms bring heavy rainfall, and those associated with high winds when hurricanes and tropical storms
bring damaging winds.

Populations that live or work in proximity to facilities that use or store hazardous materials are at greater
risk of exposure to these substances during a flood event. Among the exposed populations, the most
vulnerable include people with low socioeconomic status, people over the age of 65, people with medical
needs, and those with low English language fluency. For example:
     • People with low socioeconomic status may not evacuate due to the costs associated with
         evacuation.
     • Individuals with medical needs may have trouble evacuating and accessing needed medical care
         while displaced.
     • Those who have low English language fluency may not receive or understand the warnings to
         evacuate.
     • People between the ages of 10 and 29 and over 60 years of age are found to be more vulnerable
         to floods.
     • During and after an event, rescue workers and utility workers are vulnerable to impacts from high
         water, swift currents, rescues, and submerged debris.
     • Vulnerable populations may also be less likely to have adequate resources to recover from the
         loss of their homes and jobs or to relocate from a damaged neighborhood.
     • An extended loss of power would exacerbate all of these impacts to general and vulnerable
         populations.

Table 2: Population Exposed to Hurricane-Related Storm Surge
                              Category 1         Category 2          Category 3          Category 4
 County       Population
                           Number    % Total   Number    % Total   Number    % Total   Number    % Total

 Barnstable      215,888     5,537     2.6       8,393     3.9      10,543     4.9      11,528     5.3

 Bristol         548,285     2,975     0.5       4,134     0.8       4,773     0.9      29,679     5.4

 Dukes            16,535       310     1.9        301      1.8        475      2.9        562      3.4

 Essex           743,159    13,390     1.8      16,324     2.2      18,091     2.4      18,835     2.5

 Middlesex     1,503,085    27,589     1.8      80,390     5.3      43,427     2.9      44,816     3.0

 Nantucket        10,172        99     1.0        117      1.2        104      1.0        187      1.8

 Norfolk         670,850    13,275     2.0      14,150     2.1      12,744     1.9      12,720     1.9

 Plymouth        494,919    10,563     2.1      13,137     2.7      10,098     2.0       8,912     1.8

 Suffolk         722,023    76,395    10.6     119,445    16.5      42,807     5.9      30,930     4.3

 Total         4,924,916   150,133     3.0     256,391     5.2     143,062     2.9     158,169     3.2
Source: Massachusetts Hazard Identification and Risk Assessment, 2019

                                                                                                           8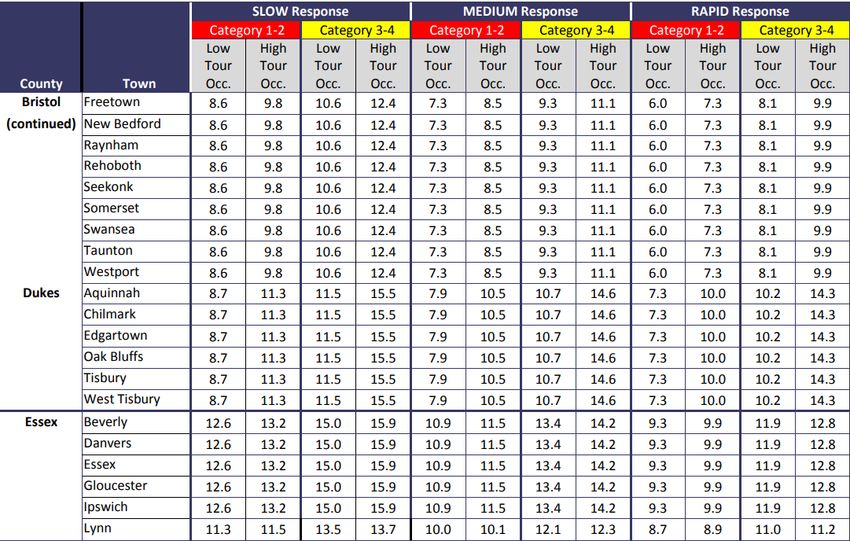
Evacuation Clearance Time
Evacuation clearance time is the time it takes from the first vehicle entering the evacuation roadway
network until the last vehicle enters an assumed point of safety. Clearance time is calculated from the
time an evacuation order is given until either the last evacuee leaves the evacuation zone or the
remaining population is forced to shelter-in-place due to onset of storm impacts.

HURREVAC, the National Hurricane Program's hurricane web-based decision support tool, can be
utilized by local, state and federal government decision makers to better calculate evacuation clearance
time based on the category of storm, response speed, and tourist occupancy. The calculated clearance
times found in the New England Hurricane Evacuation Study, June 2016 have been entered into the
HURREVAC tool. HURREVAC takes the current forecast arrival time of tropical storm force winds and
combines it with those pre-calculated evacuation clearance times to provide the user an evacuation
start time.

Clearance times have been calculated for each Massachusetts coastal community as shown in Table 3.

Figure 6 below provides an example of the HURREVAC Evacuation Scenario Tool for the town of
Barnstable MA; toggled for medium response speed and high tourist occupancy.

Figure 6: Example of HURREVAC Scenario Tool

                                                                                                          9
Table 3: Massachusetts Evacuation Clearance Times (in hours)
1011
Source: New England Hurricane Evacuation Study Technical Data Report, 2016

Jurisdictional analysis of clearance times should include, but are not limited to, consideration factors
such as area demographics and public behavior. See graphic below for a few of the important
considerations.

     Area Demographics                Real World Challenges                  COVID-specific

 •Individuals with                  •Time to secure homes &            •Additional vehicles
  disabilities and others            prepare to leave                   required to separate
  with access and                   •Travel time to leave               healthy & ill populations
  functional needs                   impact area                       •Reduction in available
 •Tourists and other                •High volume of traffic             staff to support
  visitors                          •Bridge closures                    operations
 •Spontaneous and shadow            •Congestion caused by              •Additional time needed
  evacuees                           vehicle breakdowns and             to travel farther to
 •Cross-jurisdiction                 accidents                          shelters and hotels
  evacuees

Sheltering
The choice of public shelters for a specific evacuation is a state and local government/emergency
management decision. State and local authorities will open shelters based on a variety of circumstances
including storm intensity, storm direction, availability of qualified shelter operators and other factors.

                                                                                                           12
Table 3 below depicts public shelter demand by county (number of evacuees expected to seek public
shelter). This data is based on both the behavioral and shelter analysis completed as part of the 2016
New England Hurricane Evacuation Study.
Table 3: Public Sheltering Demand for Category 1 and Category 2 Hurricane
Area Low Tourist Occupancy High Tourist Occupancy
Barnstable County 5184 7372
Boston 2853 2986
Bristol County 2714 2817
Cambridge 241 287
Dukes County 431 767
Essex County 5808 6017
Middlesex County 6521 6583
Nantucket County 269 517
Norfolk County 4165 4211
Plymouth County 4335 4685
Suffolk County 3403 3416
Source: 2016 New England Hurricane Evacuation Study.
Hurricane Evacuation Zones
The US Army Corps of Engineers (USACE) completed hurricane evacuation zone maps for Massachusetts
coastal communities, based on Hurricane Inundation Maps (see information below). The hurricane
evacuation zones do not directly correspond to hurricane categories because storm surge impact is not
measured by, or related to, the Saffir-Simpson hurricane category scale and storm surge threats can vary
from storm to storm (i.e. a very large tropical storm could generate a surge that is much higher than a
small category 2 hurricane). Massachusetts has the following evacuations zones:
• Zone A & B – These zones include areas that, depending on predicted inundation, may flood first
from storm surge during a tropical storm or hurricane. Areas in Zone A would flood before areas
in Zone B.
• Zone C – The cities of Boston and Cambridge have designated a third zone, Zone C, which may
flood depending on the track and intensity of the storm.
These Hurricane Evacuation Zones can be used as a resource for local evacuation decision-making during
hurricanes. These maps are available on the MEMA website both with an Interactive Mapping Tool and
in PDF Maps by Community.
13Figure 7: Massachusetts Hurricane Evacuation Zones
Inundation Areas
The National Oceanic and Atmospheric Administration (NOAA), specifically the National Weather
Service’s (NWS) National Hurricane Center (NHC), utilizes the hydrodynamic Sea, Lake, and Overland
Surges from Hurricanes (SLOSH) model to simulate storm surge in 27 basins along the U.S East and Gulf
Coasts. This information is provided to federal, state, and local partners to assist in a range of planning
processes, risk assessment studies, and decision making. Based on climatology, tens of thousands of
hypothetical hurricanes are simulated in each basin, and the potential storm surges are calculated.
The U.S. Army Corps of Engineers (USACE), FEMA, and NOAA created new worst-case scenario hurricane
surge inundation maps and evacuation zones in 2013-2014 for the Massachusetts Emergency
Management Agency and coastal communities to identify vulnerable areas and guide evacuation
activities.
Emergency managers and public safety officials in communities along the coast or in communities with
waterways connecting to the ocean can view their respective Hurricane Inundation Maps to determine
potential inundation areas. They can also use this information to inform their community of potential
risk and for preparedness and emergency planning efforts, including the need for evacuations in
conjunction with Hurricane Evacuation Zones.
Hurricane Inundation Maps are available on the MEMA website.
14You can also read