2021 Hurricane Season - Forecast Summary - MS Amlin
←
→
Page content transcription
If your browser does not render page correctly, please read the page content below
Risk Analytics

2021 Hurricane Season
Forecast Summary

Executive Summary

  The current predictions (as at 21st June 2021) call
  for an above average U.S. hurricane season, with
  a mean forecast of 17 named storms, 8 hurricanes
  and 4 major hurricanes.

The North Atlantic hurricane                              Hurricane Center (NHC) began                                by El Niño–Southern Oscillation
season officially begins on 1st                           to issue regular Tropical Weather                           (ENSO) forecasts, which indicate
June and ends 30th November,                              Outlooks on 15th May, two weeks                             that ENSO-neutral conditions are
with August, September and                                earlier than it did in previous years.                      likely to dominate this year, which
October representing the busiest                                                                                      is associated with above average
three months. However, tropical                           More than 20 research groups,                               activity (e.g. 2005, 2017).
cyclogenesis is possible earlier                          private companies and universities
than the 1st June, as demonstrated                        produce seasonal hurricane                                  In the Pacific Basin, ENSO-neutral
by the early formation of Tropical                        forecasts each year. The current                            conditions are associated with a
Storm Ana on 22nd May, making                             predictions (as at 21st June 2021)                          smaller number of cyclones. As a
2021 the seventh consecutive year                         call for an above average season,                           result, forecasts indicate a below
that a storm formed before the                            with a mean forecast of 17 named                            average season, with 24 tropical
official start of the season. For this                    storms, 8 hurricanes, and 4                                 storms, 15 typhoons and 9
reason, this year the U.S. National                       major hurricanes. This is driven                            intense storms[1].

Table 1: 2021 Atlantic Hurricane Season Forecasts (as at 21st June) for the number of storms and the accumulated cyclone energy index (ACE Index). To date, 15
research groups, private companies and universities have released forecasts. Predictions from the three best-known forecasters are explicitly shown. Not all forecasts
provide a prediction for ACE, so an ACE average is not provided. ACE is a measure used to indicate the total seasonal tropical cyclone activity in a basin. It represents
the total wind energy, and is calculated as the sum of the squares of the maximum sustained surface wind speed, measured every six hours for all named storms while
they are at tropical storm intensity.

                                                                                                                               Major
 Forecast                                                                   Named Storms              Hurricanes                                     ACE Index
                                                                                                                             Hurricanes
 National Oceanic and Atmospheric Administration (NOAA)[3]                         17                       8                     4                      145

 Colorado State University (CSU) [4]
                                                                                   18                       8                     4                      150

 Tropical Storm Risk (TSR) [5]
                                                                                   18                       9                     4                      140

 Average of 15 forecasts [6]
                                                                                   17                       8                     4                        -

 NOAA Historical Mean Average (1991-2020)                                          14                       7                     3                       122
2021 North Atlantic Forecasts (as at 21                                                                       st
                                                                                                                   June)

The latest forecasts for the 2021        20
                                                                                   X NOAA Historical Average 1991-2020
hurricane season are presented in
Table 1 and Figure 1. To date, 15
research groups, private companies
and universities have released            15
forecasts, which call for an above                              X
average season. These predictions
are based on a range of data
sources, including seasonal weather      10
forecasts, statistical models, and key
atmospheric indices such as the El
                                                                                               X
Niño–Southern Oscillation and North
Atlantic Oscillation (NAO).                5
Note that the forecasts presented
here are for basin-wide activity                                                                                              X
and not landfalling storms. Landfall
activity depends on in-season               0
weather patterns, which are often only             Named Storms                       Hurricanes                   Major Hurricanes
predictable days or weeks in advance.
                                         Figure 1: Box plots summarising the 2021 North Atlantic Hurricane forecasts from 15 different
                                         research groups, private companies, and universities with forecasts as at 21st June 2021. Historical
The strong consensus for an above        averages from the National Oceanic and Atmospheric Administration (NOAA) from 1991-2020 are
average season is due to the latest      also shown with a cross.

ENSO forecasts (Figure 2). ENSO
has a significant impact on tropical
cyclone activity (see “What is ENSO?”
breakout box). ENSO-neutral (between
-0.5°C and +0.5°C in Figure 2) and
La Niña (less than -0.5°C) conditions
are associated with an above average
North Atlantic hurricane season.

ENSO-neutral conditions are currently
in place (Figure 2), with the majority
of forecasts indicating that these
conditions will persist for much of
the Northern Hemisphere summer.
The International Research Institute
for Climate and Society at Columbia
University estimates a 61% probability
of ENSO-neutral and 26% probability
of La-Niña conditions for the peak of
                                            Figure 2: 2021 ENSO forecasts from 25 forecast models (for the NINO 3.4 region) as-at 18th
the North Atlantic season (August-
                                            June 2021. Source: https://iri.columbia.edu/our-expertise/climate/forecasts/enso/current/?enso_
October)[2].                                tab=enso-sst_table[2].
What Happened Last Year?
    The 2020 Atlantic Hurricane Season was a record-breaking year with 30
    named storms, surpassing the previous maximum of 28 set in 2005.

    Table 2: 2020 North Atlantic June forecasts compared to observations and historical averages.
    Source of historical averages: https://www.cpc.ncep.noaa.gov/products/outlooks/Background.html[8].

                                                                        Major              Accumulated
                               Named Storms         Hurricanes
                                                                     Hurricanes           Cyclone Energy
    Mean Average June
                                     17.4               8.6               4.2                  152.3
    2020 forecast

    Observations                      30                 13                6                     180

    1991-2020 Mean
                                      14                 7                 3                     122
    Average

Atlantic Basin
The 2020 Atlantic Hurricane
                                                       6 became major hurricanes                           particularly affected with 9 named
Season was a record-breaking year
                                                       (Category 3+) and the Accumulated                   storm landfalls, of which a record
with 30 named storms, surpassing
                                                       Cyclone Energy (ACE) index was                      5 were in Louisiana. Hurricane
the previous maximum of 28 set
                                                       180. For comparison, an average                     Laura was the costliest landfalling
in 2005. The 30 storms exhausted
                                                       season has 12 named storms, 6                       hurricane, generating economic
the conventional alphabetical list
                                                       hurricanes, 3 major hurricanes and                  losses of US$18 billion[9]. Some
of 21 names (letters Q, U, X, Y and
                                                       an ACE Index of 122. The 2020                       of the most significant activity of
Z are excluded) and so the Greek
                                                       season was fuelled by near-record                   the season occurred in October
alphabet had to be used for only the
                                                       warm sea-surface temperatures in                    and November; 7 named storms, 5
second time in recorded history. It
                                                       the Tropical Atlantic and Caribbean,                hurricanes, and 4 major hurricanes
was also the last time that the Greek
                                                       combined with below average                         formed during this two-month
alphabet will be used—the World
                                                       wind shear anomalies. The actual                    period.
Meteorological Organisation has
                                                       number of hurricanes and major
decided to develop a supplemental
                                                       hurricanes in the North Atlantic was                Despite the particularly active
list[7] of names for 2021, after the
                                                       much higher than the June 2020                      hurricane season, 2020 was not a
general public confused several
                                                       predictions (Table 2); the average                  record-setter in terms of financial
storms last year that had similar-
                                                       forecast of 17.4 named storms                       losses from hurricanes. Although
sounding Greek names (Zeta,
                                                       was 42% lower than the number                       the U.S. recorded a record number
Eta, and Theta). Of the 30 storms
                                                       recorded. The actual ACE for the                    of landfalls, 3 of the 6 hurricanes
in 2020, 13 became hurricanes,
                                                       season (180) was also considerably                  struck areas with some of the
                                                       higher than the forecast average                    lowest population densities along
The 30 storms exhausted
                                                       value (152.3).                                      the U.S. East and Gulf coasts:
the conventional                                                                                           Hanna (Kenedy County, lowest
alphabetical list of 21                                12 of the 30 named storms                           density in Texas) and Laura/Delta
names and so the Greek                                 (including 6 hurricanes) made                       (Cameron Parish, lowest density in
alphabet had to be used                                landfall in the U.S., which                         Louisiana). Nearly all major coastal
for only the second time                               exceeded the record set in 1916                     metropolitan areas were largely
in recorded history.                                   of 9 landfalls. The Gulf Coast was                  unaffected by 2020 storms[9].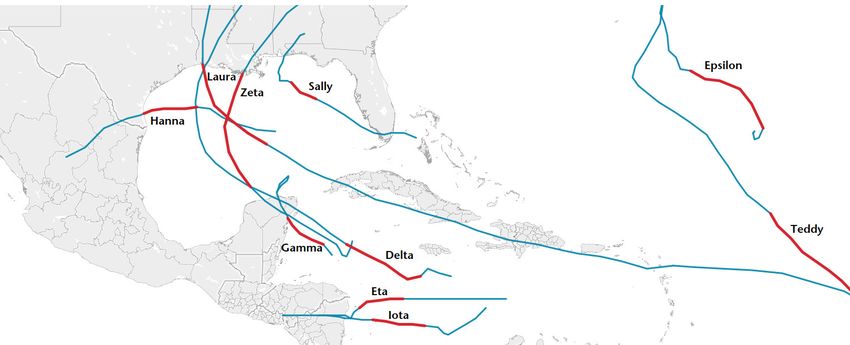
Figure 3: The tracks of rapidly-intensifying 2020 landfalling Atlantic hurricanes (blue) and the period in which they underwent rapid
intensification (in red). Source: Aon Benfield[8].

Rapid Intensification                                  and has favoured more, stronger,

In the Atlantic Basin, 10 storms
                                                       and longer-lasting storms since                          While the Atlantic
                                                       then. However, recent research
underwent rapid intensification,
                                                       has dismissed the existence of the
                                                                                                                Ocean had record
which is defined as an increase in
maximum wind speeds of at least
                                                       AMO, and instead has attributed                          activity in 2020, it was
                                                       the increase in hurricane activity
35 mph over a 24-hour period.
                                                       to human-induced climate change
                                                                                                                a much quieter year
Almost all of the storms that
underwent rapid intensification did
                                                       (see AMO break-out box).                                 in the Pacific Ocean.
so shortly before making landfall
                                                       Pacific Basins
(Figure 3). Rapid intensification of
storms is difficult to forecast and                    While the Atlantic Ocean had
recent research has found that both                    record activity in 2020, it was a                      1-minute average sustained
the frequency and rate of rapid                        much quieter year in the Pacific                       winds[9]. South Korea was impacted
intensification has increased in                       Ocean. In the Western Pacific, just                    by three consecutive typhoons
recent years. The reasons behind                       23 named storms formed, and 12                         which caused and exacerbated
this are likely linked to natural                      reached typhoon status, which is                       flooding, and Haishen caused
variability (such as ENSO), but                        slightly lower than the 1981-2021                      billions of dollars of damage in
the impact of climate change                           average of 26 and 17 respectively.                     Japan. Despite these storms, total
is expected to become more                             This agreed well with the pre-                         seasonal economic losses were the
prevalent with time[10].                               season forecast from Tropical                          lowest since 2010. Activity in the
                                                       Storm Risk, which predicted a                          Eastern Pacific was also below
2020 was the fifth consecutive                         slightly below average season, with                    average with 17 tropical storms
year with an above-normal Atlantic                     26 tropical storms, 15 typhoons                        and 7 hurricanes forming. However,
hurricane season; there have                           and 8 intense typhoons. Despite                        several damaging storms formed
been 18 above-normal seasons                           reduced overall basinwide activity,                    including Tropical Storm Amanda
out of the last 26. In the past, this                  there were still some notable                          that affected El Salvador, and
increased hurricane activity has                       storms such as Super Typhoon                           Hurricane Genevieve that caused
been attributed to a warm phase of                     Goni which became the strongest                        damage in the Baja California
the Atlantic Multidecadal Oscillation                  landfalling tropical cyclone ever                      Peninsula in northwest Mexico.
(AMO)—which began in 1995—                             recorded globally when it struck
                                                       the Philippines with 195mph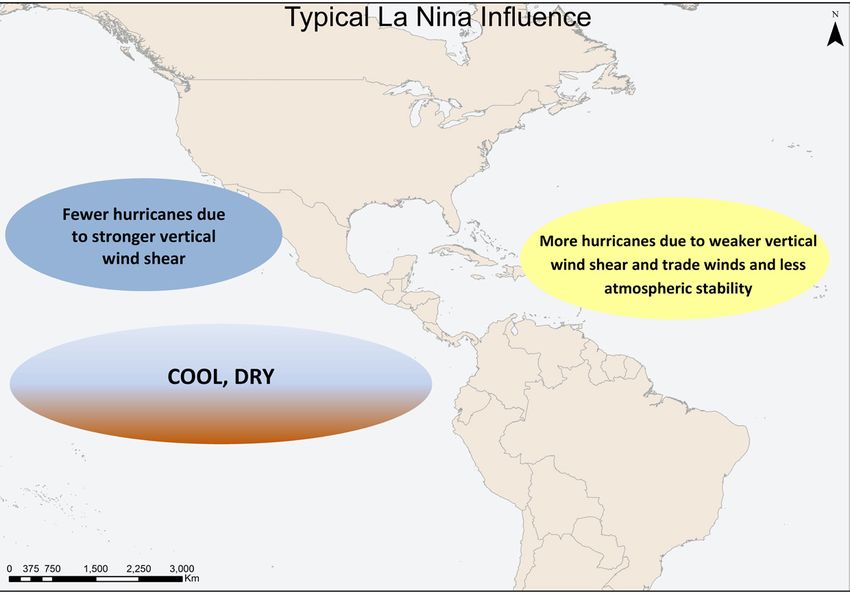
Do ENSO-neutral and La Niña increase
   U.S. mainland landfall risk?
   Yes – there is evidence that both ENSO Neutral and La Niña conditions
   increase activity in the North Atlantic basin, as well as the U.S. landfall risk.

  The North Atlantic historical record
  shows that on average there have been                                                                   8
                                                                         Average Storm Count Per Season

  7 hurricanes per year when the ENSO                                                                                                            El Niño
                                                                                                          7
  phase was neutral or negative since                                                                                                            La Niña       Figure 4: The average number
                                                                                                          6                                                    of hurricanes in the Atlantic
  1950. This decreases to 5 hurricanes                                                                                                           Neutral
                                                                                                                                                               Basin per season since 1950,
  per year during El Niño conditions,                                                                     5
                                                                                                                                                               split by ENSO phase. Counts
  showing the clear suppression of                                                                                                                             are shown for both all (Cat 1-5)
                                                                                                          4
  activity due to increased wind shear.                                                                                                                        and major (Cat 3-5) hurricanes.
  This pattern is observed for both                                                                       3                                                    The analysis was undertaken
  Category 1-5 and Category 3-5                                                                                                                                using the HURDAT2 dataset
                                                                                                          2
                                                                                                                                                               (https://www.aoml.noaa.gov/
  hurricanes (Figure 4).
                                                                                                          1                                                    hrd/hurdat/Data_Storm.html).

  In terms of landfalls, overall Atlantic                                                                 0
  basin activity only explains about 25%                                                                      Cat 1-5                        Cat 3-5
  of the variability in U.S. landfalling                                                                                Hurricane Category
  storms1. This means that an above (or
  below) average season in the basin
  does not necessarily directly translate                                   Table 3: Large US Hurricane losses since 1960 and the corresponding August-October ENSO phase.
                                                                            The Oceanic Niño Index (ONI) is the 3 month running mean of ERSST.v5 sea surface temperature
  into an above (or below) average
                                                                            anomalies in the Niño 3.4 region, obtained from NOAA . The storms were selected based on insured
  season in terms of landfalls, although                                    losses, normalised to 2018 USD.
  it increases the probability. That said,
  9 of the 10 largest losses since 1960                                                  Year                      Storm Name            Oceanic Niño                 ENSO Phase
                                                                                                                                         Index, °C (Aug-Oct)           (Aug-Oct)
  have occurred during ENSO neutral
  conditions (Table 3).                                                                  2017                      Maria                          -0.4                   Neutral
                                                                                         2017                      Irma                           -0.4                   Neutral
  In terms of landfall locations, there                                                  2017                      Harvey                         -0.4                   Neutral
  is some evidence that the probability                                                  2012                      Sandy                          0.3                    Neutral
  of landfalls along the U.S. East Coast
                                                                                         2008                      Ike                            -0.3                   Neutral
  (Georgia to Maine) is higher during
                                                                                         2005                      Katrina                        -0.1                   Neutral
  La Niña years when wind shear is
  low, which allows storms to sustain                                                    2005                      Wilma                          -0.1                   Neutral
  intensities to higher latitudes[11].                                                   1992                      Andrew                         -0.1                   Neutral
                                                                                         1989                      Hugo                           -0.2                   Neutral
                                                                                         1965                      Betsy                          1.9                     El Niño

1. Based on MS Amlin analysis of the HURDAT2 dataset for the period 1851-2017. A coefficient of determination (r2) of 0.25 was found when regressing basin
Accumulated Cyclone Energy (ACE) against US landfalls.
How does                                 Similar to the North Atlantic,
                                         hurricane forecasts for the Pacific
                                                                                                Risk has forecast a slightly below
                                                                                                average season for 2021, with 24

ENSO affect                              basin are dependent on the state
                                         of ENSO. During ENSO-neutral and
                                         La Niña years, a smaller number
                                                                                                tropical storms, 15 typhoons and 9
                                                                                                intense typhoons (compared to the
                                                                                                historical average of 26, 16 and 9
the Pacific                              of cyclones form in the central
                                         Pacific, and these storms tend
                                                                                                respectively). Tropical Storm Risk
                                                                                                note, however, that large uncertainty
                                         be less intense and have shorter                       remains in this forecast, and
basin?                                   durations[12]. As a result of current
                                         ENSO forecasts, Tropical Storm
                                                                                                ultimately it depends on how ENSO
                                                                                                evolves during the year.

What is ENSO?
The El Niño-Southern Oscillation is a periodic
climate pattern which involves changes in
the temperature of waters in the eastern and
central tropical Pacific Ocean. Over timescales
from three to seven years, the surface water
across areas of the Pacific Ocean warms or
cools, and the temperature changes can range
from 1°C to 3°C compared to average sea
surface temperatures. The oscillating pattern
of warming and cooling (ENSO cycle) impacts
rainfall distribution across the tropics and can
influence weather patterns across the world,
including tropical cyclone activity.

There are three phases to the ENSO
phenomenon. The two opposite phases, ‘El
Niño’ and ‘La Niña’ are the extreme phases of
the ENSO cycle where where waters are
warmer and cooler than average respectively,
and the third ‘neutral’ phase is where the sea
surface temperatures in the Pacific Ocean are
close to average conditions.

ENSO influences tropical cyclone activity
primarily via vertical wind shear, which refers to
the change in wind speed and direction high in
the atmosphere (1,500-10,000 meters above
the ground). Strong vertical wind shear tends
to break down storms or prevent them from
forming in the first place.

El Niño (ENSO Positive) is when above-
average sea surface temperatures occur in the
central and eastern tropical Pacific Ocean. El
Niño favours strong hurricane activity in the
central and eastern Pacific basins due to lower
wind shear, whilst it tends to suppress activity
in the Atlantic basin due to higher wind shear
(Figure 5, top).

La Niña (ENSO Negative) is when below-
average sea surface temperatures occur in in          Figure 5: Typical influence of El Niño (top) and La Niña (bottom) on Pacific and Atlantic
the central and eastern tropical Pacific Ocean.       seasonal hurricane activity. Map based on originals by Gerry Bell.
La Niña tends to suppress hurricane activity in
the central and eastern Pacific basins and
enhance it in the Atlantic basin (Figure 5,
bottom).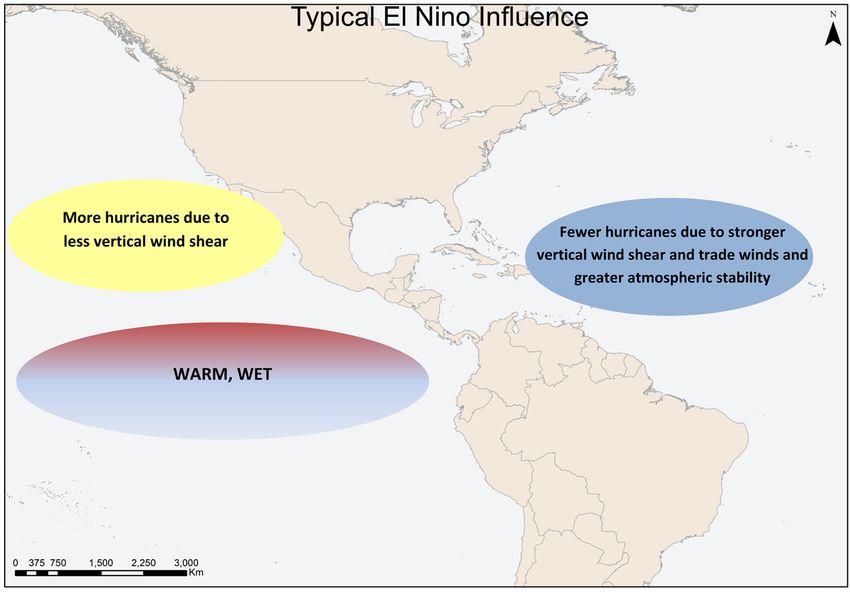
The rise and fall of the AMO
Over two decades ago, the term the              this phenomenon have claimed that the                      thought that the AMO has been used
“Atlantic Multidecadal Oscillation”             AMO does not exist, and the observed                       by some scientists to dismiss, among
was coined to describe an internal              temperature variations are due to                          other things, the impact climate change
oscillation in the climate system that          competing anthropogenic drivers during                     is having on increasingly active and
led to alternating decades-                     the historical era (greenhouse warming                     destructive Atlantic hurricane seasons,
long intervals of warming                       and sulphate aerosol cooling), and the                     attributing the increase in recent
and cooling centred in the                      impact of volcanic dust emitted into the                   decades to a supposed upturn in the
extra-tropical North Atlantic.                  atmosphere in earlier periods[14]. It is                   AMO.
This 40-60 year oscillation
in sea surface temperatures
was thought to be partly
responsible for periods of
increased and supressed
Atlantic hurricane activity[13].
Figure 6 shows the AMO index
and the five-year average
annual Atlantic hurricane
counts. More recently, the
scientists responsible for
first identifying and naming

                                   Figure 6: A bar graph of the Atlantic Multidecadal Oscillation Index and five-year average annual Atlantic hurricane counts.
                                   Source: https://www.climate.gov/sites/default/files/AMO_and_TCCounts-1880-2008_0.png [15].

How reliable are the forecasts?
The accuracy of a particular prediction                                                            0.9   Hurricanes
varies depending on how long                                                                      0.8
before the start of the season it was                                                              0.7
generated, with those closer to the peak                                                           0.6
of the season having higher accuracy.                                                             0.5
                                                                                           rank

Figure 7 shows the skill of three                                                                  0.4
                                                  Figure 7: Skill scores for three                 0.3
forecasters for the Atlantic basin over
                                                                                           r

                                                  different forecasting agencies for the          0.2
the period 2003-2015. As can be seen,             period 2003-2015. A rank correlation             0.1
predictions issued in August generally            (rrank) of 1 would indicate a perfect
                                                                                                  0.0
have higher accuracy (as reflected                prediction of the number of North
                                                                                                  -0.1
by the rank correlation score) than               Atlantic hurricanes. Source: http://
                                                                                                  -0.2
                                                  seasonalhurricanepredictions.bsc.
predictions issued in May or June.                                                                -0.3
                                                  es/skill
                                                                                                            April                June                 August

What about climate change?
Scientific theory and computer modelling        around quantifying this role. In addition,
indicate that climate change will increase      changes in insured losses are due not
the intensity of across the world, as well      only climate change, but also to changes
as the frequency of very intense storms         in exposure and additional factors such
(Category 4+)[16]. In addition, the risk        as loss adjustment expenses. As an
from both inland and coastal flooding           example, a reoccurrence of Hurricane
associated with tropical cyclones is likely     Andrew today would result in an insured
to increase due to greater rainfall and         loss in the region of US$50-60 billion[18].
sea level rise.                                 Whilst it is probable that climate change
                                                would contribute to this increase in
What does this mean for 2021? The               loss (e.g. due to sea level rise), Miami
answer is complicated. While we                 has also seen huge population growth
know that climate change is likely to           since 1992 and this would certainly be
have played a role in recent tropical           a significant – if not the primary – factor
cyclones[17], large uncertainties remain        influencing the increased loss potential
                                                for this storm.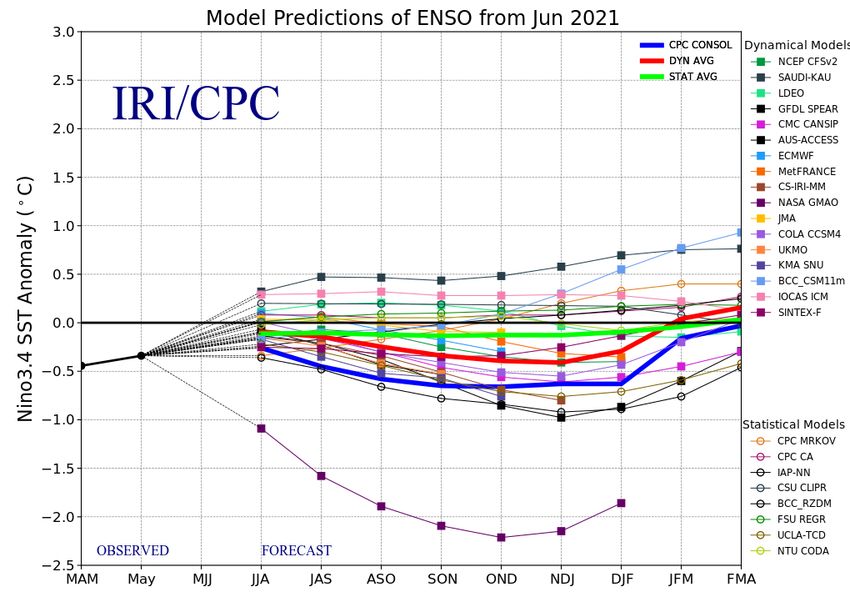
What Happens                                                                                  The major research groups and
                                                                                                 universities will release updated
                                                                                                 forecasts in July/August. If there are

   Next?
                                                                                                 any material changes to the outlook
                                                                                                 then MS Amlin’s team will release
                                                                                                 an updated forecast summary.

 Contacts                                                  Cameron Rye
                                                           Research Manager
                                                                                                 Jess Boyd
                                                                                                 Senior Research Analyst
                                                           Cameron.Rye@msamlin.com                Jess.Boyd@msamlin.com

References
1.    TSR, “Extended Range Forecast for Northwest Pacific Typhoon Activity in 2021,” URL (Accessed: 3 June 2021), 2021.
2.    IRI, “IRI ENSO Forecast,” URL (Accessed: 3 June 2021), 2021.
3.    NOAA, “NOAA 2021 hurricane forecast,” URL (Accessed: 28 May 2021), 2021.
4.    CSU, “Forecast for 2021 Hurricane Activity,” URL (Accessed: 3 June 2021), 2021.
5.    TSR, “Extended Range Forecast for Atlantic Hurricane Activity in 2021,” URL (Accessed: 3 June 2021), 2021.
6.    BSC, “Seasonal Hurricane Predictions,” URL (Accessed: 3 June 2021), 2021.
7.    WMO, “Supplemental list of tropical cyclone names in RAIV,” URL (Accessed: 3 June 2021), 2021.
8.    NOAA, “Background Information: North Atlantic Hurricane Season,” URL (Accessed: 3 June 2021), 2021.
9.    Aon Benfield, “Weather, Climate & Catastrophe Insight: 2020 Annual Report,” URL (Accessed: 3 June 2021), 2021.
10.   K. V. G. K. T. e. a. Bhatia, “Recent increases in tropical cyclone intensification rates.,” Nature Communications, no. URL 2019.
11.   S. R. Smith, J. Brolley, J. J. O’Brien and C. A. Tartaglione, “ENSO’s impact on regional US hurricane activity,” Journal of
      Climate, vol. 20, p. 1404–1414, 2007.
12.   S. J. Camargo and A. H. Sobel, “Western North Pacific tropical cyclone intensity and ENSO,” Journal of Climate, vol. 18,
      2005.
13.   M. E. Mann, J. Park and R. S. Bradley, “Global interdecadal and century-scale climate oscillations during the past five
      centuries,” Nature, vol. 378, p. 266–270, 1995.
14.   M. Mann, “The Rise and Fall of the “Atlantic Multidecadal Oscillation”,” URL (Accessed: 3 June 2021), 2021.
15.   climate.gov, “Atlantic Multidecadal Oscillation,” URL (Accessed: 3 June 2021), 2021.
16.   T. Knutson, S. J. Camargo, J. C. L. Chan, K. Emanuel, C.-H. Ho, J. Kossin, M. Mohapatra, M. Satoh, M. Sugi, K. Walsh and
      others, “Tropical cyclones and climate change assessment: Part II: Projected response to anthropogenic warming,” Bulletin
      of the American Meteorological Society, vol. 101, 2020.
17.   G. J. Van Oldenborgh, K. Van Der Wiel, A. Sebastian, R. Singh, J. Arrighi, F. Otto, K. Haustein, S. Li, G. Vecchi and H. Cullen,
      “Attribution of extreme rainfall from Hurricane Harvey, August 2017,” Environmental Research Letters, vol. 12, 2017.
18.   Swiss Re, “15 years after Katrina: Would we be prepared today?,” URL (Accessed: 3 June 2021), 2020.

This research report has been prepared for information purposes only and is provided to you on the basis that it is not advice and should not be
relied upon in making any decisions. The report has been prepared and issued by MS Amlin using information and data compiled from publicly
available sources that MS Amlin believes to be reliable. However, MS Amlin cannot guarantee the accuracy or completeness of the information
and data and have not sought for this information to be independently verified. MS Amlin makes no representation or warranty as to the accuracy
or completeness of the information and data and shall not be responsible for any omissions or errors contained in it. This research report cannot
be used as the basis of any claim or cause of action. Commentary and opinions contained in this report represent those of the author of this
research report at the date of this report. Any forward looking statements or forecasts are based on assumptions or projections, forecasts and
other uncertainties and other unknown risks and factors in the light of currently available information. The forecasts described in this report
should be evaluated keeping those factors in mind.

To the fullest extent permitted by applicable law, MS Amlin shall not be liable for any direct, indirect or consequential losses, loss of profits,
damages, costs or expenses suffered or incurred by any person arising out of or in connection with any use or reliance on any information
contained in this research report.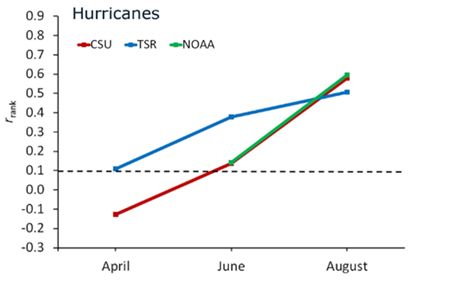
You can also read