Phytoplankton species potentially Harmful Algal Blooms (HABs) in Jakarta Bay - IOPscience
←
→
Page content transcription
If your browser does not render page correctly, please read the page content below
IOP Conference Series: Earth and Environmental Science

PAPER • OPEN ACCESS

Phytoplankton species potentially Harmful Algal Blooms (HABs) in
Jakarta Bay
To cite this article: T Sidabutar et al 2021 IOP Conf. Ser.: Earth Environ. Sci. 744 012077

View the article online for updates and enhancements.

                                This content was downloaded from IP address 46.4.80.155 on 03/07/2021 at 18:10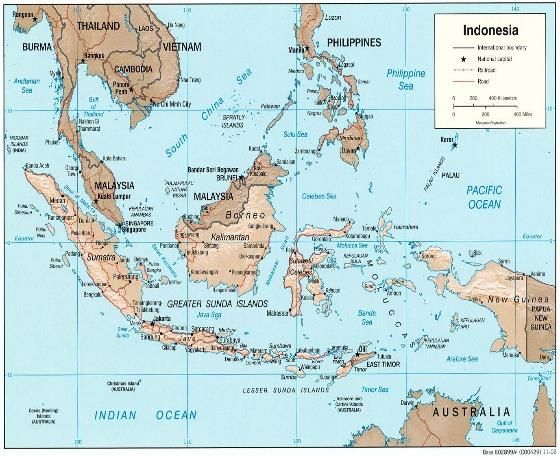
International Symposium on Aquatic Sciences and Resources Management                     IOP Publishing
IOP Conf. Series: Earth and Environmental Science 744 (2021) 012077  doi:10.1088/1755-1315/744/1/012077

Phytoplankton species potentially Harmful Algal Blooms
(HABs) in Jakarta Bay

                     T Sidabutar1,*, E S Srimariana2 and S Wouthuyzen1
                     1
                      Research Centre for Oceanography, LIPI. Jl. Pasir Putih I, Jakarta 14430, Indonesia
                     2
                      Faculty of Fisheries and Marine Sciences, IPB University (Bogor Agricultural
                     University), Jl. Agatis Darmaga Bogor, Bogor 16680, Indonesia

                     *Corresponding author: tumpaksid@gmail.com.

                     Abstract. The occurrence of algal bloom causes problems in many parts of the world, including
                     in tropical Indonesian coastal waters. Harmful algal bloom events in Jakarta Bay have been
                     increased since several years ago and causing massive fish kills which lead to economic losses
                     in local fisheries, a decrease of water quality, and threat to people consuming fish from the bay.
                     Research was conducted in Jakarta Bay in 2008, 2009, 2010, 2011, 2013 and 2015, to study the
                     variability of phytoplankton species that potentially as bloom maker. The samples were taken by
                     20 μm mesh size plankton net which deployed vertically to a depth of 7 - 10 meter at each station.
                     The results showed that the abundance of phytoplankton ranged from 106 to 108 cells.m-3. The
                     population composed of 27 taxa, mostly belong to diatoms and dinoflagellates. We observed
                     there are nine genera of phytoplankton which potentially as harmful algal bloom species,
                     occurring in Jakarta Bay. Three of them are known as the predominant species of algal bloom in
                     this bay, namely: Skeletonema, Chaetoceros, and Thalassiosira. Besides that, there are some
                     species also playing a role in the tragedy of fish-killing due to oxygen depletion during blooms
                     events in Jakarta Bay.

                     Keywords: algal blooms; potentially; predominant; variability

1. Introduction
Phytoplankton bloom often occurs, especially in the coastal waters, and causes discoloration in the
surface water, traditionally known as "red tide" [1-3]. Most of the algal bloom may cause detrimental
impact, so this event now referred to as harmful algal bloom (HABs). Harmful algal bloom (HABs) may
now be defined as a significant increase in abundance, biomass or the population size of micro-algae
and in its turn, may harm human health, fisheries, aquaculture, and tourism. HABs may cause harm to
the environment and other organisms in several ways, even though not all phytoplankton blooms are
harmful [4].
   The causative species of red tide, usually comprised of one or two, even more, phytoplankton species
which are identified as the predominant species. Most of the phytoplankton responsible for the bloom
events in the coastal belong to six algal groups; diatoms, dinoflagellates, haptophytes, raphidophytes,
cyanophytes, and pelagophytes [5-7]. The growth and distribution of algal blooms, traditionally
controlled by the complex environmental process involving multiple factors such as; solar radiation,
temperature, current patterns, and other associated factors and the nutritional requirements of the
organisms [8]. There is growing recognition that HAB's are affected by human activities, but their exact

              Content from this work may be used under the terms of the Creative Commons Attribution 3.0 licence. Any further distribution
              of this work must maintain attribution to the author(s) and the title of the work, journal citation and DOI.
Published under licence by IOP Publishing Ltd                          1
International Symposium on Aquatic Sciences and Resources Management IOP Publishing
IOP Conf. Series: Earth and Environmental Science 744 (2021) 012077 doi:10.1088/1755-1315/744/1/012077
causes are still under debate. Eutrophication is one of the major causes of many blooms, although not
all blooms are the result of anthropogenic changes in nutrient loadings [8-13].
Recently, Jakarta Bay has been experiencing algal blooms events since 1991 [14]. The frequency
and distribution of algal bloom phenomena have been increasing and had caused massive fish kills which
led to economic losses in local fisheries, decrease of water quality, and also effected the areas of local
tourism in the surrounding bay [15-17]. Most of the algal bloom occurs due to phytoplankton population
explosion, especially diatom, dinoflagellates, and cyanobacteria groups [18-20].
The purpose of the research was to study the abundance of phytoplankton population and to identify
the species that potentially HABs species and as bloom-forming species in Jakarta Bay. The survey was
carried out to provide baseline information on harmful algal bloom ecology for management purposes
of the bay shortly.
2. Methods
2.1. Study sites
The survey took place in Jakarta Bay. Jakarta Bay is a tropical estuary part of the Java Sea located north
of the DKI Jakarta province, Indonesia. In this bay, 13 rivers flow into the bay. Jakarta Bay, which
covers an area of about 514 km2, is a shallow water area with an average depth of up to 15 meters. The
sediment for the study was collected at 13 sampling stations. Map of Jakarta Bay and the sampling
station is showed in figure 1.
Jakarta Bay
1 2 3 4
5 6 7 8
9 10 11 12
0
Figure 1. Map of Jakarta Bay and the sampling stations.
2International Symposium on Aquatic Sciences and Resources Management IOP Publishing
IOP Conf. Series: Earth and Environmental Science 744 (2021) 012077 doi:10.1088/1755-1315/744/1/012077
2.2. Research period
The research was carried out in the east-monsoon season or dry seasons in 2008, 2009, 2010, 2011, 2013
until 2015. The study was conducted in the dry season, considering the algal bloom events usually
reoccurred in this bay during the east-monsoon season. Commonly, the season in this region is classified
into west-monsoon or rainy season. Between the two seasons, there are two transitional seasons. The
rainy season occurs from October to March and the dry season from April to September. In the rainy
season, usually anthropogenic material enters the waters through sewage discharge, freshwater run-off,
rivers flowing into the bay. After the rainy season, the concentration of nutrients (mainly N and P)
usually increased and fertilizing the waters to a certain level.
2.3. Sample collection and analysis
Phytoplankton sampling was carried out using a 125 cm length and 25 cm opening mouth cone-shaped
20 um mesh-size phytoplankton net which at the end was installed with a pinch to collect concentrates
of phytoplankton samples. At the end of the net, a ballast was installed so that it can be lowered
vertically. The sampling was carried out by lowering the phytoplankton net vertically up to a depth of
7-10 m and then being drawn slowly with a constant from a desired depth to the surface. Phytoplankton
samples were collected in the bucket and then put into a sample bottle and given preservatives. Samples
were preserved immediately using acidic 5% Lugol's solution [21]. The preserved phytoplankton
samples were brought to the laboratory for further quantitative and qualitative analysis under an
Olympus inverted microscope (Model IX50-S8F2). Phytoplankton removal was done by Sedgwick-
Rafter Counting Cell [22, 23]. Quantitatively, the abundance of phytoplankton cells from each
phytoplankton genus was calculated. Phytoplankton was identified to the genus level using identification
keys of several taxonomic references [24-26]. The cell counts were used to compute the cell abundance
using formula according to the procedure described in a manual book [21]. The total number of cells of
individual species collected at each depth of each station was quantified and the phytoplankton
abundance was expressed as the number of cells per cubic volume.
2.4. Measurement of nutrients and oceanographic parameters
The nutrients measured were dissolved inorganic nitrogen (DIN), including ammonium nitrogen (NH4-
N), nitrate-nitrogen (NO3-N), and nitrite-nitrogen (NO2-N), and dissolved inorganic phosphorus (DIP),
including phosphate-phosphorus (PO4-P). The method for analysis of nutrients used in this study was
based on the transformation, through a chemical reaction of the substance to be analyzed, to another
compound that can be measured colorimetrically within the wavelength range of the visible spectrum
according to the method of by Strickland et al [27]. The water sample was filtered through Millipore
filter paper pore size 0.45 µm (GF/C). The spectrophotometer employed in this study was a Philips PYE
Unicam (Model PU8600). As a general rule, all samples were analyzed as soon as possible after
collection and especially when the concentration was expected to below. Other Oceanographic
parameters such as water depth, water temperature, dissolved oxygen, and salinity were measured in
situ. The readings of water temperature and dissolved oxygen were taken directly from a YSI Dissolved
Oxygen Meter (Model 59) and salinity (in parts per thousand) was measured using an ATAGO Hand
Refractometer. The degree of acidity (pH) of seawater is measured by the pH meter of the TOA model
of HM-IK model by dipping the electrode into it.
3. Results and discussions
3.1. Oceanographic parameters
The water temperature during the study period ranged from 29.72 °C –30.48 °C with 29.97 °C average.
The lowest temperature value was 29.37 °C in May 2008 and the highest was 30.48 °C observed in
March 2013. Salinity values of the bay ranged from 27.72–30.88 psu and, average 28.98 psu. The lowest
salinity during the study was 26.41 PSU, which occurred in March 2009 and the highest salinity was
30.88 occurred in May 2010. The salinity range was relatively stable with the exception in May 2008
3International Symposium on Aquatic Sciences and Resources Management IOP Publishing
IOP Conf. Series: Earth and Environmental Science 744 (2021) 012077 doi:10.1088/1755-1315/744/1/012077
and March 2009 and June 2009. The dissolved oxygen (DO) ranged from 2.96 – 4.12 ppm. The lowest
oxygen was 2.96 ppm recorded in March 2009. The pH ranging from 7.68-8.30. The lowest pH occurred
in July 2015 and the highest in May 2015. There are no extreme values of the oceanographic parameters
during the study periods, except dissolved oxygen was depleted in March 2009. And also, there is no
distinct stratification occurred due to shallow water depth (6–15 meters) of the bay, as well as the
flushing by tides motion and currents.
3.2. Surface water discoloration due to algal bloom
The results of observations of colour changes due to algal blooms in the waters of Jakarta Bay are shown
in table 1. The presence of algal blooms is seen from March to July and September to November. The
algal bloom phenomenon occurs not only during the eastern season (dry season) but also at the beginning
of the western season (wet season). This shows that the occurrence of the algal bloom phenomenon is
still difficult to predict with certainty and does not only occur in the eastern monsoon. In the waters of
Jakarta Bay, the HABs phenomenon is more intense in the eastern season or after the rainy season. If
the water conditions are favourable, in general, the phenomenon of algal bloom will occur during that
season. In several countries such as Hong Kong, Japan, and the Philippines, and China, there has been
a shift in both the frequency and season of the occurrence of the algal bloom phenomenon in coastal
waters [13, 28]. The occurrence of the algal bloom phenomenon almost every month can be seen on the
surface of the waters with different locations, colours, and coverage areas. The frequency of algae
blooms in Jakarta Bay tended to increase during the study from 2008 to 2015. The colours seen ranged
from mixed colours to single, more striking colours. The area where the colour change occurs also varies
from 25 percent to 50 percent of the area of Jakarta Bay [19]. The phenomenon of algal bloom is more
often seen in these waters at the beginning of the eastern season (dry season) or the end of the western
season (rainy season) until the end of the eastern season, and the exact time and time of its occurrence
cannot be predicted.
Table 1. The frequency of discoloration due to algal bloom throughout the study.
Surface water Discoloration due to algal bloom
Months Frequency
2008 2009 2010 2011 2013 2015
January - - - - - - 0
February - - - - - - 0
March x x x x x 5
April x x x x x x 6
May x x x x x 5
June x x x x x x 6
July - - - x x x 3
August - - - - - - 0
September x x x x x 6
October x x x x x x 6
November x x x x x x 6
December - - - - - - 0
3.3. The abundance of phytoplankton
The abundance of phytoplankton during this study ranging from 21.71x10 6 cells .m-3 up to 20.61x10⁸
cells.m- 3. The highest abundance of phytoplankton population observed in 2010, ranging from 46.6x10 7
cell.m-3 up to 28.49x10⁸ cell.m-3. The graph of phytoplankton abundance is shown in figure 2. The
abundance of phytoplankton in 2010 was enormously multiplied in cells number. There is connectivity
of this condition, high abundance with El-Nino. The abundance was very distinctive comparing to the
condition before and after 2010. The highest peaks of the population reached an abundance of more than
106 cells.m-3. During that time, water discoloration appeared in the surface water, due to algal bloom
4International Symposium on Aquatic Sciences and Resources Management IOP Publishing
IOP Conf. Series: Earth and Environmental Science 744 (2021) 012077 doi:10.1088/1755-1315/744/1/012077
[29-31]. Normally, surface water discoloration in this bay reappearing, if the abundance of the cell
reached a number more than 105 cells.m-3 [32].
In Jakarta Bay, most of the algal bloom events reoccur in the dry season, precisely beginning a few
weeks after the rainy season is over [20]. In this study, the highest frequency of bloom incidence was
observed from March to June and during the rainy season from September to November. Algal bloom
events appeared during the dry season which is started from March to June and then reappeared mostly
from September to November. The dry season is usually characterized by less precipitation, high nitrate
and phosphate concentration, higher air temperature, and available sunlight intensity. This condition
will trigger the growth of phytoplankton to grow faster and reach a high density of cells during that
season.
So far, the incidence of algal blooms in Jakarta Bay has been increasing both in frequency and
distribution [33]. Discoloration due to algal blooms phenomena in Jakarta Bay, reoccurring mainly in
March until June and occasionally in September to November. During the rainy season from December
to February, there was no appear discoloration of surface waters due to algal bloom. It is apparent, that
the algal bloom episode in Jakarta Bay is associated with the dry season (precisely after rainy season)
when the N/P ratio increased in the waters from March and April [33, 34].
It is quite interesting to note the graph abundance of phytoplankton during the year of 2010. The
results showing that the phytoplankton population in March 2010 dominated by Skeletonema (relative
abundance: 86.03%), in May 2010 dominated by Chaetoceros (relative abundance: 62.9%) and
Skeletonema (relative abundance: 32.34%). In June 2010, it was observed three predominant species
namely Skeletonema (relative abundance: 59.79%), Chaetoceros. (relative abundance: 29.3%) and
Thalassiosira (relative abundance: 17.45%). In conclusion, the main predominant species during 2010
were Skeletonema, Chaetoceros, and Thalassiosira. Bloom phenomena in the waters can be recognized
visually through the discoloration of surface water due to the occurrence of phytoplankton species in a
high abundance [17, 18]. Usually, in Jakarta Bay, the discoloration can be seen in the surface water
when the population of phytoplankton reached abundance between 10 5-106 cells.m-3 [19, 20]. The
primary factor that can trigger the growth of phytoplankton, such as the availability of nutrients mainly
phosphate (P) and nitrogen (N).
2500.00
2060.71
Abundance (million cells/m3)
2000.00
1458.06
1500.00
1000.00
466.00
500.00
252.29
172.78
21.71 71.48 63.65 40.97 57.97 70.04 47.82
0.00
Mar Mei Mar Jun Mar Mei Jun Mar Jul Mar Mei Jul
2008 2009 2010 2011 2013 2015
Observations
Figure 2. The abundance of phytoplankton throughout the study.
5International Symposium on Aquatic Sciences and Resources Management IOP Publishing
IOP Conf. Series: Earth and Environmental Science 744 (2021) 012077 doi:10.1088/1755-1315/744/1/012077
3.4. Nutrient ratio
The average concentration of nitrate during the study period ranged from 0.01-15.89 ppm, and the
concentration of phosphate ranged from 0.01-2.5 ppm. The highest concentration of phosphate was
observed in 2009, while the highest nitrate was observed in 2015. The concentration of phosphate tends
to decrease, on the contrary, the nitrate concentration tends to increase throughout the study. The results
revealed that nitrate concentration increasing and phosphate concentration decreasing in the waters from
2008 until 2015. A previous study, showing an increasing inorganic matter observed in Jakarta Bay,
resulting in an increased incidence of algal blooms since the 1970s [15]. Starting in the '70s to the 80's
algal blooms were rarely seen, but in the '90s the algal bloom seemed to increase in connection with the
increasing amount of anthropogenic nutrients in the bay. The relationship between the increase of
eutrophication with the expansion of algal bloom in the bay is still not proven although in general
eutrophication may result in the explosion of phytoplankton population [28].
The average of N/P ratio during this study is ranged from 0.2 – 45.5. It was recorded that a higher
N/P ratio was observed from 2010 until 2013. In 2010, the highest concentration of nitrate was recorded
in May with a value of 10.61 μg/L and phosphate 0.58 μ/L. During the study, the N/P ratio reaches the
value to 18, which means that N plays a role as a triggering factor and P as a limiting factor for the
growth of phytoplankton. It is evident, that ratio or proportions of nutrients, especially nitrogen (N) and
phosphorus (P), as the primary cause of changing blooms in the bay. The nitrogen and phosphor were
acting as the key factors which stimulate phytoplankton growth. The nutrient N/P ratio during the study
ranged from 0.2 up to 45.5. Nitrogen was playing as a triggering factor, while phosphate was a limiting
factor to the growth of phytoplankton.
It is apparent, that there is a strong linkage between nitrate concentration and the abundance of
phytoplankton. There was a connection between high ratios of N/P with the algal bloom abundance. The
nutrients ratio of N/P showing that N plays as the primary factor that can stimulate the growth of
phytoplankton. The concentration of P is the limiting factor, meaning that at least, there should be a
certain amount of P in the waters. Both of these nutrients N and P is seemed to be complementary to
each other and together may controlling the growth of phytoplankton.
3.5. The composition of phytoplankton population
The results of the study showing that Skeletonema, Chaetoceros, and Thalassiosira were the
predominant species that cause algal bloom in Jakarta Bay (figure 3). The predominant species in this
case meaning that the species which can reach an abundance of more than 10%. These predominant
species are classified quite important in this bay because, they play an important role in the ecosystem
dynamics, and as well as an indicator of the ecological condition. The relative abundance of Skeletonema
ranged from 12.25%-86.0% of the total population, while the abundance of Chaetoceros ranged from
1.41%-63.96% of the total population and Thalassiosira abundance ranged from 0.2%-26.26% of total
abundance.
Others
Nitzschia
9% Skeletonema
5%
Thalassiosira 49%
9%
Chaetoceros
28%
Figure 3. The relative abundance of predominant species throughout the study.
6International Symposium on Aquatic Sciences and Resources Management IOP Publishing
IOP Conf. Series: Earth and Environmental Science 744 (2021) 012077 doi:10.1088/1755-1315/744/1/012077
Table 2. The phytoplankton has the potential for HAB’s in Jakarta Bay.
Relative Abundance (%)
Phytoplankton
Minimum Maximum Averages
Skeletonema 12.25 86.03 48.55
Chaetoceros 1.41 63.96 29.33
Thalassiosira 0.18 26.26 6.91
Navicula 0.24 25.99 2.20
Thalassiotrix 0.01 16.17 3.10
Leptocylindrus 0.01 13.74 1.60
Asterionella 0.01 10.18 1.67
Ceratium 0.04 6.63 0.89
Nitschia 0.54 6.13 2.63
Bacteriastrum 0.07 2.61 1.27
Others 0.001 1.25 0.001
Most of the predominant species in this bay belong to diatom (table 3). They can be classified as the
potential species of algal bloom-forming namely; Skeletonema, Chaetoceros, Thalassiosira, Navicula,
Thalassiotrix, Leptocylindrus, and Asterionella. There are two other species such as Ceratium and
Nitzschia can be classified as species that potentially bloom-forming species in these waters. The
species Skeletonema and Chaetoceros are often found dominant in the coastal waters.
4. Conclusion
Most of the causative species of phytoplankton blooms belong to the group of diatoms, which is
responsible for the incidents of fish kills during bloom events in Jakarta Bay. The diatoms that are
classified as common species and bloom-forming species in this bay namely; Skeletonema, Chaetoceros,
and Thalassiosira, Bacteriastrum, Coscinodiscus, Leptocylindrus, Nitzschia, and Thalassiotrix. Three
of them such as Skeletonema, Chaetoceros, and Thalassiosira were classified as the primary species
which potentially as HABs in Jakarta Bay. The predominant species usually reach an abundance of
more than 10% of the total population. Therefore, those species are quite important in the ecosystem
because it plays important role in the dynamics of marine life and as well as a biological indicator for
the condition of the waters.
The abundance of phytoplankton is closely related to the increasing N/P ratio in the waters.
Eutrophication or excess nutrients in the waters may result in changing of nutrients (N/P) ratio.
Consequently, changes in total biomass and species composition leading to succession between
populations. The range of the N/P ratio in the waters of the Bay of Jakarta in the eastern monsoon is
around 0.2-45.5.
Acknowledgments
The authors would like to thank the authorities of our institution Research Centre for Oceanography,
The Indonesian Institute of Sciences for financial support of this research through the Research Grant
Program. Authors also wishing to acknowledge the assistance and encouragement of our colleagues,
special work by technical staff who help us in the field for collecting samples during the research.
References
[1] Hallegraef G M, Anderson D M, and Cembella A D 2003 UNESCO, Paris France 25-50
[2] Anderson D M 2008 Harmful Algae 8: 39-53
[3] Maso M and Garces E 2006 Marine Pollution Bulletin 53: 620-630
[4] Gilbert P M. Seitzinger S, Heil C A, Burkholder H M, Parrow M W, Codispoti L A, Kelly V 2005
Oceanography 18(2): 198–209
7International Symposium on Aquatic Sciences and Resources Management IOP Publishing
IOP Conf. Series: Earth and Environmental Science 744 (2021) 012077 doi:10.1088/1755-1315/744/1/012077
[5] Smayda TJ 1997 Limnol. Oceanogr. 42: 1 137-1 153
[6] Zingone A, Siano R, D'Alelio D, and Sarno D 2006 Harmful Algae 5: 321-337
[7] Berdalet E, Tester P, Zingone A 2012 GEOHAB IOC of UNESCO and SCOR Paris pp. 64
[8] Sarkar S K 2018 Marine Algal Bloom Springer Nature Singapore Pte Ltd. 170pp
[9] Anderson D M, Glibert P M, Burkholder J M 2002 Estuaries 25: 562-584
[10] Wells M L, Trainer V L, Smayda T J, Karlson B S O, Trick CG, Kudela R M, Ishikawa A, Bernard
S, Wulff A, Anderson D M, Cochlan W A 2015 Harmful Algae 49: 68-93
[11] Leuwitus A J, Horner R A, Caron D A, Garcia-Mendoza E, Hickey B M, Hunter M, Huppert D
D, Kudela R M, Langlois G W, Largier J L 2012 Harmful algae 19: 133-159
[12] Glibert P M, Allen J I, Bouwman L, Brown C, Flynn K J, Lewitus A, Madden C 2010 J. Mar.
Systems 83: 262-275
[13] Heisler J, Glibert P, Burkholder J, Anderson D, Cochlan W, Dennison W, Gobler C, Dortch Q,
Heil C, Humphries E, Lewitus A, Magnien R, Marshall H, Sellner K, Stockwell D, Stoecker
D, Suddleson M 2008 Harmful Algae 8: 3-13
[14] Sidabutar T 2008 RCO Indonesian Institute of Sciences (Jakarta) p 24
[15] Anderson D M, Gilbert P M and Burkholder J M 2002 Estuaries. 25: 704-726
[16] Anderson D M 2008 Harmful Algae 8: 39-53
[17] Hallegraef G M, Anderson D M, and Cembella A D 2003 UNESCO (Paris France) p 540
[18] Anderson D M 1984 American Chemical Society (Washington DC) p 125-138
[19] Wouthuyzen S, Tan C K, Ishizaka J, Hoang Son T P, Varis R, Tarigan S, and Sediadi A 2007
Proceed. Sym of ALOS Data Model. Sci. Prog. in Kyoto
[20] Sidabutar T 2004 Preliminary report, Research Centre for Oceanography-LIPI, Jakarta
[21] Sournia A 1978 Phytoplankton Manual UNESCO, Paris
[22] Karlson B, Cusack C, Bresnan E 2010 IOC Manuals and Guides (55) UNESCO
[23] Michael P 1995 Ecol. Meth. Field-Lab. Invest. McGraw-Hill P.C. Limited
[24] Newell G E and Newell R C 1977 A Practical Guide (Anchor Press, London)
[25] Yamaji I 1966 Marine Plankton of Japan (Hakusho. Osaka, Japan)
[26] Thomas C R. 1933 Marine phytoplankton (Academic Press, Inc. San Diego) 262pp
[27] Parson T R, Maita Y, and Lalli C M 1984 Manual seawater analysis (Pergamon Press, Canada)
[28] Qiu D, Huang L, Zhang J, Lin S, 2010 Continental Shelf Research 30: 177-186
[29] Anderson D M 2007 The Ecology and Oceanography of HABs Multidisciplinary Approaches to
Research and Management UNESCO
[30] Kudela R M, Seeyave S, Cochlan W P 2010 Progress in Oceanography 85: 122-135
[31] Leuwitus A J, Horner R A, Caron D A, Garcia-Mendoza E, Hickey B M, Hunter M, Huppert D
D, Kudela R M, Langlois G W, Largier J L 2012 Harmful algae 19: 133-159
[32] Anderson D M 2007 The Ecology and Oceanography of Harmful Algal Blooms Multidisciplinary
Approaches to Research and Management. UNESCO
[33] Karlson B, Cusack C, Bresnan E (eds) 2010 IOC-Manuals and Guides (55). UNESCO
[34] Glibert P M, Burkholder J M 2011 Chinese Jour. of Ocean. and Limn. 29: 724-738
8You can also read