Communications and media in Australia - Trends and developments in telecommunications 2020-21
←
→
Page content transcription
If your browser does not render page correctly, please read the page content below
Communications
and media in Australia
Trends and developments
in telecommunications 2020–21
December 2021

                                acma.gov.au/research
Canberra
Red Building
Benjamin Offices
Chan Street
Belconnen ACT
PO Box 78
Belconnen ACT 2616
T +61 2 6219 5555
Melbourne
Level 32
Melbourne Central Tower
360 Elizabeth Street
Melbourne VIC
PO Box 13112
Law Courts
Melbourne VIC 8010
T +61 3 9963 6800
Sydney
Level 5
The Bay Centre
65 Pirrama Road
Pyrmont NSW
PO Box Q500
Queen Victoria Building
NSW 1230
T +61 2 9334 7700

Copyright notice

https://creativecommons.org/licenses/by/4.0/

With the exception of coats of arms, logos, emblems, images, other third-party material or devices protected by a trademark, this
content is made available under the terms of the Creative Commons Attribution 4.0 International (CC BY 4.0) licence.

We request attribution as © Commonwealth of Australia (Australian Communications and Media Authority) 2021.

All other rights are reserved.

The Australian Communications and Media Authority has undertaken reasonable enquiries to identify material owned by third
parties and secure permission for its reproduction. Permission may need to be obtained from third parties to re-use their material.

Written enquiries may be sent to:

Manager, Editorial Services
PO Box 13112
Law Courts
Melbourne VIC 8010
Email: info@acma.gov.au

Contents
Introduction 1
Executive summary 3
Wired telecommunications at a glance 4
Wired telecommunications 5
National Broadband Network 5
Legacy fixed networks 8
Fibre 10
Submarine cables 11
Wireless telecommunications at a glance 12
Wireless telecommunications 13
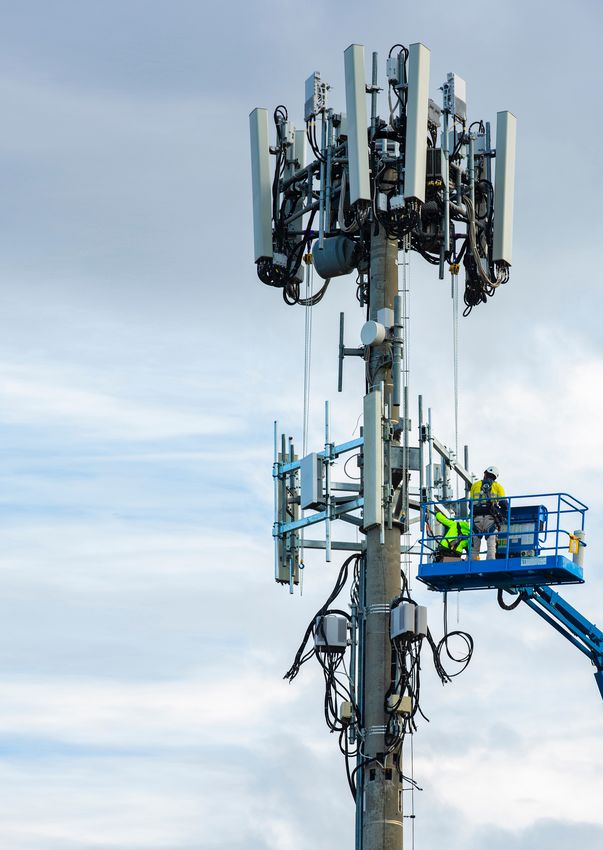
Australia’s mobile networks 13
Mobile spectrum 14
Developments in 2020–21 14
Wireless broadband (mobile and fixed) 15
Satellite services 16
Access to communications services at a glance 18
How Australians access communication services 19
Data traffic is at an all-time high 19
Fixed broadband carries the majority of download traffic 19
Australians’ online activities in 2021 19
Spotlight: Online shopping 20
How Australians connected to the internet in 2020–21 21
Mobile phone is the dominant voice communication device 22
Smart devices are taking off 22
Spotlight: Cybercrime – the dark side of the internet 22
Consumer satisfaction with telecommunications services 23
Market performance 24
Revenue 24
Market activity 25
Future outlook 25
Glossary 26
Notes 29
iiiIntroduction
The purpose of the Australian Communications developments in the provision, take-up and
and Media Authority (ACMA) is to maximise use of telecommunications infrastructure and
the economic and social benefits of services, and considers drivers that underpin
communications infrastructure, services and and shape the adoption of technology.
content for all Australia. We do this by:
This report fulfills multiple legislative obligations
>> maintaining, enforcing and improving
under the Australian Communications and
regulation to drive industry performance
Media Authority Act 2005. These include
and protect consumers
requirements to:
> managing public resources to enable
> report to and advise the Minister of
industry to deliver existing and new services
Communications, Urban Infrastructure,
> understanding the changing Cities and the Arts in relation to the
communications sector to inform telecommunications industry
decision-making.
> make available to the public information
about matters relating to the
The Communications in Australia: Trends
telecommunications industry
and developments in telecommunications
2020–21 report provides an overview of the > inform ourselves and advise the minister
Australian telecommunications sector during on technological advances and service
the 2020–21 financial year. Drawing on a trends in the broadcasting, internet and
combination of industry data and primary datacasting industries.
consumer research, the report describes key
Communications and media in Australia: Trends and developments in telecommunications 2020–21 1Executive summary
Telecommunications services have become The telecommunications sector is showing
more important than ever during the positive signs of recovery, spurred on by
COVID-19 pandemic. business transformation, consumer take-up
and economic activity.
Ongoing restrictions such as lockdowns
and social distancing have prevented many Overall consumer use of communication
Australians from seeing one another, with services has increased over the year, with
virtual channels such as instant messaging, as the effects of the pandemic continuing to
well as phone and video calls becoming the encourage a shift towards online services.
primary means of communication. Remote For example, online shopping has grown
working and education have also become considerably, with over a million more
commonplace over the pandemic period, with Australians shopping online this year, and
around 2 in 3 full-time employed Australian online retail trade now accounting for over 10%
adults reporting working from home in the 6 of total retail sales. 2021 saw data traffic at an
months to June 2021.1 all-time high, with data-thirsty activities such
as video streaming and remote working on
The shift towards digital communications the rise. Many Australians sought to increase
through this time has resulted in their internet speed and upgrade to unlimited
unprecedented reliance on wired data plans.
telecommunications, which includes fixed-line
internet connections such as fibre-to-the- Despite the increasing demand for
home or fibre-to-the-node. At the same time, telecommunications, Australia’s 3 largest
increasing use has seen pressure on network telcos, Telstra, Optus and TPG Telecom, have
infrastructure. The completion of the National seen revenue declines associated with the
Broadband Network’s (NBN) rollout at the end COVID-19 pandemic.2 This has been driven
of 2020 has done much to increase access to by a combination of factors, including a loss
fast and reliable internet for all, connecting over of mobile revenue from lower international
8 million homes and businesses. However, roaming charges, weaker demand for
network outages are more likely to be felt, handsets, and the ongoing migration to
and the ability to maintain both reasonable NBN services.
network uptime and connectivity has become
increasingly difficult. Some businesses have Many telcos are embarking on multi-year
invested in alternative services such as dark company transformations aimed at addressing
fibre to gain greater control over their networks. challenges and positioning for future growth.
Despite the ongoing challenges, overall They are increasingly looking for 5G, expansion
network satisfaction has remained stable, with in the enterprise market (such as dark fibre)
the major operators so far appearing to meet and adoption of new services such as edge/
the challenges of maintaining their networks cloud computing to drive revenue growth.
under heavier loads.
Wireless services have become increasingly
popular over the pandemic period, with almost
all Australians now owning some form of
mobile device, and internet-enabled ‘smart’
devices are prevalent in nearly all Australian
households. Telcos offering mobile services
continue to upgrade their networks, expanding
their 4G services and continuing to roll out 5G
networks. Telcos have also expanded fixed
wireless offerings over the year, using 5G to
significantly enhance these services, making
them comparable to higher speed NBN
connections. Low earth orbit (LEO) satellite
services have also started to enter the market,
with SpaceX’s Starlink offering broadband
services delivered via LEO satellite services for
Australian consumers.
Communications and media in Australia: Trends and developments in telecommunications 2020–21 3Wired telecommunications at a glance
We downloaded 9.8 million
Over 9 in 10 of us had terabytes over the 3 months
access to fixed-line internet to June 2021
17% of NBN connections There were 8.2 million
were 100 Mbps or higher active NBN services
(up from 10% in 2020) (up from 7.4 million in 2020)
4.7% 3.5% 4.1%
4.8% 9.7%
7.2% Telstra 20.7%
TPG Telecom
15.6% Optus
44.9% Vocus 18.6%
Aussie Broadband
Other
42.8%
24.2%
Telstra had the highest TPG Telecom had the
number of NBN highest number of 100+
subscribers Mbps NBN subscribers
There were just under
Less than 1 in 4 of us used 15,000 public payphones
a fixed-line phone at home across Australia
14 submarine fibre cables connected Australia
with the rest of the world
4 Communications and media in Australia: Trends and developments in telecommunications 2020–21Wired telecommunications
The fixed telecommunications industry The increased take-up of higher-tier services
is an important part of Australia’s has resulted in greater average speeds across
telecommunications environment and is the network (Figure 1), with fixed-line services
responsible for most data transmissions sent reporting network-wide average download
across the country and internationally. Wired speeds of almost 80 Mbps in June 2021
telecommunications cover a variety of different (Figure 2).7
fixed-line technologies, ranging from legacy
copper wire connections to more modern National data consumption also continued
technology such as fibre optics. The COVID-19 to rise, with 8.2 million terabytes of data
pandemic has reinforced the importance of downloaded across the NBN in the June
home-based internet services, with lockdowns quarter of 2021.8
and border closures necessitating a reliance
on fixed-line internet services for everyday Figure 1: NBN speed tier mix, FY2018,
activities such as work and study. FY2021, Mbps (%)
100+ 12
National Broadband Network Mbps
12
100+
Mbps Mbps
10% 12%
Mbps 17%
The National Broadband Network (NBN), 28% 25
Mbps
maintained by NBN Co Limited (NBN Co),
is the primary wholesale network for
50
Mbps
FY18 FY21 14%
carrying Australia’s fixed-line voice and 35%
data services. 25
Mbps 50
27% Mbps
57%
The NBN was designed to replace Australia’s
former fixed telecommunications networks
Source: NBN Co.
and ensure that Australians can easily and
fairly participate in the digital economy.
Figure 2: Average fixed-line connection speed, Mbps (%)
On 23 December 2020, the Minister for
Communications, Urban Infrastructure, 80
Cities and the Arts formally announced that
the NBN should be treated as built and
fully operational.3
52
Over 12 million homes and businesses are 39
now ready to connect on the NBN, with 31
8.2 million services connected as of June 24 24
21
2021.4 This includes nearly 800,000 new 16
8 11
connections, allowing more Australians access
to superfast broadband.5
Jun-17 Jun-18 Jun-19 Jun-20 Jun-21
Internet speeds
Download Upload
Expanded access to the NBN combined
with increased demand for higher-tier Source: Speedtest.org
services has contributed to faster internet
speeds across Australia.
This has been further supported by measures
introduced by NBN Co in October 2020
supporting telcos to manage higher data
volumes and encouraging more users to
upgrade to higher-tier plans.6
Communications and media in Australia: Trends and developments in telecommunications 2020–21 5Technology mix
Figure 3: NBN connections by technology type (%)
Despite the NBN being formally announced
as completed, the process of switching
Fixed Satellite
consumers over to the network is ongoing, with Fibre-to-the-
wireless 1%
around 1 in 3 connections yet to be activated.9 premises
Hybrid 4%
(FTTP)
NBN uses a range of technologies to provide fibre 19%
services to consumers. Fibre-to-the-node coaxial Fibre-to-
(HFC) 23% the-
(FTTN) remains the most common type of NBN 3% building
connection, with almost 30% of total NBN June
(FTTB)
connections classified as FTTN as of June 2021 2021
(Figure 3).
13%
Fibre-to-the-curb (FTTC) has been a relatively Fibre-to-
37%
recent NBN offering, first emerging in the 2018 the-curb
financial year as an alternative to FTTN. FTTC (FTTC) Fibre-to-
provides numerous performance benefits over the-node
(FTTN)
FTTN connections, shortening the distance
between a home connection and an NBN hub,
Source: ACCC, NBN Wholesale Market Indicators report
and increasing speed and reliability.10 June Qtr 2021.
75% of homes are expected to have access
to 500 Mpbs internet plans or higher by 2023.
As part of its 2021 corporate plan, NBN
Co announced further investment in the
capabilities of the network11, with the intent
of having 75% of homes on the network able
to access services over 500 Mbps by 2023.
In addition, some FTTN connections will be
eligible for a fibre-to-the-premises (FTTP)
upgrade if they subscribe to a 100 Mbps or
faster plan.
6 Communications and media in Australia: Trends and developments in telecommunications 2020–21NBN market share Figure 4: NBN subscription share (millions)
While NBN provides fibre services to 3.76
Australians, it does not do so directly. Retail 3.45
service providers (RSPs) are responsible for
setting up the final link between consumers
and the NBN. RSPs are required to have a 2.03
1.66
carriage service provider (CSP) licence to
1.291.31
legally provide services to consumers.
0.54 0.6
Telstra was the dominant NBN retail service 0.260.39 0.240.29
provider in 2021, with over 3.7 million
subscriptions or approximately 45% of total Telstra TPG Optus Vocus Aussie Other
Telecom Broadband
subscribers (Figure 4). Telstra has been the 2020 2021
market leader for broadband services for
many years. However, additional incentives
Source: ACCC, NBN Wholesale Market Indicators report.
to upgrade service plans to higher speeds
and the increased internet needs of end-
Figure 5: NBN 100+ Mbps subscription share (millions)
users during the COVID-19 pandemic have
significantly increased competition, particularly
in the 100+ Mbps market. 0.62
In June 2021, TPG Telecom was the dominant
operator in the 100+ Mbps market, with
approximately 43% of the high-speed market 0.3
0.25 0.27
(Figure 5).
0.16 0.14
0.11 0.09
0.07
45% of total NBN subscribers use Telstra 0.04 0.040.06
as a retail service provider. However, 43%
of total 100+ Mbps NBN subscribers use Telstra TPG Optus Vocus Aussie Other
TPG Telecom. Telecom Broadband
2020 2021
Source: ACCC, NBN Wholesale Market Indicators report.
Communications and media in Australia: Trends and developments in telecommunications 2020–21 7Legacy fixed networks Figure 6: Household services in operation –
NBN compared to DSL (millions)
While the NBN rollout has incorporated both
the former copper and hybrid fibre-coaxial 8.38
(HFC) fixed-line networks, these older networks
currently remain in operation for some
Australians. For regional and remote Australia, 5.48
which is reliant on alternate technologies such
as satellite and fixed wireless infrastructure,
copper services will remain the primary fixed-
line service.12
0.5
0.37
The NBN rollout has slowly phased out older
connection types, with fewer than 400,000
household digital subscriber line (DSL) Jun-15 Dec-16 Jun-18 Dec-19 Jun-21
connections in operation as of June 2021
(Figure 6).13 DSL
DSLConnections
connections NBN
NBNConnections
connections
Telstra operates and maintains Australia’s Source: ACCC, NBN Wholesale Market Indicators report.
copper telecommunications network but has
progressively sold portions of its network to Figure 7: Businesses with a fixed-line
NBN Co. This is part of an ongoing agreement internet connection by year (%)
for NBN Co to acquire portions of Telstra’s
copper network to service FTTN and FTTC
48
NBN connections. Since September 2007, 46
41
Australia’s copper network connections have
fallen nearly 90%.14 33
23
Businesses have been slower to connect to 17
the NBN than consumers. Two in 5 (41%) 12 11
8
businesses reported still having an ADSL
connection as of June 2020 (Figure 7)15,
compared to 7% of Australian adults with an
2017–18 2018–19 2019–20
ADSL connection at home.16
xDSL* Fibre Cable
The remainder of the network still under the
control of Telstra is bound by obligations * xDSL includes all variants of DSL connections including
outlined under the Universal Service Guarantee symmetric DSL (SDSL), asymmetric DSL (ADSL) and other
(USG) until 2032. This includes: variants. Fibre includes NBN connections and dark fibre.
Source: Australian Bureau of Statistics. Cat 8176.0 –
>> guaranteed access to a fixed-line voice Characteristics of Australian Business.
service upon reasonable request
>> connection and repair requests met within a
reasonable timeframe
>> priority assistance for people with life-
threatening medical conditions
>> reasonable access to payphones.17
8 Communications and media in Australia: Trends and developments in telecommunications 2020–21Fixed-line voice services Figure 8: Fixed-line voice market share: analog (%)
Analyst firm GlobalData has reported that in
2020, there were 9.5 million fixed-line phone
services in Australia, 71% of which were voice 19%
over internet protocol (VoIP) services.18 Telstra
remained the dominant provider of fixed-line Telstra
services, accounting for over three-quarters of 3%
1% Optus
the analog market (Figure 8), and 2 in 5 VoIP
services (Figure 9).
2020
TPG Telecom
Australians continue to abandon fixed-line Others
home phones. Only a quarter of adults (24%) 77%
made fixed-line home phone calls in 2021 –
a sharp fall from 40% in 2020. ACMA 2019
telco consumer experience research shows Note: Data is for calendar year: 1 January to 31 December
that while 6 in 10 (59%) Australian households 2020.
had a home fixed-line voice service, only 44% Source: GlobalData.
had a home phone that they used, and 15%
Figure 9: Fixed-line voice market share: VoIP (%)
had a home phone service connected but not
in use.19
13%
Payphones
Under the USG, Telstra is responsible for Telstra
7%
ensuring reasonable access to a working
payphone for all Australians on an equitable 42% Optus
basis, regardless of where they live or work.
2020 TPG Telecom
Over 11 million calls are made each year from 24% Vocus
payphones, a number that has been steadily
Others
declining with the widespread adoption
of mobile phones.20 Even so, payphones 14%
provide a key back-up service to Australians
who are unable to access an alternative
Note: Data is for calendar year: 1 January to 31 December
communications service. They remain 2020.
particularly important during emergencies Source: GlobalData.
and in regional areas where mobile phone
coverage may not be available. In March Figure 10: Payphones in Australia by state
2021, for example, Telstra provided free calls and territory
and wireless internet from payphones to
communities affected by severe storms and
major flooding in New South Wales.21
However, the number of public payphones
607
in Australia continues to decrease. At 30
June 2021, there were 14,956 public Telstra 3,600
payphones, 539 fewer than 30 June 2019.22
1,599
Figure 10 provides a breakdown of Telstra
payphones by state and territory.
1,322
Free calls from Telstra payphones 4,427
In August 2021, Telstra announced that texts,
and local and national calls made from public 100
payphones to Australian numbers would Payphones in Australia = 14,956 2,837
be free.23
By October 2021, Telstra public phones no 464
longer accepted coins, as the emptying and
repair of coin collection mechanisms was Source: Telstra payphone register.
costing more than the call costs.
Communications and media in Australia: Trends and developments in telecommunications 2020–21 9Fibre However, any business that leases a dark fibre
network may be subject to regulations if they
While the NBN, along with legacy copper
allow other businesses access to their leased
and HFC networks, makes up the majority of
dark fibre network.25
Australia’s fixed communication network, other
fibre-optics operations, such as dark fibre and
Businesses providing dark fibre services
submarine cables, also play an important role
include major telecom operators such as
in transmitting voice and data services, both
Telstra InfraCo, TPG Telecom and Vocus, as
here and overseas.
well as smaller operators such as Superloop
and 5G Networks.26 Demand for dark fibre
Dark fibre
is predicted to increase, with Telstra InfraCo
Dark fibre is a cover-all term for fibre expanding its dark fibre footprint by 25% in the
networks that have been constructed but 5 months to June 2021.27
are not currently active.
While NBN Co is the primary wholesaler for
retail services, other network providers may
build and market wholesale fibre services
for business purposes. Dark fibre services
allow businesses to have a dedicated fibre
connection between points that is not shared
between other users, offering greater security,
privacy and faster performance (Figure 11).
Any business leasing dark fibre is responsible
for maintaining an operable network, including
any necessary equipment and staff. These
requirements make dark fibre networks
expensive to operate and are typically only
used by entities with specific needs, such
as government organisations and large
commercial enterprises. Dark fibre is not
regulated as a transmission service as it does
not come with the components necessary to
operate a network.24
Figure 11: How dark fibre works – managed services
Typical managed service
Location A Carrier network Location B
Carrier Carrier
switch switch
Customer Customer
switch switch
Dark fibre service
Location A Location B
Dark fibre is a single-mode
optical fibre that runs from
end to end with no active
equipment in between
Customer Customer
switch switch
10 Communications and media in Australia: Trends and developments in telecommunications 2020–21Submarine cables Businesses seeking to explore and extract
resources in a protection zone must
Submarine cables are a vital part of
consult with cable owners before beginning
Australia’s fixed-line communications
operations.
infrastructure, carrying vast amounts of
voice and data traffic both interstate and At the end of June 2021, there were 14
internationally. submarine cables connecting Australia with
the rest of the world (Figure 12). In addition,
Without these cables, the existing level of 3 further cables were under construction:
global interconnectivity would not be available
>> Southern Cross NEXT cable (SCN), due for
in Australia. Both wired networks, such as
completion by January 2022, will connect
the NBN, and most wireless networks, such
Australia to New Zealand, Fiji, Samoa,
as mobile networks, connect into these
Tokelau, Kiribati and California.28
submarine cables to send data internationally.
The exception to this is satellite networks, > Sub.CO is building the Oman Australia
which can independently transmit data across Cable (OAC) from Perth to Muscat, Oman.
the globe. Due for completion by mid-2022, it will be
the only express cable connecting Australia
The ACMA has numerous responsibilities to the Middle East region.29
in relation to submarine cables, including
>> Vocus Communications was building
issuing submarine cable installation permits,
Darwin–Jakarta–Singapore Cable (DJSC),
and declaring protection zones to prohibit or
linking the Australia–Singapore Cable (ASC)
restrict potentially damaging activities near
to the Northwest Cable System (NCWS)
cable installations. Information about which
in Port Hedland. This was completed in
activities are restricted or prohibited in each of
August 2021.30
the 3 declared protection zones, is available on
our website.
Figure 12: Australia region international submarine cables, 2020–21
Pipe Pacific Cable 1 (PPC1)
Australia-Japan-Cable (AJC) AJC lands at NSPZ
To Guam
To Guam and Japan and SSPZ
Singapore
Japan-Guam-Australia (JGA)
To Guam and Japan
Madang
Indonesia
SEAMEWE3 lands at Ancol Honiara ai
i
aw
Indigo West lands at Jakarta
ASC lands at Anyer H
Port Moresby o
-T
Christmas Island ur Pago Pago
vo
dea
APNG-2 Coral Sea
En
Australia Singapore Cable (ASC)
Cable System
(CS2)
Suva
SEAMEWE3
Indigo West
S
Noumea e
U
S th
U nd
Gondwana-1
Sunshine Coast e ia
Branch Cable d
th th ai
n ou S
aw
ia -S eU
H
ai o
aw -T ss th
Sunshine ki ro
o
H
ai C nd
Coast -T a w e rn aii a
th H h
or ut aw
-N So o H
T
Perth ss
Sydney C
ro
n
NSPZ
h er
AJC
ut Mangawhai
SSPZ CS2 So
Takapuna
Whenuapai
Southern Cross - South
Raglan
Tasman Global Access (TGA)*
APNG-2 - Australia Papua New Guinea 2
SEAMEWE3 - South East Asia Middle East Western Europe 3
NWSC - North West Shelf Cable TGA lands at NSPZ
Cable completed as of June 2021
NSPZ - North Sydney Protection Zone
SSPZ - South Sydney Protection Zone Landing station
Source: cable data: ACMA; map data: snazzy.com.
Communications and media in Australia: Trends and developments in telecommunications 2020–21 11Wireless telecommunications at a glance
4G mobile networks 5G mobile networks
covered 99.5% of the covered 75% of the
Australian population Australian population
The Mobile Black Spot The number of mobile
Program resulted in the subscriptions dropped,
construction of over 1,200 largely due to fewer
new mobile base stations international roaming
across Australia subscribers
Telcos spent over $500 million on
26 GHz mmWave spectrum
Over 1,200 functional space objects were registered last year,
a more than threefold increase from 2019.
Low-earth orbit (LEO) satellite services started to be offered
in Austraia.
The United States Federal Communications Commission
(FCC) has so far approved over 15,000 LEO satellites.
12 Communications and media in Australia: Trends and developments in telecommunications 2020–21Wireless telecommunications
Wireless telecommunications are a vital Figure 13: Mobile market share (%)
part of the Australian communications
landscape.
Other
9.7%
Mobile phones have largely supplanted fixed-
line communications for voice-only services TPG
(excluding internet-based communications). 15.3%
Although the COVID-19 pandemic has FY Telstra
been a significant catalyst for change in
the telecommunications market, mobile 2021 48.7%
phones remain the primary way Australians
stay connected. Optus
26.3%
Australia’s mobile networks
Australia’s 3 major mobile network operators
(MNOs) – Telstra, Optus and TPG Telecom Source: IBISWorld, J5802 Wireless Telecommunications in
– own and operate mobile network Australia.
infrastructure, offering services, both direct
to consumers and via resellers. Telstra is the Figure 14: Mobile voice and broadband
largest provider of mobile services, with 48.7% services in operation by product
market share, followed by Optus (26.3%) and category (millions)
TPG Telecom (15.3%) (Figure 13).
Mobile virtual network operators (MVNOs)
provide just under one in 10 mobile services 10.4 9.8 9.4 9.4
in Australia. MVNOs provide services to
customers by paying MNOs to use a portion
of their networks. MVNOs often differentiate Prepaid
themselves from MNOs by offering lower mobile
prices or larger data allowances than
Postpaid
MNOs, however, are bound by wholesale 17.6 17.6 17.6 17.6 mobile
contracts that give them weaker guarantees
of quality and stability due to their lack of Mobile
network control.31 broadband
There are also other businesses that own 4.8 4.8 4.7 4.6
mobile infrastructure but do not sell mobile
services to consumers. Those businesses Dec-19 Jun-20 Dec-20 Jun-21
lease towers to telcos to supplement their
mobile networks. Source: ACCC, Internet Activity RKR data 30 June 2021,
December 2021
In December 2020, there were over 30 million
mobile services in operation (Figure 14).
Communications and media in Australia: Trends and developments in telecommunications 2020–21 13Mobile spectrum Developments in 2020–21
The ACMA has an extensive work program to Continuing investment in mobile networks
support making spectrum available for mobile
All 3 mobile carriers are progessively reducing
broadband and other uses.
3G services while expanding network and
service offerings on 4G and 5G networks. All 3
5G millimetre wave spectrum in the 26 GHz
carriers are continuing to offer 3G services using
and 28 GHz bands was also allocated under a
lower frequency spectrum in the interim, with
new flexible licensing arrangement – the area
Telstra’s 3G network slated for closure in 2024.
wide licence. Successful applicants included
existing and new service providers entering the
Five companies won spectrum in the ACMA’s
Australian market to provide fixed wireless and
2021 26 GHz band auction, including Australia’s
fixed satellite services. The ACMA has allocated
major telcos. Both Telstra and Optus announced
around 80 licences.
that they had multiple mmWave (millimetre
waves; short-range, high-frequency network
3G mobile networks
technology) sites in major cities on the eastern
3G is the oldest form of mobile technology still seaboard of Australia, while TPG Telecom
in service in Australia. In the process of being flagged plans to launch a superfast 5G service
phased out by MNOs, 3G is still used to provide using mmWave spectrum in the near future.35
services to some remote and regional areas, Pentanet and Dense Air were also awarded
with 0.3% of the Australian population receiving spectrum in this allocation.
3G-only mobile coverage.32
Mobile Black Spot Program
4G mobile networks
While Australia’s mobile 4G coverage reaches
4G is the most common form of mobile network over 99% of the population, some regional,
across Australia. Most Australians using mobile rural and remote areas have sparse or no
networks, particularly in metropolitan areas, are mobile access. The Australian Government has
connected to a 4G network. In June 2021, 4G committed $380 million toward improving mobile
reached 99.5% of the Australian population.33 coverage and competition across regional areas
through its Mobile Black Spot Program.
5G mobile networks
To date, the program has generated a total
The latest iteration of broadband mobile
investment of more than $875 million, to deliver
technology, 5G uses high-frequency radio
more than 1,270 new mobile base stations
spectrum to provide faster data speeds and
across Australia.36 In July 2021, 67 new planned
lower latency than previous 4G and 3G
sites were announced, including:
technologies. 5G networks are still being rolled
out by the major mobile network operators. As at > 48 from Telstra
June 2021, the 5G network covered 75% of the
> 4 from Optus
Australian population, with over 2 million 5G
connections.34 >> 15 from Field Solutions Group.37
In addition, 3 trials will be conducted to test
ways mobile network operators can roll out
shared infrastructure to reduce cost and provide
new coverage for more than one carrier.38
14 Communications and media in Australia: Trends and developments in telecommunications 2020–21Tower asset divestment Fixed wireless services are offered by a
variety of telcos, as well as NBN Co. Fixed
Australia's major telcos have chosen to either
wireless services form an important part of the
begin, or consider, divesting their tower
broadband delivery in areas where installing
assets. Telstra announced in June 2021
fibre is impractical or cost prohibitive, typically
that it would sell a 49% stake in its towers
in rural and regional zones. In other areas, fixed
business to a consortium comprising the
wireless services offered by other telcos are an
Future Fund, Commonwealth Superannuation
alternative to NBN services.
Corporation and Sunsuper, renaming the new
entity Amplitel.39 Optus announced that it had
With 4G the most common fixed wireless
entered an agreement to sell a 70% stake in
technology, the quality and speed of fixed
Australian Tower Network (a wholly-owned
wireless connections are mostly less reliable
subsidiary) to AustralianSuper.40 TPG Telecom
than fixed-line internet services, especially
is reportedly undergoing a strategic review of
during periods of high demand. However,
its infrastructure assets.41
with the ongoing rollout of superfast 5G
infrastructure, fixed wireless providers are
The emergence of budget brands
touting the service as a viable alternative to
All 3 mobile operators now have brands that fixed broadband in metropolitan areas.
target the ‘lower’ end of the market, such
as Belong (Telstra). GOMO (Optus) and Felix There were over 350,000 fixed wireless
(TPG Telecom). services in operation in June 2021, with Telstra
the dominant retail provider (Figure 15).
The budget brands provide an avenue for
telcos to compete against the MVNOs, while Figure 15: NBN fixed wireless market share (%)
offering opportunities for customers to upgrade
to the premium services that Telstra, Optus 6 5 6 6
and Vodafone offer. 11 10 10 8 Other
5 5 6 8
Optus acquired MVNO amaysim in February Optus
2021 for $250 million, further expanding its 10 10 9 10
presence in the budget mobile market.42
Aussie
15 14 14 14 Broadband
Wireless broadband (mobile and Vocus
fixed)
In Australia, spectrum supports multiple TPG
categories of wireless broadband use
and deployments in practice may reflect 55 55 55 53 Telstra
combinations of these categories.
One category of wireless broadband service
is the wide-area subscriber network, with an
extensive base station infrastructure serving
2018
Jun-18 2019
Jun-19 2020
Jun-20 2021
Jun-21
large geographic areas. This category is
characterised by telecommunication carrier
Source: ACCC, NBN wholesale market indicators report,
mobile broadband operations. June 2021.
Fixed wireless access and private mobile
networks, often serving smaller, localised areas,
are another category. Services provided by
wireless internet service providers (WISPs) are
a good example of this type of small and
medium enterprise (SME) that often provide
these services.
Communications and media in Australia: Trends and developments in telecommunications 2020–21 15Satellite services Low earth orbit satellites
Australia’s vast size means that even the New technology innovations have considerably
furthest reaching mobile communications shrunk satellite size and power compared to
networks are unable to reach all Australians. older models. Combined with falling launch
Satellite communications supplement mobile costs, this has created opportunities for
and fixed line communication services to satellite operators to develop low earth orbit
ensure that even the most remote locations (LEO) satellite constellations, an emerging
can be connected. trend in modern satellite communications. LEO
satellites differ from traditional geosynchronous
Satellite communications are experiencing a orbit (GEO) satellites in how they orbit the earth
significant period of technological innovation (see Figure 16). GEO satellites orbit at the
and disruption in the provision and delivery of same rotational speed as the earth, allowing
services. them to remain above the earth in the same
position at all times. In contrast, LEO satellites
We continue to engage internationally on the orbit much lower and do not remain in a fixed
coordination, development and implementation position. To resolve this issue, LEO satellites
of measures to enhance spectrum use for use an interlinked constellation of satellites to
satellite communications. provide services.
Figure 16: Satellite orbit characteristics
Geostationary orbit (GEO)
Altitude: 35,786 km Medium-earth orbit (MEO)
Orbital period: 24 hours Altitude: 2,000–35,786 km
Latency: 477 ms Orbital period: 2–24 hours
Cost: US$100–$400 million per satellite Latency: 27–477 ms
Cost: US$80–$100 million per satellite
Low-earth orbit (LEO)
Altitude: 160–2,000 km
Orbital period: 88–127 mins
Latency: 2–27 ms
Cost: US$0.5–$45 million per satellite
Source: Digital Connectivity and Low Earth Orbit Satellite Constellations: Opportunities for Asia and the Pacific
(SDWP No. 76) (adb.org)
16 Communications and media in Australia: Trends and developments in telecommunications 2020–21The primary advantage of LEO satellites Figure 17: Number of registered functional
is latency, as they are closer to the earth space objects, by year
(160–2,000 km) than geostationary satellites
(approximately 36,000 km). Ground stations 1,260
for LEO satellite networks are also cheaper
to operate.
There are a number of emerging LEO satellite
services on the horizon. Most LEO satellite 357
services are still in the construction phase, with 229
only SpaceX’s Starlink commercially available
in a limited capacity to Australians.43
2018 2019 2020
The ACMA observes proposed LEO
constellations have been generally growing in Note: Functional space objects include satellites, probes,
number, with several start-up ventures in the crewed spacecraft and space station flight elements.
Source: United Nations Office of Outer Space Affairs
process of obtaining regulatory approvals to Annual Reports.
operate on a global scale (for example, Starlink
via its parent Space Exploration Technologies
(SpaceX)). Most of these providers are seeking
to provide high-speed internet to parts of the
world where traditional broadband is too costly
to provide.
These businesses are largely being led by
either consortia or technology companies. It is
too early at this stage to tell which provider will
emerge as successful, with announcements
being released on a weekly, or in some cases
daily, basis. Due to the COVID-19 pandemic
and the significant capital costs involved in
launching satellites, some of these businesses
have had to restructure their finances or have
been taken over by investment consortia. The
more successful start-up businesses to date
are supported by either government entities,
multi-billion-dollar parent companies or billions
of dollars in venture capital.
Like any satellite, LEO satellites require
spectrum to communicate. Satellite systems
that provide communication services, such
as the other large non-geostationary satellite
orbit (NGSO) systems of today, operate as
fixed satellite services utilising Ku band and Ka
band. Due to directional antennas and different
orbital characteristics, it may be possible via
coordination for a number of satellite systems
to operate in the same spectrum.
For more information about recent
developments in satellite communications in
the Australian context, see the ACMA’s
Market study: Australian space sector.
Other information on licences and holders
is available on the ACMA's Register of
Radiocommunications Licences.
Communications and media in Australia: Trends and developments in telecommunications 2020–21 17Access to communications services at a glance
94% of us owned 7 in 10 of us had 8 in 10 of us had at
a smartphone a smart TV least one connected
smart device
9 in 10 of us used the internet on our mobile phone
45% of those who upgraded
61% of employed Australians their NBN plan did so to
worked online from home support working from home
8 in 10 NBN connections had an unlimited data
allowance in June 2021
92% of 90% of us 85% of us 74% of us
us banked watched bought goods listened to
online video content and services audio content
online online online
18 Communications and media in Australia: Trends and developments in telecommunications 2020–21How Australians access communication services
With social distancing and travel Figure 18: Australian data downloads by
restrictions in place across much of the connection type (%)
country, 2020–21 saw significant changes in
the way many Australians lived their lives. 10.8 9.9 9.8 10.7
8.8 6.0
13.8
Scores of us shifted to working or studying 19.7
from home, while businesses were forced to
innovate and adapt, or risk being left behind in
a rapidly changing commercial environment. Mobile
Non-NBN
The internet formed a crucial part of daily life 81.4 83.3
76.4 NBN
for most Australians in 2020–21. Since the 69.5
onset of COVID-19 pandemic restrictions in
early 2020, we’ve seen significant increases in
many online activities, with data consumption
rising accordingly.
Dec-19 Jun-20 Dec-20 Jun-21
Data traffic is at an all-time high Note: Satellite and fixed wireless downloads accounted for
0.1% of data traffic and are not shown.
Aligned with our increasing reliance on the Source: ACCC, Internet Activity RKR data 30 June 2021,
internet, 2020–21 saw considerable growth in December 2021.
data downloads (Figure 18). Total downloads
over 3 months rose by 20% in the year to Australians’ online activities in
June 2021, to 9.8 million terabytes.44 2021
With COVID-19 restrictions in force for much of
Fixed broadband carries the 2020–21, more Australians went online to do
majority of download traffic routine activities such as working, banking and
shopping (Figure 19).
While mobile phones remain the most popular
way to go online in Australia, fixed broadband
With data-thirsty activities such as video
infrastructure carries the majority of data-
streaming and remote working on the rise,
download traffic by a considerable margin.
many Australians sought to increase their
Nearly 90% of data downloaded in June 2021
internet speed in 2020–21. In June 2021, 80%
was via fixed broadband networks45, while
of NBN fixed retail services were provided with
mobile data carried around 10%. Satellite and
no data limit, an increase of 4% compared
wireless accounted for 0.1% of downloads.
with the same period last year.48 NBN reports
Over 9 in 10 (91%) Australians had a home
that among its users, 45% of plan upgrades
broadband connection in 202146, with the vast
in 2020–21 were to better support working
majority of services in operation (93%) now
from home.49
connected to the NBN.47
For many of us, working from home became a
hallmark of the COVID-19 lockdown. ACMA-
commissioned research in June 2021 found
that 45% of adult internet users worked online
from home in the first half of 2021, with those
in full-time employment most likely to work
from home.50
Online banking use rose significantly in the
2 years to 2021, to over 9 in 10 online adults
(92%) in the 6 months to June 2021 (from 86%
in 2019), a shift that will likely be maintained
well beyond the pandemic.
Communications and media in Australia: Trends and developments in telecommunications 2020–21 19The Australian Banking Association reports Online shopping also took off during the
that in 2021, more than 80% of Australians pandemic lockdowns, with 1.3 million
said they prefer to check account balances, Australians shopping online for the first time in
pay bills and transfer funds online, compared 2020. In the 6 months to June 2021, internet
to doing these functions in bank branches. users aged 65 and over, were the age group
Less than 20% indicated they preferred with the highest level of growth in online
attending a branch for any banking activity. 51 shopping, rising from 47% in 2019, to 69%
in 2021 (Figure 19).
Similarly, content streaming has boomed since
2019, with 90% of online adults having viewed
online video in the 6 months to June 2021
(from 83% in 2019). During this period, online
audio content access also increased to 74% of
online adults (from 65% in 2019).52
Figure 19: Activities performed online by internet users in the past 6 months (%)
Shopped online, by
age group 2021
18–44 = 91%
45–64 = 86%
65+ = 69%
98 98 Worked from home online,
94
89 92 89 90 by employment 2021
86 83 83 85 Employed = 61%
78 Full-time = 67%
74
69 Part-time = 51%
65
45
42
Not asked in 2019
Email Banking Watch videos Shopping Audio content Work from home
May-19 Jun-20 Jun-21
▼ Significantly different to prior year at the 95% confidence level.
See ACMA annual consumer survey questionnaire for full description of each category.
Base: Australians aged 18 and over who accessed the internet in the past 6 months: 2019 (n=1,991), 2020 (n=1,984), 2021 (n=3,549).
Source: ACMA annual consumer survey. QD8 Please indicate whether you have done any of the following in the past 6 months at home
or elsewhere.
Spotlight: Online shopping
With many retail premises closed due to Not surprisingly, those Australian states
COVID-19 restrictions, the popularity of that were placed under tougher restrictions
e-commerce substantially increased during during this period saw higher growth in online
2020–21. purchases, with Victoria’s online commerce
activity rising by 78% in 2020, while the ACT
More consumers and businesses engaged (49%) and New South Wales (46%) saw less
with online shopping services than ever before, dramatic increases.55
creating $48.6 billion in revenue in the year to
June 2021.53 The online share of total retail
spend grew by 16.3% in the year to June
2021, up from 11.3% in 2019.54
20 Communications and media in Australia: Trends and developments in telecommunications 2020–21How Australians connected to the Figure 20: Mobile phone ownership (%)
internet in 2020–21 5 4
11
Mobile phones are now used by almost all
Australian adults to communicate (99%), with
93% of online adults accessing the internet via
their mobile phone in the first half of 2021, up
Not a
from 87% in 2019. Smartphones are owned by smartphone
nearly every adult in Australia, providing easy 93 94
access to voice and internet services for most 83 Smartphone
of the population (Figures 20 and 21).
One driver for the rise in mobile phone internet
access may be the soaring popularity of
communication apps during the COVID-19
May-19
Jan-19 Jan-20
Jun-20 Jun-21
Jan-21
pandemic. Between 2019 and 2021, the
proportion of online Australian adults using ▼ Significantly different to prior year at the 95% confidence level.
Base: Australians aged 18 and over: 2019 (n=2,067), 2020 (n=2,009),
a message or calling app in the previous 2021 (n=3,586). Data may not sum to reported totals due to rounding. Don't
6 months to June, rose from 67% to 78%, know and refused responses not shown in chart.
with especially strong growth in use of apps for Source: ACMA annual consumer survey. QC1: Is your main mobile
phone a smartphone?
video calls (41% to 55%) and messaging (58%
to 72%).
Figure 21: Internet access device (%)
While sizeable proportions of online Australians
also connected to the internet via laptop 93
computers, televisions, tablets, and desktop Mobile phone 91
computers in the first half of 2021, usage 87
declined for most of these devices, reversing
73
the COVID-19 driven gains made in 2020.
Laptop 76
The only devices to show continued growth
in usage since pre-pandemic levels in 2019 69
were mobile phones, laptops and TVs (see 56
Figure 21).56 TV* 60
48
55 Jun-21
Tablet 61 Jun-20
56
May-19
44
Desktop PC 49
48
25
Digital media player 29
24
20
Gaming console 23
21
▼ Significantly different to prior year at the 95% confidence level.
Jun-21
* Includes smart Jun-20
and non-smart TVs. May-19
Base: Australians aged 18 and over who accessed the internet in the past
6 months: 2019 (n=1,991), 2020 (n=1,984), 2021 (n=3,549).
Source: ACMA annual consumer survey. QD5: Which of the following
devices have you used to access the internet in the past 6 months, for
personal purposes?
Communications and media in Australia: Trends and developments in telecommunications 2020–21 21Mobile phone is the dominant Smart devices are taking off
voice communication device Smart devices also grew in popularity in
In addition to the growing use of mobile Australian households in 2020–21, with 79% of
phones to connect to the internet, 2021 also adults reporting that they had a smart device
saw increasing use of mobile functionality for connected to the internet, up from 50% in
voice calls and texts.57 2019.58 During COVID-19 restrictions, more
than half (51%) of those Australians already
with connected smart devices invested in
98% used mobile voice calls
additional devices.59
(up from 94% in 2019)
Smart TVs were the most common internet-
accessible smart device in Australian
99% accessed the internet
households, with 7 in 10 (70%) reporting they
(up from 90% in 2019)
had a smart TV connected to the internet
(Figure 22).
Figure 22: Smart device take-up by Australian adults (%)
70
65
39
21 21
14 15
10 11 10 12
6 8 5 5
3 5 4 4 5 3 5 5 3
Smart TV Wearable Voice Security GPS tracking Smart lighting Security Heating or
devices (e.g. controlled cameras tag or device system cooling
FitBit) smart system
speakers
May-19
May 2019 June 2020
Jun-20 Jun-21
June 2021
▼Significantly different to prior year at the 95% confidence level.
Note: In 2020, the description of Smart TV was expanded to include additional details and may have contributed to an
increase. Comparisons with 2020 data should be made with caution.
Base: Australians aged 18 and over: 2019 (n=2,067), 2020 (n=2,009), 2021 (n=3,586).
Source: ACMA consumer survey. QD7: Which of the following smart devices, if any, do you have connected to the internet?
Spotlight: Cybercrime – the dark side of the internet
While the many facets of the internet have Consumers and businesses collectively
provided a way for Australians to connect reported over $33 billion in financial losses
during the COVID-19 pandemic, some due to cybercrime in 2020–21.61 The ACMA
malicious cybercriminals have attempted to monitors cybersecurity and cybercrime issues
take advantage of the increased online activity. through its membership of ReportCyber and
provides consumer alerts, warnings and advice
According to the Australian Cyber Security via its website.62
Centre, more than 67,500 cybercrimes were
reported in 2020–21.60 Reported cybercrimes
ranged from fraud, through online shopping
scams, to investment scams.
22 Communications and media in Australia: Trends and developments in telecommunications 2020–21Consumer satisfaction with On average, Australian consumers were most
telecommunications services content with their mobile phone service, with
almost 7 in 10 expressing satisfaction with
Customer satisfaction levels provide a valuable
the service.
measure of how effectively telecommunications
providers (telcos) are meeting the needs of
Among home internet users, those using
Australians. The ACMA monitors customer
an NBN connection were marginally more
satisfaction though a range of activities,
satisfied than non-NBN users, who, along with
including legislated industry reporting,
fixed-line phone users, were among the least
complaint statistics and consumer surveys.
satisfied at 53%.
Despite COVID-19 restrictions placing telcos
under greater pressure to deliver reliable
services to customers, Australia’s consumer
satisfaction levels with their telcos mostly
stayed the same or increased during 2020–21
compared to pre-pandemic years, suggesting a
high level of resilience in the sector (Figure 23).
Figure 23: Consumer satisfaction with communication services overall, 2019 to 2021 (%)
71
68
61 64
60 60
55 57
53 52 53
39
Fixed-line phone Mobile phone service NBN home internet Non-NBN home internet
May-19 Jun-20 Jun-21
Note: Level of satisfaction or dissatisfaction was measured on a scale of 1 to 5, where 1 is very dissatisfied and 5 is very
satisfied. A rating of 4 or 5 has been reported as overall satisfied.
Base: Fixed-line phone: 2019 (n=997), 2020 (n=788), 2021 (n=1,108); Mobile phone service: 2019 (n=2,033), 2020
(n=1,982), 2021 (n=3,541); NBN home internet: 2019 (n=975), 2020 (n=1,522), 2021 (n=2,667); Non-NBN home internet:
2019 (n=975), 2020 (n=365), 2021 (n=522).
Source: ACMA annual consumer survey. QB1: How satisfied or dissatisfied are you with … your household’s fixed-line
telephone service [overall]?; QC8: How satisfied or dissatisfied are you with … your mobile phone service [overall]?; QD1:
Which of the following is your main household internet connection?; QD10 How satisfied or dissatisfied are you with … your
household internet service [overall]?
Communications and media in Australia: Trends and developments in telecommunications 2020–21 23Market performance
While the normalisation of working from Table 1: Revenues by Australia’s largest
home and remote education over the service providers
pandemic period significantly increased
demand for broadband services, traditional FY20 FY21 Change
revenue streams have been disrupted. $b $b %
Telstra 23.71 21.56 –9.1
Ongoing lockdowns across Australia have also
resulted in higher consumer use of broadband Optus* 8.95 8.32 –7.0
for leisure purposes, such as video-on-demand TPG Telecom† 5.52 2.63‡ –3.0§
services. Telcos have benefited from this trend,
with increased revenue resulting from higher * Year-end March.
† Year-end December; pro forma results.64
numbers of broadband subscriptions and high- ‡ HY21 results.
speed services. § Change based on HY20 to HY21 results.
Source: Industry reporting65
Revenue Table 2: Revenues by select mid-tier
Australian service providers
Major telcos
Despite growing demand for broadband FY20 FY21 Change
services, the major telcos all reported falls $m $m %
in revenue over the 2020–21 financial year
Aussie 190.5 350.3 83.9
(Table 1). This was reportedly due to a Broadband
reduction in international roaming charges,
Macquarie 266.2 285.1 7.1
falling handset sales and ongoing headwinds Telecom
from NBN migration.63
Uniti Group 58.2 159.9 174.7
Mid-tier telcos Superloop 107.6 110.7 2.9
While larger telcos struggled to post Spirit Technology 34.9 104.5 203.8
revenue gains in the 2020–21 financial year,
some smaller telcos have grown over the Source: Industry reporting66
same period.
Smaller telcos are typically less diversified,
which can work as either a positive or a
negative depending on market conditions.
Over the pandemic period, a significant decline
in demand for mobile services was a key
contributor to declining revenue for the major
telcos. However, the mid-tier telcos in Table 2
all specialise in telecommunication services,
such as broadband and cloud storage, which
have seen strong demand due to factors such
as remote working and education. Higher
demand from general use during lockdown,
such as on-demand video streaming, has also
contributed to higher demand for broadband
and cloud services. In some cases, smaller
telcos have grown through merger and
acquisitions.
24 Communications and media in Australia: Trends and developments in telecommunications 2020–21Market activity The major telcos have reported an expected
return to growth in the coming financial year,
The telecommunications market has shifted
as mobile revenue streams are expected to
over the past several years, with a variety of
normalise with the easing of international
acquisition and mergers resulting in higher
border restrictions by the end of 2021. The
market concentration. The merger between
expected normalisation of conditions beyond
TPG Telecom and Vodafone Hutchison,
2021 is anticipated to minimise COVID-19 as
completed in July 2020, has been the highest-
a risk factor for business operations; however,
profile merger over the period. This was in part
COVID-19 is expected to remain an ongoing
due to the media attention on the Australian
challenge to manage for both telcos and
Competition and Consumer Commission’s
Australians more broadly.
legal case, initially brought against this merger
on anti-competitive grounds.
Future outlook
Telcos have focused on digital transformation,
with the demand for digital services from both
consumers and businesses only increasing
over time. Telcos, both large and small, have
responded by diversifying their market strategy,
branching into new sectors such as energy,
and through acquisition of businesses, which
may benefit from integration into their wider
business. Software solutions, dark fibre,
cloud and edge computing and cloud storage
solutions have become popular businesses
for acquisition and are being incorporated into
new product and service offerings.
Telcos have also invested in 5G as a path for
future revenue growth, with the 3 major telcos
all continuing to invest in expanding their
5G mobile network coverage. Telstra aims
to expand their 5G coverage to 95% of the
population by FY25.67 Investment in 5G fixed
wireless services has also become a potential
path for telco growth, with these services
becoming a direct competitor to NBN services
in some regions.
Communications and media in Australia: Trends and developments in telecommunications 2020–21 25Glossary
3G: third-generation mobile ADSL: asymmetric digital subscriber
telecommunications line
Broadband mobile telecommunications Transmission technology that enables high-
services with improved data rates over their speed data services to be delivered over
2G predecessors, providing for applications a twisted-pair copper line. ADSL2+ is an
such as web-browsing, videoconferencing and enhanced ADSL technology that adds new
location-based services. features and functionality that may provide
higher data rates.
4G: fourth-generation mobile
telecommunications broadband
Enhanced broadband mobile A class of high-speed internet access
telecommunications services that provide technologies, such as ADSL, ADSL2+, HFC
increased bandwidth to support voice, video, cable and wi-fi, offering a data rate significantly
data and high-quality streaming multimedia higher than dial-up internet services.
content over an all-IP network. See also LTE.
cable: hybrid fibre coaxial (HFC) cable
5G: fifth-generation mobile Transmission links consisting of optical fibre on
telecommunications main routes, supplemented by coaxial cable
The next iteration of broadband mobile closer to the end user’s premises.
telecommunications services, 5G provides
increased data rates and reduced latency to carrier
support greater connectivity and enables M2M The holder of a telecommunications carrier
services and the IoT. 5G became commercially licence in force under the Telecommunications
available in 2019. Act.
ACCC: Australian Competition and CSP: carriage service provider
Consumer Commission Person supplying or proposing to supply
Commonwealth regulatory body with certain carriage services to a customer,
responsibilities derived from the Competition including a commercial entity acquiring
and Consumer Act 2010. telecommunications capacity or services
from a carrier for resale to a third party. Under
ACMA: Australian Communications and the Telecommunications Act, internet and
Media Authority subscription TV service providers fall within the
Commonwealth regulatory authority for definition of CSPs.
broadcasting, radiocommunications,
telecommunications and some online content, DITRDC: Department of Infrastructure,
with responsibilities under the Broadcasting Transport, Regional Development and
Services Act 1992, the Radiocommunications Communications
Act 1992, the Telecommunications Act 1997, Department of the Australian Government
the Telecommunications (Consumer Protection responsible for managing infrastructure and
and Service Standards) Act 1999 and related regional development policy, communicating
Acts. policy and programs, cultural affairs, and arts.
The ACMA is a statutory authority within the
ACMA annual consumer survey department.
Quantitative consumer research commissioned
fixed-line phone service
by the ACMA that provides time-series tracking
Covers the delivery of voice services over a
of patterns of consumer communications and
copper pair-based PSTN access network or
media use. This research considers consumer
fixed-line broadband networks. Includes fixed
behaviour, adoption of and attitudes towards
VoIP services.
media and communications services and
emerging issues.
26 Communications and media in Australia: Trends and developments in telecommunications 2020–21You can also read