Company presentation - 12 October 2021 - Falck Renewables

Page created by Chester Joseph
 
CONTINUE READING
Company presentation - 12 October 2021 - Falck Renewables
Company
    presentation

    12 October 2021
1
Company presentation - 12 October 2021 - Falck Renewables
Forward-Looking Statements
    This presentation contains certain forward-looking statements that reflect the Company’s management’s current views with respect of
    future events and financial and operational performance of the Company and its subsidiaries. These forward-looking statements are
    based on Falck Renewables S.p.A.’s current expectations and projections about future events and have been prepared in accordance
    with IFRS currently in force and the related interpretations as set out in the documents issued to date by IFRIC and SIC, with the
    exclusion of any new standard which is effective for annual reporting periods beginning after January 1st 2021. Because these forward-
    looking statements are subject to risks and uncertainties, actual future results or performance may differ materially from those
    expressed in or implied by these statements due to any number of different factors, many of which are beyond the ability of Falck
    Renewables S.p.A. to control or estimate precisely, including changes in the regulatory environment, future market developments,
    fluctuations in the price and availability of fuel and other risks. You are cautioned not to place undue reliance on the forward-looking
    statements contained herein, which are made only as of the date of this presentation. Falck Renewables S.p.A. does not undertake any
    obligation to publicly release any updates or revisions to any forward-looking statements to reflect events or circumstances after the
    date of this presentation. The information contained in this presentation does not purport to be comprehensive and has not been
    independently verified by any independent third party.

    This presentation does not constitute a recommendation regarding the securities of the Company. This presentation is not intended to
    be/does not contain any offer, under any applicable law, to sell or a solicitation of any offer to buy or subscribe any securities issued by
    Falck Renewables S.p.A. or any of its subsidiaries.

    Neither the Company nor any member of the Company’s Group nor any of its or their respective representatives, directors or employees
    accept any liability whatsoever in connection with this presentation or any of its contents or in relation to any loss arising from its use or
    from any reliance placed upon it.

2
Company presentation - 12 October 2021 - Falck Renewables
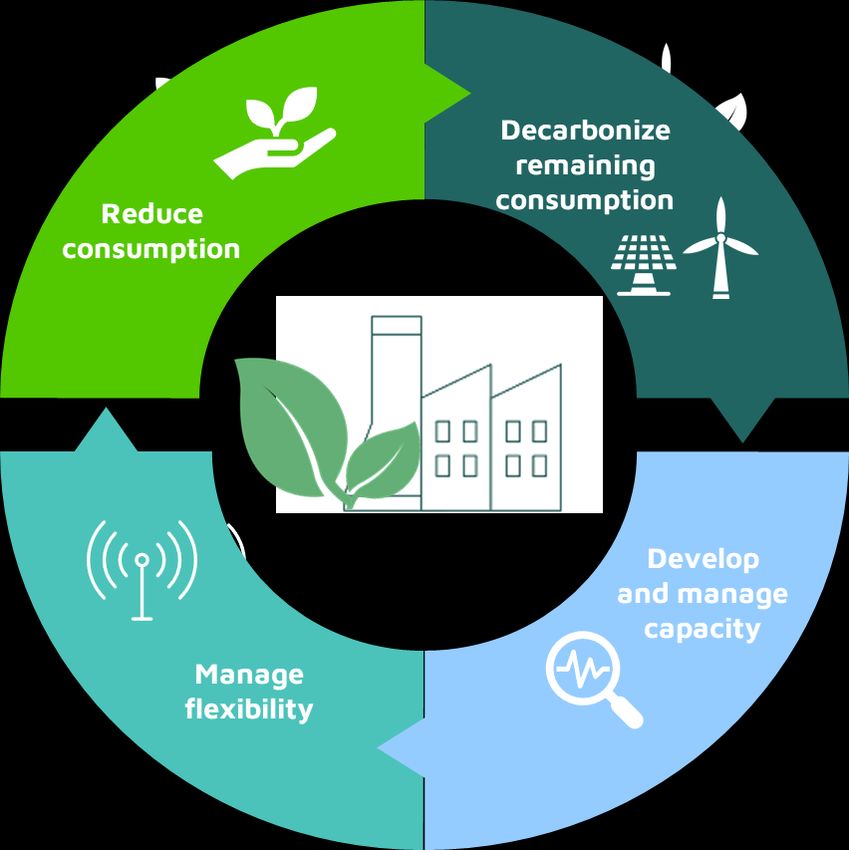
Falck Renewables                                        Our Mission
     at a glance
                                                 Through the generation of clean energy and
                                                 the provision of management services along
                                                 the entire renewable energy value chain, we
                                                 want to create shared and lasting value for
    We are an international pure play company    all our stakeholders, while fully respecting
    working in the renewable energy sector. We   the environment that surrounds us.
    develop, design, build and manage plants
    that generate clean power.
                                                   Energy sustainability from INNOVATION
    We provide highly specialized energy
    management and downstream services to          Global COMPETENCE for a sustainable future
    both energy producers and consumers and
    we use our know-how to manage third-           Maximum CARE for our stakeholders
    party  assets,   both   technically and
    commercially.
                                                   LEADERSHIP for a carbon free development

3
Company presentation - 12 October 2021 - Falck Renewables
Ownership and Corporate Governance

       CURRENT OWNERSHIP                         BOARD COMPOSITION

                                                                                                BoD Committees
                                                                                                 • Sustainable Strategy
                                                                                                 • Remuneration
                                                                                                 • Control and Risks

                 291.4M
                    SHARES

                                                                                           Executive Director
                                                                                           Non Executive Director
                                                                                           Independent Dir. according to T.U.F. and
                                                                                           Corporate Governance Code

                                                 The Board of Directors consists of twelve members. Seven of
                                                 them are Independent Directors (58%) and five are women
       FALCK SPA 60.0%        FREE FLOAT 39.2%   (42%); one was appointed Lead Independent Director.
                  TREASURY SHARES 0.8%
                                                 The new Board of Directors – as approved at The Shareholders’
                                                 Meeting on 7 May 2020 – reflects the Group’s international
                                                 presence.
4
Company presentation - 12 October 2021 - Falck Renewables
Sustainability at the Core
            It is not only about what we do, but how we do it, and the values that we live by.

           Our Sustainability Charter
                                                                            In our strategic plan – the Roadmap 2025 - we have taken 4 main
1. We promote the local workforce and supply chain                          sustainability commitments, a.k.a. sustainability strategic goals.
2. We welcome the participation of communities in our business,             They will be measured over the plan period, verifying progress with
also through ownership schemes                                              key performance indicators (KPIs).
3. We back community projects – from social & educational
to environmental & infrastructural – and we encourage
                                                                                                                                                 KPIs
communities to share project practices to maximize benefits
for others
4. We share our knowledge of energy sustainability to spread
                                                                                DISTRIBUTED                    PROJECTS WITH A                                AVOIDED CO2                 HOURS OF UPSKILLING
the word about its importance                                                   ADDED VALUE*                   SIGNIFICANT COMMUNITY                          EMISSIONS***                AND RESKILLING PER
5. We ensure all our operations have the minimum impact                              (€M)                      ENGAGEMENT PROGRAM**
                                                                                                                         (%)
                                                                                                                                                                 (MTCO2)                  EMPLOYEE
                                                                                                                                                                                                 (HR./Y)
on the environment

                                                                   2020
                                                                                                                               45%                                  0.57                                30
                                                                                        170                                 OF PROJECTS

                                                                    2025
                                                                                        255                                    55%                                   1.36                                40
                                                                                                                            OF PROJECTS

                                                                  * To stakeholders such as staff, shareholders, creditors, central & local administrations, and local communities.
                                                                  ** To be understood as the engagement of the local community through cooperative schemes, ownership schemes, benefit schemes or with the
                                                                  local enabling of sustainable energy consumption services (i.e. community energy PPA, access to net metering credit schemes, etc.).
                                                                  *** References of the emission factors applied : USA: "Emission Factors for Greenhouse Gas Inventories" (US EPA, 2020); EU: “Fattori di emissione
                                                                  atmosferica di gas a effetto serra nel settore elettrico nazionale e nei principali Paesi Europei” [Atmospheric emission factors of greenhouse gases
5                                                                 and other pollutants from the power sector] (ISPRA, 2020); Norway: “Electricity disclosure 2018” (NVE-RME, 2020 update)..
Company presentation - 12 October 2021 - Falck Renewables
Our Strategy

       Reduce consumption                                Decarbonize remaining
                                                         consumption
    An increased focus on sustainability and         Decarbonize energy consumption via
    regulatory compliance requiring a lower
                                                     •    Green energy supply contracts (including
    energy consumption                                    PPA) or on-site RES/BESS generation
    • Large scale energy efficiency (e.g. CHP)       •    Electrification, switching from fossil to
    • Demand Side management (including                   electricity, decarbonizing feedstocks,
      energy management software and battery              switching to green resources
      storage)

        Manage flexibility                               Develop and manage
                                                         capacity
     New sources of flexibility (demand              • Sustain accelerated growth
     response, aggregation) and capability to          strengthening development activities
     manage them within an increasingly              • Need to manage third parties’ assets
     intermittent world in order to maintain           that are approaching lifetime and
     adequate operation of technical and
                                                       incentive end
     commercial processes (TSOs/DSOs play an
     important but indirect role in facilitating /   • Energy management (including
     managing the supply side)                         dispatching and hedging)

6
Company presentation - 12 October 2021 - Falck Renewables
Diversified Portfolio, International Presence and Business Areas
                                                            DEVELOPMENT and
                                                                                    A FULL RANGE OF SERVICES
               1,320 GW               1,063 MW
                                                            ENG. & CONSTRUCTION
                                                                                   ASSET MANAGEMENT AND TECHNICAL ADVISORY
            TOTAL INSTALLED
                   CAPACITY
                                              WIND          SERVICES              3.8 GW                 70 GW                5 GW
                                                                                     ASSET               TECHNICAL            FINANCIAL
                                                                                  MANAGEMENT             ADVISORY             ADVISORY
                                                            ASSET MANAGEMENT &
                                                            TECHNICAL ADVISORY
                 212 MW                  46 MW                                     ENERGY MANAGEMENT AND ENERGY EFFICIENCY
                     SOLAR           WtE & BIOMASS              DIGITAL ASSET
                                                                MANAGEMENT
                                                                                  1,3 TWh                1500
                                                                                      ENERGY             CUSTOMERS
                                                                                    DISPATCHED

                       OWNED ASSETS AND TECHNOLOGY                                  INTERNATIONAL PRESENCE

                     INSTALLED
                     CAPACITY (MW)                                    PLANTS

    ITALY                 355          292           17    46             15
    UK                    413          413                                12
    USA                   175           30           145                   8
    FRANCE                98            98                                 9
    NORWAY                50            50                                 1
    SWEDEN                121          121                                 2
    SPAIN                 109           59           50                    4
    TOTAL               1,320         1,063          212   46             51
                                                                                         International          Our Offices
7
                                                                                         experience
Company presentation - 12 October 2021 - Falck Renewables
Asset Development and M&A: Mission in Key Words
Pursue the growth in installed capacity consistently with the Group’s industrial plan, expanding and
diversifying (also geographically) the projects pipeline and coordinating the activities of greenfield
development.

                                                                                                                                                         Screening and proposal of
                                                                                                                                              Markets    potential opportunities

                                                                                                                                                         Accountability on delivering
                                                                                                                                              Pipeline   fully bankable and buildable
                                                                                                                                                         projects

                                                     4.2GW                                                                                       M&A
                                                                                                                                                         Identify, screen, evaluate
                                                         GROSS                                                                                           and execute acquisition
                                                        PIPELINE*                                                                                        opportunities

                                                                                                                                                         Originate Power Purchase
                                                                                                    Development Phases                           PPA     Agreements for the projects
                                                                                                                                                         developed or acquired
    Already present with capacity                                                                   Phase I: Land/Grid secured

    Not currently present with capacity                                                             Phase II: Planning permission submitted

                                                                                                    Phase III: Project consent/RTB

                                                                                                    Phase IV: Construction
8
                                    * As of 31 September 2020, including asset under construction
2021: Growing and Consolidating Organic Pipeline
    MW under development                                               Asset development      H1 ‘20      H1 ‘21
    at 31 July 2021 (EU+USA)                                           “cash“ costs in M€      7.0        13.2                                                                        ≈10
                                                                                                                                                  +≈ 3,5   GW vs                      GW
                                                                                                   +89%                                               Dic-’20
                                   Continued progress on ScotWind
                                   (not included in pipeline figures)

                                                                                                                    +≈1,4 GW vs
                                                                                                                       Dic-’20

                                                                         +1,1 GW vs                                                                    ≈6 GW
                                                                            Dic-’20

            In Italy, Spain, USA                                                                                       ≈4,2 GW
            UK and Netherlands
                                       +350 MW vs
                                                                                                 70
                                         Dic-’20                                                 MW
                                                                                 ≈2,7
      In France, US and
            Norway
                                                                                 GW

                                               1,3
             101 MW                            GW
    Under construction Phase Advanced Development                   Mid-Early Stage I-A+I-B     Storage              Gross pipeline              Prospects Phase 0        Gross pipeline + Prospects
               IV                 (Phase II+III)

                                                                                                                   Projects (organic and M&A) identified for which a decision on whether to start
                                                                                                                   development activities is yet to be taken or under evaluation

                                     Strong Semester on development activity in USA, Italy and Spain
9   * Project Consented: Permits released by local authorities with conditions
Target Pipeline 2025
- Excluding prospects -
                                                                                                 • Continued growth of Solar, onshore
                                                                                                   wind and hybrid (with battery)
                                                                                                   technologies in Europe and US
                                                               > 15 GW                           • Further diversification in new
                                                                                                   geographies
                                            up to                                                • Possible expansion into new
                                           4 GW                                                    technologies
                        2,8                                                                       - floating offshore in Scotland (with
                        GW                                                                          Bluefloat and Ørsted A/S) and in Italy
                                                                                                    (with Bluefloat)
     0,1
                                                                                                  - Green “H2 ready” projects: HyDeal
                                                                                                    Initiative and other alliances and
     2016              2020                  2021                    2025
                                                                                                    partnerships
 Pipeline includes projects from Phase I (Active Development) to Phase IV (Under Construction)

                       Substantial development effort to scale up pipeline in the next five years
                   Organic growth plan including also all other options (JDAs, partnerships, M&A)
10
Installed Capacity Growth
                                                                  By 2025                                 Consolidation of presence
               Big effort on solar + 7.4x                                                                      in the Nordics
                                                      ~1.1 GW           ~0.8-1.0 GW                   Europe remains central with
                                                      installed         of pipeline in                  high emphasis on South
                                                                            excess                              Europe
               Wind continues to blow                70% solar            available                     Strong growth in the US
                                                                                                          with ENI partnership

                                                     ~2,300                                                                     ~2,300
                                                                                                                                    14%
                                   ~1,900                                                                   ~1,900
                                                                                                                                   29%

        1,196                                                               1,196
                                                                              192        16%
                                                                                                                                  33%
                                                                             511         43%

                                                                             414         35%
                                                                                                                                  24%
                                                                            175          15%
        2020                          2023            2025                  2020                                 2023              2025

                       Wind       Solar      Other                                 USA     South Europe         North Europe   Nordics

11
SERVICES
                                                                        ▪      CPPA (Corporate Power Purchase Agreement)
                                                                        ▪      Portfolio management
                                                                        ▪      Demand-response
                                                                        ▪      Energy communities

                ENERGY MANAGEMENT
                                                                        ▪      Distributed generation (CHP, PV)
                                                                        ▪      Energy efficiency
                 ENERGY SOLUTIONS
                                                                        ▪      Storage (BTM)
                                                                        ▪      Energy audits
                 SMART SOLUTIONS
                                                                        ▪      Metering
                                                                        ▪      Energy Management Systems
                                                                        ▪      Data Science for energy

                                                                                        •   Commercial asset management
                                                                                        •   Revenue control
                                                                                        •   Technical asset management
                                     ▪       Administration of the SPVs and
                                                                                        •   Monitoring and performance analysis
                TECHNICAL ADVISORY           performance optimization of
                                                                                        •   Inspections, testing and diagnosis
                                             the projects
                                                                                        •   Yield optimisation
                                                                                        ▪   M&A and debt transactions
                                                                                        ▪   Financial modelling
                                         ▪    Investment analysis and                   ▪   Debt raising
                M&A AND FINANCIAL             financial structuring for                 ▪   Design of financing and refinancing
                    ADVISORY                  transactions of green power                   structures
                                              installations                             ▪   PPA structuring

                                                                                        ▪   Commercial asset management
                                                                                        ▪   Revenue control
                                         ▪    Engineering consultant covering           ▪   Technical asset management
                ASSET MANAGEMENT              all technical aspects during the          ▪   Monitoring and performance analysis
                                              development, construction and             ▪   Inspections, testing and diagnosis
                                              operation of projects.                    ▪   Yield optimisation
                                                                                        • Regulatory advisory
                                         ▪    Legal support to investment               • Legal DD for transactions
                  LEGAL ADVISORY              structuring and due diligence             • Corporate and SPVs structuring
                                              for renewable energy projects.            • SPA, EPC and O&M contracts
12                                                                                        drafting and review
                                                                                        • Compliance advisory
Guidance 2021 Confirmed
                                           ≈2-7                         205-210
         202.5                                                                                                                                                                                      197,2                            192-202
                                                                                                           (5.3)
                                                                                                                                       (3)-(8)                     (8)-(13)
                                     ↑VOLUMES
                                                                                                                                    FURTHER BOOST
                                     ↑PRICES                                                                                        ON BUSINESS
                                     ↑PERIMETER                                                                                     DEVELOPMENT
                                                                                                                                    ACTIVITIES
                                     ↓ONE-OFFS

     2020 EBITDA                                                    2021 EBITDA                         2020 EBITDA                                          2021 EBITDA
      contribution                                                  contribution                      effect Asset Dev.                                    effect Asset Dev.                 2020 EBITDA                            2021 EBITDA
     Plants&Other                                                  Plants & Other                     2020 Asset Dev.                                       2021 Asset Dev
                                                                                                       effort: ~19€M                                       effort: ~20-30€M

                                                                                                                                                                                                                                    Range
                                                                                                                                                                                                  Group Net Income /
                                                                                                                                                                                                                                    16-17%
                                                                                                                                                                                                       EBITDA
                                                                                                                                                                                               Net Financial Position*             800 ± 5%
                                                                                                                                                                                                                (€M)

                                                                                                                                                                                            Installed + in construction
                                                                                                                                                                                                                                  1400 - 1450
                                                                                                                                                                                                       (MW)

                                                                                                                                                                                                     * Linked to FX assumptions

      Notes:
      ▪ The guidance references provided do not include any non-ordinary or impairment effects. Upon the occurrence of non-recurring events and/or special items, the guidance will be compared to the annual data adjusted”
13    ▪ Notional financial charges on the Green Convertible Bond not included and equity reserve related to the Green Convertible Bond has been added to the net financial position
Our Dividend Policy

14
Appendix

15
Asset Base in H1 2021
                                                            June 2021
                                                                                      YEARS
     Technology           MW                                                  +5              +10                  +15              +20         +25         +30                +35

                                           Project's residual Life 12y
     WIND UK              413                Residual Debt's Life 8y                                   4y
                                      Residual Incentive/PPA Life 8y9m                              3y3m

                                           Project's residual Life 14y
     WIND IT              292                Residual Debt's Life 4y9m                                      9y3m
                                      Residual Incentive/PPA Life 4y6m                                      9y6m

                                           Project's residual Life 19y6m
     WIND SP *            33
                                      Residual Incentive/PPA Life 2y                                                        17y6m

                                           Project's residual Life 34y
     SOLAR SP   *         50                 Residual Debt's Life 15y                                                                                                    19y
                                      Residual Incentive/PPA Life 3y6m                                                                                                30y6m

                                           Project's residual Life 18y3m
     WIND FR              98                 Residual Debt's Life 4y6m                                                     13y9m
                                      Residual Incentive/PPA Life 3y9m                                                     14y6m

                                           Project's residual Life 24y3m
     WIND NORDICS     *   171
                                      Residual Incentive/PPA Life 7y3m                                                                    17y

                                           Project's residual Life 33y
     SOLAR US *           144                Residual Debt's Life 9y9m                                                                                            23y3m
                                      Residual Incentive/PPA Life 10y9m                                                                                           22y3m

                                           Project's residual Life 25y9m
     WIND US    *         30                 Residual Debt's Life 4y9m                                                                            21y
                                      Residual Incentive/PPA Life 5y9m                                                                            20y

                                           Project's residual Life 13y6m
     SOLAR IT             17                 Residual Debt's Life 6y6m                                      7y
                                      Residual Incentive/PPA Life 9y6m                                      4y

                                           Project's residual Life 2y3m
     WTE                  20                 Residual Debt's Life 2y3m                                                                                                               Residual Project Life
                                      Residual Incentive/PPA Life 2y3m                                                                                                               Residual Debt Life
                                                                                                                                                                                     Project cash flow after debt repayment
                                           Project's residual Life 4y6m
                                                                                                                                                                                     Wholesale price
     BIOMASS IT           15                 Residual Debt's Life 4y6m
                                                                                                                                                                                     Residual incentive life
                                      Residual Incentive/PPA Life 4y6m

                                           Project's residual Life   18y
     TOTAL °              1283               Residual Debt's Life    5y9m                                                12y3m
                                     Residual Incentive/PPA Life     6y9m                                                11y3m
16               * PPA secured, SREC (in the US only)          ° Not included minority stake in La Muela (26%) wind farm, Frullo Energia Ambiente (49%) for a total amount of 37MW
Electricity Production – H1 2021
                                                                                                                    -2%
                                                                                                                                                                                                                                                    H1 2021
                     By technology                                                            1,464                                 1,435
                         (GWh)                                                                                                                                                                           Weak production vs. H1 2020 (-22%). Significant grid
                                                                                                                                                                                                         curtailments at our Millennium, Kilbraur, Assel Valley and
                                                                                                                                                                                                         Auchrobert wind farms included in National Grid balancing
                                                                                                                                                                                                         system (46 GWh compensated).

                                                                                                                                                                                                         • Wind production slightly below H1 2020 (-3%) due to
                                                                                                                                                                                                           lower wind conditions.
                                                                                                                                                                                                         • Higher solar production than H1 2020 (+9%): H1 2020
                                                                                          H1 2020                                  H1 2021                                                                 performance burdened by Spinasanta revamping in Q1.
                                                                                                                                                                                                         • Energy from waste/biomass higher vs. H1 2020 (+11%)
                      By geography                                                                                                                                                                         mainly due to biannual maintenance works occurred at
                                                                                                                      -2%                                                                                  Rende Biomass plant in Q1 2020.
                         (GWh)
                                                                                              1,464                                  1,435

                                                                                               161
                                                                                                                                                                                                         Bigger volumes vs H1 2020 due to perimeter increase (+32
                                                                                                                                                                                                         MW solar and +30MW wind).

                                                                                                                                                                                                         Lower productions vs. H1 2020 (-17%) due to poor wind
                                                                                                                                                                                                         conditions across the country compared to exceptional
                                                                                                                                                                                                         performance in Q1 2020.

17                                                                                         H1 2020                                 H1 2021
*    For the calculation of emissions, the emission factors reported in the "National Standard Parameters Table" of the United Nations Framework Convention on Climate Change (UNFCCC), published annually by the Ministry of the Environment, were adopted
Wind and Solar Portfolio Performance H1 2021
                 H1 2021 vs H1 2020: Load factor* by country
                                                                               43.4%                                         Evolution of production by country**
                                                                     38.0%
          36.0%

                                                               31.0%                          31.3%
      28.3%              28.0%                    28.1%
                                         24.7%                                           25.4%
                   23.3%         24.1%                                                                             Italy     UK      France        Spain        Nordics         USA          TOTAL
                                                       21.8%

                                                                                                        100%
                                                                                                       expected
                                                                                                      production

                                                                                                                   - 12.7%   -7.9%    - 5.8%        -11.2%       - 18.3%        - 2.6%         - 8.5%

                                                                                                       2021
               * Based on effective operating hours, excluding reimbursed curtailments
                                                                                                                                                                                               - 11.5%
                                             Q1 2021      Q1 2020

              H1 2021 vs H1 2020: Load factor* by country

                                                           30.7%

                                                                                                                                                                                    - 4.8%

                                                                                                       2020
                                                                                                                   -11.5%    19.6%     13.5%         -35.3%        -2.1%         -13.1%          4.0%
              17.2% 16.7%           16.6% 16.6%                                 18.0% 16.6%
                                                                                                                                                                                                  0.1%

                                                                                                                                                                                             Total Group (excludes
                                                                                                                                                                                             reimbursed curtailment)

                                  * Based on effective operating hours,                                                               ** variation % vs. internal Index of production
18
H1 2020 H1 2021               D%
      Captured Price Overview H1 2021                                                                                                                                                                             France (€/MWh)            95     95*                0%
                                                                                                                                                                                                                  Spain (€/MWh)             35     34**               -1%
                                                                                                                                                                                                                  Nordics
             Captured price + Incentive                                                                                             Captured price + Incentive                                                    (€/MWh)                     29              28***   -4%
            Wind                                                                                                                    Wind                                                                          US   ($/MWh)                79               86      9%
€/MWh                                    16%                                                                            GBP/MWh                               2%
                                                      159                                                                                       86                              89
                    138

                                                                                                                                                               2%
                                                                                                                                                46                              47
                                         10%
                                                      109
                         99                                                               8%                                                                                                                 9%

                                                                                23%                                                                                                                                         49%
                                                                                                                                                               2%
                                         29%                                                                                                                                                          42%
                                                      50                                         68%                                            41                              42
                         39

                H12020
                H1 2020                           H1
                                                  H1 2021
                                                     2021                                 2021                                           H1  2020
                                                                                                                                         FY 2019                          H1
                                                                                                                                                                           FY 2021
                                                                                                                                                                              2020
                                                                                                                                                                                                                  2021
                                                                                    Hedging level                                                                                                        Hedging level
             Energy price                 Green Certificate                                                                          Energy price             ROCs        ROC Recycle**
                                                                                                                                                                                     ** Excluding Roc Recycle impact

                     €/MWh; Historical wholesale electricity price                                                                              GBP/MWh; Historical wholesale electricity price
                     €/MWh                      Q1 2021             Q2 2021                                                                            GBP/MWh                   Q1 2021                Q2 2021
                                                                                                                                                                                                                                                         95
      95     South                                57.6                 74.7                                       95
                                                                                                                   95
                                                                                           81 (+201% vs Q2 20)                                                UK                     63.6                  72.5                 73 (+198% vs Q2 20)
             Sardinia                             57.6                 73.8
             Sicily                               60.5                 81.0                                                                                                                                                                              70
                                                                                                                  70
                                                                                                                   70
      70

                                                                                                                                                                                                                                                         45
                                                                                                                  45
                                                                                                                   45
      45
                                                                               74/75 (+194/210% vs Q2 20)
                                                                                                                                                                                                                                                         20
                                                                                                                  20
                                                                                                                   20
                                                                                                                                   IIQ   2019     IIIQ 2019    IVQ 2019    IQ   2020     IIQ   2020   IIIQ 2020      IVQ 2020      IIQ 2021   IIQ 2021
      20
             IIIQ 2019        IVQ 2019    IQ   2020   IIQ   2020   IIIQ 2020   IVQ 2020     IQ 2021    IIQ 2021

619                                                                                                                     *France Wholesale price H1 2021: 58,48 €/MWh; **Spain Wholesale price H1 2021: 58,58 €/MWh;
           Source: GME, Heren
                                                                                                                        *** Scandinavia Wholesale price H1 2021: 42,03 €/MWh;
H1 2021 Financial Highlights
                                                                                                                                                                                                                          Delta vs
                                                                                H1 2021                                        H1 2021               H1 2020                                          H1 2020
     (€M)                                                                                         Special items                                                         Special items                                     H1 2020
                                                                             Reported                                         Adjusted              Reported                                         Adjusted             Adjusted

     Revenues and Other Income                                                       240.1                                          240.1                  204.8                                           204.8            17.3%

     Ebitda                                                                         100.7                                           100.7                  106.3                         1.7                107.9          (6.7%)

     % on Revenues and Other Income                                                41.9%                                           41.9%                  51.9%                                           52.7%
     Depreciation - Amortization - Write Off                                         (46.1)                                         (46.1)                (44.0)                                           (44.0)
     Operating result                                                                  54.6                                           54.6                   62.3                        1.7                  64.0         (14.7%)
                                                                                                                                                                                                                                       Breakdown        1H 2021   1H 2020
     % on Revenues and Other Income                                                22.7%                                           22.7%                 30.4%                                             31.2%
                                                                                                                                                                                                                                       Depreciations    (44.2)     (40.6)
     Financial income and charges                                                    (17.0)                       1.6               (15.4)                (20.8)                                           (20.8)
                                                                                                                                                                                                                                       Provisions        (2.0)     (3.3)
     Equity investments                                                               (0.8)                                           (0.8)                 (0.8)                                            (0.8)
                                                                                                                                                                                                                                       Write – offs /     0.1      (0.1)
     Earnings Before Taxes                                                             36.7                       1.6                 38.4                   40.7                        1.7                  42.4         (9.4%)      Revaluations
     Taxes                                                                           (17.6)                       8.1                 (9.5)                (12.3)                       2.3                  (9.9)
     Net Earnings                                                                      19.1                       9.8                 28.9                   28.4                       4.0                   32.4         (11.0%)
     Minorities                                                                          7.5                      2.4                   9.9                     7.1                      1.0                   8.2
     Group Net Earnings                                                                11.6                       7.4                  19.0                  21.3                       3.0                   24.3         (21.8%)

                                                                                END OF                                          END OF                 END OF                                           END OF
                                                                                                                                                               Special items/
     (€M)                                                                       H1 2021           Special items                 H1 2021                  2020                                             2020
                                                                                                                                                               Non Recurring
                                                                               Reported                                        Adjusted               Reported                                      Adjusted
     Net Invested Capital                                                            1,502                        3.2               1,505                   1,414                     (4.0)                 1,410
     Equity                                                                              711                  (18.4)                    693                   708                   (27.1)                      681
     Net Financial Position                                                           (791)*                  (21.6)                 (812)                  (706)                   (23.2)                   (729)
     of which: Proj. Fin. and MLT no recourse                                        (603)                                          (603)                  (607)                                            (607)

20    * Net Financial Debt, as defined by ESMA (European Security and Markets Authority) in its guidelines published on 4 March 2021, equal to 808 million of euros, differs from the Net Financial Position due to the inclusion of
      some items such as " other non-current payables ”and the exclusion of the fair value of non-current financial instruments (active derivatives) and“ hedging ”instruments as well as“ non-current financial receivables ”.
H1 2021 Cash Flow (in M€)
                                   CASH                                                                                             CASH
                                    148                                                                                              75

                                                                                                                                     SPV
                                    SPV                                                                                             CASH
                                   CASH                                                                                              121
                                     91
                                                                                                                                 CII HOLDCO 8
                                 CII HOLDCO 10                                                                                                                  PROJECT FINANCING (603)
   PROJECT FINANCING (607)
                                   NFP    Cash Flow                                                         Other     Exchange       NFP
                                                       Net Capex/                              Equity
                                 Dec 2020   from                    Derivatives   Dividends                Equity       ratio     June 2021
                                                       Perimeter                            Investments
                                          Operations                                                      movements

GREEN CONVERTIBLE BOND (176)
                                 (706)                                                                                            (791)                     GREEN CONVERTIBLE BOND (179)

         IFRS 16 (91)
                                                                                                                                                                         IFRS 16 (99)
         FV DER. (46)                                     (101)
COMMUNITY FINCOOP INSTR.* (13)                   79                                                                                                                      FV DER. (65)
        OTHER (22)                                                     (13)        (23)         (9)         (2)       (16)                                 COMMUNITY FINCOOP INSTR.* (13)
                                                                                                                                                                   OTHER (36)
                                                          68 SOLAR
                                                          20 WIND
                                                          5 ASSET DEVELOPMENT COSTS                                                             * Investment scheme to encourage the
                                                          2 DIGITAL & IT                                                                        community to establish cooperatives,
                                                                                                                                                whose members will contribute to
                                                          5 OTHERS                                                                              financing the energy plant
  21
H1 2021 Gross Debt Breakdown
                                                                                                                                                 Gross debt without derivatives
     Gross debt nature without                        Gross debt by currency without                           Gross debt without derivatives
                                                                                                                                                  and leases: construction and
       derivatives and leases                             derivatives and leases                                     and leases hedged
                                                                                                                                                           operations

                                                                                                                               33%
                                                                              H1                                            H1
                                                                         42% 2020 54%
                                                                                                                           2020
                                                                               4%                                        67%

                 €834M                                                     €834M                                          €834M                                       €834M

       Financing with recourse                                                  GBP                                        Hedged                                  Operating plants

       Project financing without recourse                                       EUR                                        Un-hedged                               Under construction

       Other financings without recourse                                        USD
                                                                                                                                                -60 bps vs H1 2020

       Gross debt = project financing + other debt + debt vs CII HoldCo + corporate debt + Green Convertible Bond

                                                             Average interest rate (including interest rate swap and
22                                                       excluding figurative cost of Green Convertible Bond) of 2.60%*                             *excluding IFRS 9 effect
Pipeline definition throughout the different phases

     Phase 0 –
      Prospect                Phase 1/A                  Phase 1/B                                         Phase 3/A
                                                                                  Phase 2                                           Phase 3/B                   Phase 4
                                Active                  Grid or Land                                        Project
                                                                                 Application                                       Pre-FID / RtB                 Under
First desktop analysis of    development                  secured                                          Consented
      the project on                                                             Submitted                                                                    construction             COD
                                                                                                                                    Pre-construction                                   Commercial
  constraints, resource      We start contacting       Grid Connection offer                                                     conditions discharged or
                                                                                                                                                                                      Operation Date
                                                                                                         Permits released by
       and site visit           landowners,              accepted or lease      Start of the official                             able to be discharged     Construction activities
                                                                                                        local authorities with
                            municipalities and grid   options on plant signed   permitting process                                                                 started
                                                                                                              conditions
                                  operators

                                                                                                                                                      Final
                                                                                                                                                   Investment
                                                                                                                                                     Decision
                                                                                                                                                      (FID)

            Phase 0                              Phase I                              Phase II                             Phase III                                 Phase IV

                                                                                                Pipeline

23
Financial Highlights
                                             213.5
      (€M)                  197.7 6.2                 9.5     202.5
                                                                      5.3
        ASSET
                                                                              Asset dev.
        DEVELOPMENT                                                          «cash» costs
        COSTS (in EBITDA)
                            191.5            204.0            197.2                         ❑ Ebitda at €197.2M (€195.8M after non-recurring and
        EBITDA
        Group Net
                                     ~7€M             ~14€M           ~19€M                   special items) above expectations. -3.2% vs 2019.
        Earnings                                                                              202.5 before Asset Development costs
                                     43.7            48.4             45.6
                                                                                            ❑ Group Net Earnings at €45.6M (€36.6 after non-
                                                                                              recurring and special items) above expectations. -
                               2018             2019            2020                          5.7% vs 2019
 CAPACITY (MW)                 970             1,133            1,196                       ❑ NFP at €706M (€728.7M after non-recurring and
     PIPELINE (GW)             0.7              2.0                 2.8                       special items) better than expectations and end of
                                                                                              2019 (€721M)
                                                                     1,414
                                                     1,328
                                                                                            ❑ Continued asset base growth (+ ~300€M invested
                                     1,103                                                    capital vs. 2018), strong cash flow generation
         NFP                                                                                ❑ +254% growth in Asset Development capital
                                              721             706
         Net Invested
                             547                                                              allocation since 2018, underpinning growth in
         Capital
                                                                                              pipeline and change mission from IPP to
                                                                                              «DEVELOPER – OWNER»

                               2018            2019             2020
 NFP/ EBITDA                  2.9x             3.5x              3.6x
24
Revenues approach to new projects in Europe
                                                                                                         Energy Volumes floating and hedged
     70-80%          Energy Volumes under PPA; 7-10 years                                 20-30%
                                                                                                                  yearly (y and y+1)
     Originating PPAs at project development stage:                                      Volumes that remain «floating» are hedged:
     - covering volume risk by contracting directly with costumer                        - Ex-ante monthly, quarterly, yearly hedging to reduce
     - Stabilizing price / revenues over a 7-10 years PPA period                           price volatility
     - Several options: CPPAs, PPAs with traders, auctions                               - The floating share of volumes allows to manage
     - Necessary condition to allow project leverage (30-50% non-                          production volatility (risk of over and underhedge)
       recourse project level debt)

           • Increased sophistication in
             PPA structuring
           • Options available should                                                                          Capacity
             increase over time for PPAs:                                  Energy
                                                                            (value of                         Flexibility
             Duration; Floor; Collar; Fixed                                   MWh)                            (value of MW          Most of our future assets will be partially dispatchable
                                                                                                               short-term)
             price; Escalators; “as produced”                                                                                       and able to provide flexibility and reliability services to
                                                                                                                                    the system, thanks to the:
             / profiled; Basis risk                                                   Sustainable                                   - Hybridization of RES with batteries which is crucial for
                                                                                     and reinforced                                    capacity revenues, ancillary services and peak
                                                                                                                                       generation management, especially for Solar plants →
                                                                                        revenue                                        “Hardware” side
      - Proactive and diversified management of GOs,                                  structuring                                   - Structuring and diversification of revenue streams
        REGO, RECS through a network of brokers and                                                                                    through digital optimisation tools and Energy
        counterparties that allow us to extract any
                                                                            Carbon                             Capacity                Management strategies → “Software“ side
        potential upside for this market.
                                                                             (value of                        Reliability
                                                                              avoided                         (value of MW
      - Currently, there is still limited value coming                      emissions)                          long term)
        from this component – more needs to be done
        so that RES avoided carbon emissions gain
        proper value

25     GOs: Guarantees of Origin; REGO: Renewable Energy Guarantees of Origin; RECs: Renewables Energy Certificates
2020 Results: won ≈175 MW of PPAs and government tariffs; additional 530 MW of
PPAs in exclusivity or pre-exclusivity; proprietary trading desks, continues hedging of
open positions.
                                                                                                                                            Energy: Hennoy PPA with Major                                         Energy: Brattmyrliden – Ball Corporation;
                                                                                                                                            European Commodity Player; PPA ≈ 35                                   PPA ≈ 52 MW out of the plant’s 74,1 MW;
 Energy                                                                                                                                     MW out of the plant’s 50 MW; onshore                                  Onshore wind; 10 years
 (value of                                                                                                                                  wind; 10 years
                                                                       Proprietary trading desk                                                                                                                   PPA discussions for additional 46MW
   MWh)
                                                                       Energy: PPA negotiations in exclusivity or
                                                                       pre-exclusivity for around 55 MW

                                                                       Capacity flexibility: Flexibility Market with
                                                                       four of our wind plants and most remaining
          Capacity                                                     plants are registered for service provision
         Flexibility
         (value of MW
          short-term)                                                                                                                                                                                                                          Evolving towards
                                                                                                                                                                                                                                              the Energy «plus»
                                                                                                                                                                                                                                             model: sustainable
                                                                                                                                                                                                                                                and reinforced
 Capacity
Reliability                                                                                                                                                                                                                                  revenue structuring
 (value of MW                                                           Energy and Capacity: VDER***;
   long term)
                                                                        Government tariff; 37.5 MW PV
                                                                        at around 68 $/MWh for 25 years:
                                                                        Feed-in Premium

                                                                                                                                                                                        Proprietary trading desk
           Carbon
            (value of                                                                                                                                                                   Energy: PPA with Illumia; ≈ 8-9MW Solar PV (out of plants 10,6
             avoided                                                                                                                                                                    MW) in Sicily; Long Term (+more than 300MW of PPAs in negotiation)
           emissions)

                                                                                                                                                                                        Capacity flexibility: 7,5MW* of storage capacity at 18,8 k€/MW/year
                                                                                                                                                                                        for 5 years in the Fast Reserve Auction
                                                         Energy: PPA Carrecastro – Holaluz; ≈ 7,5 MW onshore wind,                                                                     Capacity reliability: 9 MW/year** at 75 k€/MW/Year for 15 years
                                                         7 years signed in 2019; (+125 MW of PPAs in pre-exclusivity)                                                                  (capacity market auction for 2023 delivery, with Solar+Storage in
                                                         Energy: Government Auction Tariff 40 MW PV at 24,79                                                                           South zone
                                                         €/MWh for 12 years; CfD (Contract-for-Difference)

      ***VDER - Value of Distributed Energy Resources (VDER), also known as Value Stack, is a program promoted by the New York State Public
26    Service Commission in substitution of net metering tariffs in the State. It includes Merchant-based components: Energy value (LBMP), Capacity       *Subject to succeful developing project **The capacity premium is assigned pro-rata based on the 50% derating factor
      value (ICAP) and Fixed component: Environmental value (E) and Demand Reduction Value (DRV)                                                          applicable to the capacity, hence the battery capacity to be installed will be higher, to be able to retain the full premium
Price & Risk Assumptions | FY 2021
                                                                                                                                Power Price Risk
                                                                                                              ❑The risk / reward of the group’s revenues will be optimized through a
                                                                                                               dynamic hedging strategy: optimal bundle of ST hedge, LT PPA,
                                                                                                               merchant exposure and Capacity payments.
                                                                                                              ❑Market exposure to a shift of the reference market prices is on average
                                                                                                               lower that 20 c€/MWh. Net exposure is significantly lower (portfolio
                                                                                                               diversification effect)

                                                                                                                         2021 Price Risk Sensitivity considering Hedged Positions°
                                                                                                                              …electricity unit price variation                    …impact on group revenues
                                                                                                                                             ± 1 €/MWh                                          ± 0.06 M€
                                                                                                                                             ± 1 £/MWh                                           ± 0.11 M£
                                                                                                                                             ± 1 $/MWh                                             ± 0 M$
                                                                                                                      Other                  ± 1 €/MWh                                          ± 0.18 M€

                                                                                                                                Onshore Wind Full Price***                                         2021              2023      2025
                                                                                                                      Captured price*** + Green Certificate (CV) +
                                                                                                                      Guarantee of Origin (GO) – Imbalance cost (€/MWh)                              182                 150   152
                                                                                                                      Captured price*** + Renewable Obligation Certificate
                                                                                                                      (ROC) + Renewable Energy Guarantee of Origin                                  140                  108   113
                                                                                                                      (REGO) – Imbalance cost (£/MWh)

27   *US: SREC + Capacity Payments ; UK: ROCs + % of Grid Benefits; ITA: Green Tariff + Conto Energia; Other EU: French FiT     ***Captured price considered in the calculation does not include the effect of hedging
                                                                                                                                ° based on hedging from September to December
Spot Electricity Prices: 11/10/2021 Update

                       240                                                                                                                                               240
 Electricity Price; Lc/MWh

                                                                                                                                             Electricity Price; Lc/MWh
                                                                                                      Sep-21                                                                                                              Sep-21
                      200                                                                                                                                                200                                               189.1
                                                                                                       158.6
                             160                                                                                                                                         160
                             120                                                                                                                                         120
                              80                                                                                                                                          80
                              40                                                                                                                                          40
                               0                                                                                                                                          0
                               Jan-20       Apr-20       Jul-20      Oct-20       Feb-21      May-21       Aug-21       Dec-21                                            Jan-20   Apr-20   Jul-20   Oct-20   Feb-21   May-21     Aug-21   Dec-21

                       240                                                                                                                                           100
                                                                                                                                                                                                                         Sep-21
 Electricity Price; Lc/MWh

                                                                                                                                         Electricity Price; Lc/MWh
                                                                                                                                                                      90
                                                                                                                                                                                                                          86.0
                      200                                                                            Sep-21                                                           80
                                                                                                      156.1                                                           70
                             160                                                                                                                                      60
                             120                                                                                                                                      50
                                                                                                                                                                      40
                              80                                                                                                                                      30
                              40                                                                                                                                      20
                                                                                                                                                                      10
                               0                                                                                                                                       0
                               Jan-20       Apr-20       Jul-20      Oct-20       Feb-21      May-21       Aug-21       Dec-21                                         Jan-20      Apr-20   Jul-20   Oct-20   Feb-21   May-21   Aug-21     Dec-21

  Graphs show monthly electricity prices 2020-2021 (Historical Spot and Forward) in countries where Falck has market price exposure.

28                           Data sources: EEX, Reuters; Last data available regarding the current month: 11th October, 2021. Lc = Local currency (£ in UK, otherwise €)
Gas Prices: 11/10/2021 Update

                                     2020-2021 TTF Gas Price                                                              80       Forward 2022 2023 TTF Gas Price
             100
                   90                                                                                                     70                                                                     TTF
                                    Historical Spot Price                                                                            Forward 2022
                                                                                                                                                                                        €/MWh
                   80               Forward                                                                               60         Forward 2023

                                                                                                         Nominal; €/MWh
Gas Price; €/MWh

                   70                                                 Sep-21;                                                                                                       2020         9.23
                                                                                                                          50
                   60                                                  62.2                                                                                                         Q1-21       18.56
                                                                                                                          40                                                        Q2-21       24.83
                   50
                                                                                                                                                                                    Q3-21       47.20
                   40                                                                                                     30
                                                                                                                                                                                    Q4-21       81.92
                   30                                                                                                     20                                                        2021        43.32
                   20                                                                                                                                                               2022        49.54
                                                                                                                          10                                                        2023        30.23
                   10
                   0                                                                                                      0
                   Jan-20        May-20        Oct-20        Feb-21         Jul-21        Dec-21                          Jan-20    May-20   Oct-20      Feb-21   Jul-21   Dec-21

                   Data sources: EEX, Reuters; Last data available regarding the current month: 11th October, 2021. Lc = Local currency (£ in UK, otherwise €)
29
CO2 Prices: 11/10/2021 Update
                                                   SPOT CARBON PRICES IN THE EU ETS (€/tCO2, NOMINAL)
        Historic prices (€/tCO2, nominal) have primarily been driven by policy announcements, commodity price movements and macroeconomic effects)

                                                                                                                               Prices reached
                                                                                                                                64.7€/tCO2

                                                                                                                             First UKA auction
                                                                                                                                EUA @48-49
                                                                                                                                   €/tCO2

                                                                                                                          gen-21     apr-21      lug-21   ott-21

                                                                                                                                        Phase 4

Data sources: Reuters. Last data available regarding the current month: 11th October, 2021.

30
Wind Production Europe: End of September 2021 Update

                              4                                                                                                              12                                                                                                     12
     Wind Production; GWh/h

                                                                                                                                                                                                                           Wind Production; GWh/h
                                                                                                                    Wind Production; GWh/h
                                                                                                                                             10                                                                                                     10
                              3
                                                                                                                                             8                                                                                                      8
                              2                                                                                                              6                                                                                                      6

                                                                                                                                             4                                                                                                      4
                              1
                                                                                                                                             2                                                                                                      2
                              0                                                                                                              0                                                                                                      0
                                  1    2     3     4     5    6   7       8     9    10    11    12                                                   1   2   3   4   5   6   7    8   9   10   11   12                                                  1     2      3    4       5   6   7     8       9   10       11   12
                                                              Months                                                                                                      Months                                                                                                       Months

                         8                                                                                                         12                                                                                             14
                                                                                                                                                                                                                                                                Actual             Normal
Wind Production; GWh/h

                                                                                                          Wind Production; GWh/h
                         7                                                                                                                                                                                                        12
                                                                                                                                   10

                                                                                                                                                                                                          Hydro net inflow; TWh
                         6
                                                                                                                                             8                                                                                    10
                         5
                         4                                                                                                                   6                                                                                            8

                         3                                                                                                                                                                                                                6
                                                                                                                                             4
                         2
                                                                                                                                                                                                                                          4
                              1                                                                                                              2
                                                                                                                                                                                                                                          2
                         0                                                                                                                   0
                                  1   2     3     4     5    6   7        8     9    10    11    12                                               1       2   3   4   5   6   7    8   9   10   11   12                                  0
                                                             Months                                                                                                       Months                                                             Sep-20          Nov-20       Jan-21       Mar-21   May-21       Jul-21        Sep-21

31                                Data sources: Reuters; *Actual calculated at european level from Reuters data; **Normal production calculated by Reuters comparing production in multiple years considering also weather patterns.
                                  Actual vs Normal wind production in the European countries where Falck Renewables has plants in operation.
NFP Evolution

 (€M)                   2019                                                                                                      2025
                               22      Cash                        NFP Variation (314)                      Cash             22
                                       available                                                            available
                               109     SPV Cash
                                     10 CII Holdco                                                             SPV Cash     100                      Project
 Project Finance                                                                                                                                     Finance
                                                                                                                                         (474)
                     (672)

                                                                                                                                                     Corporate
 Corporate Debt      (32)
 Derivatives                                                                                                                             (522)       Debt
                     (33)                              Operating
 IFRS 16 /Other D.   (81)
 Local Comm. (12)                             Capex    Cash Flow          154
 Other               (33)                                                                (250)        Dividends
                             (721)                                     Tax Equity/                                                               (11) Derivatives
                                                                       Minorities     Fin. Charges,    (202)                             (140)       IFRS 16 /Other D.
                                                                                            FV                                                       Local Comm.
                                                                      Contributions                                                       (10)
                                                                                       Derivatives                        (1,035)

                                             (1,234)     1,217

32
Uses and Sources 2019 – 2025
     (€M)                         Cash Out                             Cash In

                                                              9        ~ 2,166
                                                   202                                 of which €325M
                                                                                       revolving credit facility
                                      250                                522

                      471                                                273
                                                                         154
                                                                                 Operating Cash Flow
                                                                                 Corporate Debt
                                                                                 New Project Financing
                                                                                 Tax Equity/Minorities contrib.
            1,234                                                        1,217

            CapEx   Project Finance   Financial   Dividends   Others
                     Repayments       Charges
33
34
You can also read