Comparative effect of Fenugreek and Cinnamon on management of newly diagnosed cases of Type-2 Diabetes Mellitus
←
→
Page content transcription
If your browser does not render page correctly, please read the page content below
a

                                                                                                                                     ISSN 0101-2061 (Print)
    Food Science and Technology                                                                                                    ISSN 1678-457X (Online)

    DOI: https://doi.org/10.1590/fst.47720

      Comparative effect of Fenugreek and Cinnamon on management of newly diagnosed
                               cases of Type-2 Diabetes Mellitus
                    Hajra AHMAD1, Seemin KASHIF1, Asma AFREEN1, Mahpara SAFDAR1, Zaheer AHMED1*

      Abstract
      Clinical evidence suggests that T2DM and its complications can be prevented through regular intake of functional foods.
      This cost-effective way of managing T2DM in developing world might prove very beneficial. A randomized controlled trial was
      done to compare effects of Fenugreek and Cinnamon on treatment of newly diagnosed cases of T2 DM. Subjects were selected
      from Pakistan Institute of Medical Sciences Hospital, Islamabad. Study was carried out in three phases: Phase I, baseline; Phase
      II, after 90 days and Pahse III at end of washout period. Subjects, from both genders, were within the age range of 40-65 years.
      There were 26 subjects in each group. Serum levels of FPG, HbA1c, fasting insulin levels, lipid profile were measured at baseline
      and at the end of 2nd and 3rd phases. BMI, WC and WHR were also studied in all phases of the study. SPSS (version 22) was used
      for analysis. Cinnamon seemed to have more effect on both anthropometric (BMI & WC) and biochemical (FPG, HbA1c, serum
      Insulin, serum cholesterol, HDL & LDL) parameters, as compared to Fenugreek, which had effect on WC, FPG, HbA1c,
      serum cholesterol and TG only. Although, the magnitude of these effects was similar in both groups.
      Keywords: Cinnamon; Fenugreek; nutraceuticals for T2DM; biochemical markers.
      Practical Application: The costs of Diabetes cause many financial problems to patients, healthcare systems, and insurers. In low-
      income countries, prevalence of Diabetes is increasing, and both national and individual income levels are low. Hence, use of
      nutraceuticals can be recommended as an adjunct to medical management, in order to reduce the requirement of medication
      and hence reduce the cost of treatment.

    1 Introduction
         All foods which contain biologically active ingredients are                     the most studied bioactive fractions of the plant, which were
    considered to be functional foods because of their health benefits                   found to exert beneficial effects on glucose tolerance, insulin
    associated with prevention of certain NCDs like DM. Many                             function, inflammation, blood lipids, and liver functions
    studies focused on the herbal remedies which played role in the                      (Avalos-Soriano et al., 2016; Ota & Ulrih, 2017; Shi et al., 2017;
    treatment of Diabetes (Acevedo et al., 2017; Choudhury et al., 2017;                 Siener et al., 2020). Cinnamon supplements were found to have
    Shahzad et al., 2020). There were 451 million people with T2DM                       moderate effects on FPG and HbA1c, when added to standard
    all over the world by year 2017, and this number was expected                        hypoglycemic medications (Costello et al., 2016). A systematic
    to rise to 693 million by year 2045 (Ogurtsova et al., 2017).                        review found that supplementation with cinnamon could decrease
    About 5 million deaths all over the world were attributable to                       serum levels of glucose, without changes in other glycemic and
    Diabetes in year 2017. According to second National Diabetes                         anthropometric indices (Namazi et al., 2019). Literature review
    Survey of Pakistan (NDSP), conducted from February 2016 to                           also suggested that cinnamon could be recommended as effective
    August 2017, prevalence of Diabetes in Pakistan was 26.3%,                           therapy to reduce fasting glucose levels and HbA1c levels in
    out of which 19.2% were known diabetics, and 7.1% were                               type II diabetics. For this purpose, cinnamon dose could range
    newly diagnosed cases(Basit et al., 2018). Clinical evidence                         from 1 g to 6 g daily with meals (Ge et al., 2017; Maddox, 2016)
    suggests that T2DM and its complications can be prevented                            randomized controlled trial found that intake of 1 g of cinnamon
    through regular intake of functional foods (Alkhatib et al., 2017;                   for 12 weeks could decrease fasting blood glucose and HbA1c
    Venkatakrishnan et al., 2019).                                                       among uncontrolled type 2 diabetes patients (Sahib, 2016).
         Cinnamon extract seems to contain substances which can                          In another study, diabetic patients were supplemented with
    upregulate glucose uptake, increase glycogen synthesis, inhibit                      one gram of cinnamon daily. This resulted in improvement of
    glycogen breakdown, and reduce glucose absorption in the small                       BMI, glycemic indices (i.e. fasting glucose, 2 hours PP, HbA1C,
    gut through their effect on various enzymes (Ilijeva & Buchbauer,                    fasting insulin, and insulin resistance), and lipid profile (i.e.
    2016; Jahangir et al., 2017; Mollazadeh & Hosseinzadeh,                              total cholesterol, LDL and HDL) in the cinnamon group, when
    2016; Muhammad & Dewettinck, 2017). On the other                                     compared with the placebo group. All these changes were more
    hand, three components of Fenugreek, namely, Diosgenin,                              prominent in patients who had BMI≥27. Hence inconsistency
    4-hydroxyisoleucine (4-OHIle), and the fiber component, are                          of results amongst various studies were thought to be due to the

    Received 08 Sept., 2020
    Accepted 16 Oct., 2020
    1
     Department of Environmental Design Health & Nutritional Sciences, Allama Iqbal Open University – AIOU, Islamabad, Pakistan
    *Corresponding author: zaheer_863@yahoo.com

    Food Sci. Technol, Campinas,      Ahead of Print, 2021                                                                                           1/7 1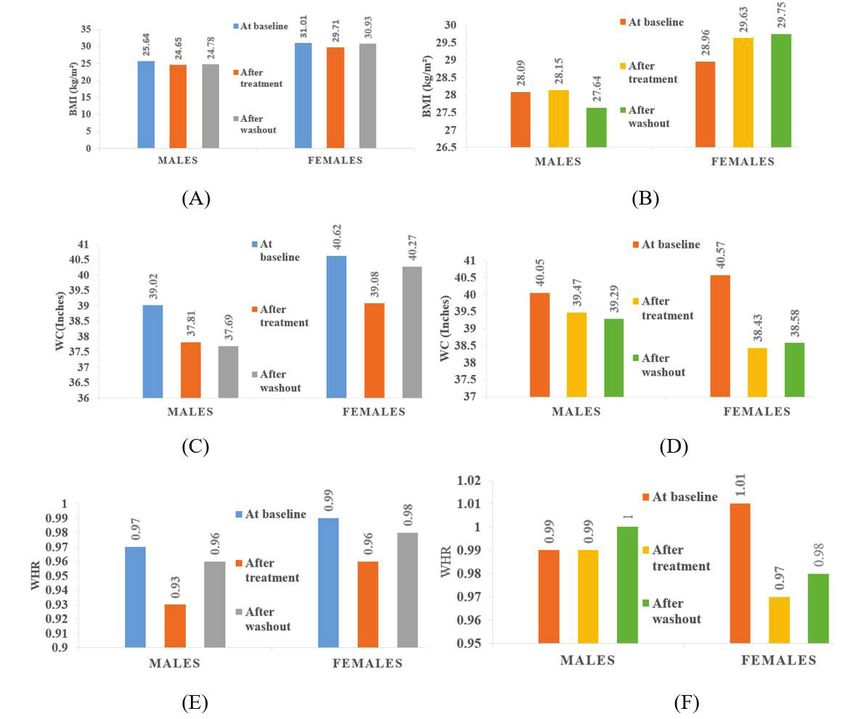
Effect of Fenugreek and Cinnamon on management of T2DM
difference in doses and duration of intervention as well as due
to difference in baseline BMI (Zare et al., 2019).
Fenugreek was also found to have hypoglycemic and cholesterol-
lowering effect (Gong, J., et al., 2016). Fenugreek extract was
found to cause significant reduction in fasting plasma glucose and
post-prandial blood glucose levels (Verma et al., 2016). A study
showed that adjunct therapy of a standardized fenugreek seed
extract (IND-2) with insulin in T2DM patients improved blood
glucose control through a reduction in levels of HbA1c and also
through reduction of insulin doses per day, without any increase
in risk of hypoglycemia and body weight (Kandhare et al., 2018).
Another standardized fenugreek seed extract (IDM1) was also
found to be an effective adjuvant therapy with sulphonylurea,
which helped to control blood sugar levels and HbA1c levels in
those T2DM patients in which these parameters were inadequately
controlled with sulfonylurea alone (Kandhare et al., 2018).
In rat models, the aqueous sprout extracts from IL8 Fenugreek
seed genotype showed much higher hypoglycemic activity as
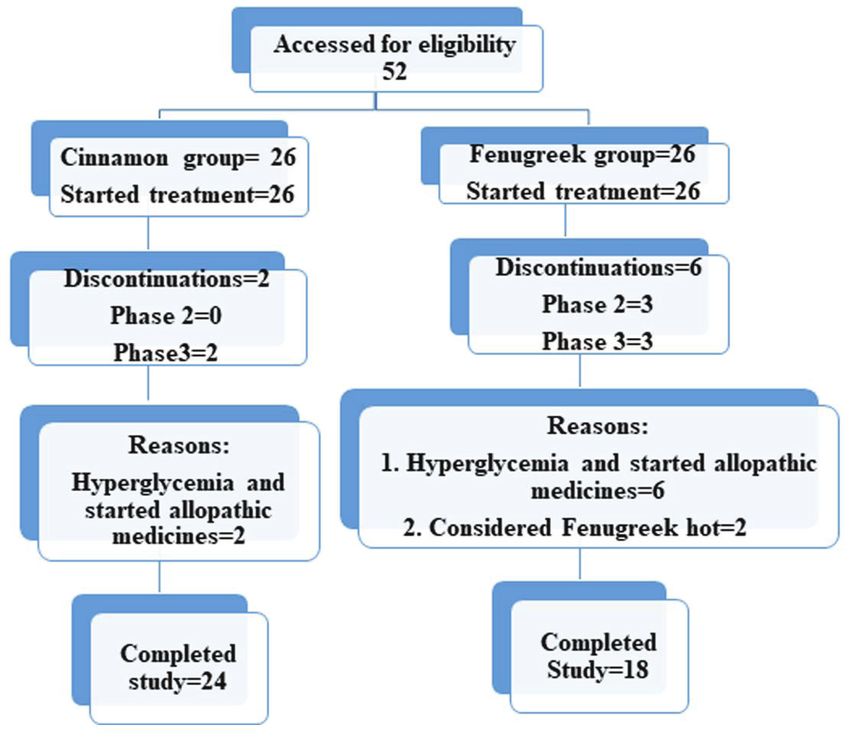
compared to its seed extract. This antidiabetic effect of sprout Figure 1. Flow diagram of the participants of the study.
extracts was found to be comparable to standard antidiabetic
drug, Voglibiose (Laila et al., 2016). Another study showed at the start of intervention. Phase-2 was at the end of 90 days of
that consumption of sprouted fenugreek seeds had significant intervention i.e., treatment with Fenugreek and cinnamon. In
effects on improving blood glucose levels, BMI, and BP in type second phase, counseling for diet & life style modification was
II diabetic patients (Khan & Khosla, 2018). Thus, Fenugreek can also done. Phase-3 was the phase after one month of stopping
be possibly used as a complementary therapy to anti-diabetic the intervention. It was considered to be the washout period. At
drugs, in order to control blood glucose (Najdi et al., 2019). the end of phase 2 and phase 3, all these tests were repeated to
As per literature now study has been conducted on Pakistani find out any difference in pre- and post-intervention findings.
diabetic population. Keeping in mind above scenario current Anthropometry, biochemical, clinical and dietary aspects
study has been designed to study the comparative impact of were also studied in all phases of the study to evaluate effect
fenugreek and background impact of above mentioned two of intervention.
nutraceuticals Fenugreek and Cinnamon.
Treatments were prepared in the form of powders and
packed in capsules before being dispensed to the patients as
2 Materials and methods depicted below:
A Randomized Controlled Trial (RCT) was done to compare
the effects of Fenugreek and Cinnamon on management of 1. Cinnamon group: 4.0 grams cinnamon powder/day, was
newly diagnosed cases of Type2 DM. The study was conducted divided into three doses of 3 +3+2 capsules, after each
at Medical Outpatient Department (OPD) of Pakistan Institute main meal i.e., breakfast, lunch and dinner. Each capsule
of Medical Sciences (PIMS), which is a tertiary care hospital, had 500mg of cinnamon powder;
located in Islamabad, capital of Pakistan. Subjects were enrolled
2. Fenugreek group: 20 grams powder/day, was divided into
for the study after fulfilling all ethical considerations.
four doses of 10+10+10+10 capsules, after breakfast, lunch,
All subjects, from both genders, fell within the age range of evening snack and dinner.
40-65 years. All were newly diagnosed cases of T2DM. They were
diagnosed diabetic on the basis of fasting plasma glucose (FPG), Statistical analysis was done on SPSS (version 22). Descriptive
in accordance with the criteria given by American Diabetes analysis was done for percentages and means. Paired-sample
Association (2014). Twenty-six (26) subjects were allotted to T-tests and Independent sample T-tests were done to compare
each group (Figure 1). Baseline data included assessment of the effects of interventions. A p-value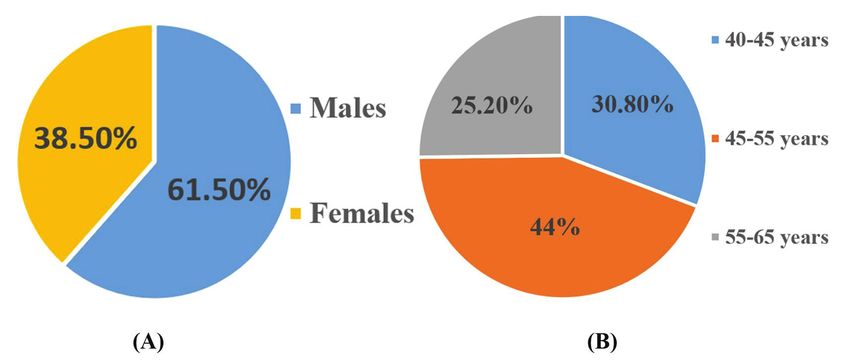
Ahmad et al.

Age group, highest in percentage, was 45-55 years (44%). Rest of       3.3 Comparison of biochemical markers during all phases of
the participants were below (40-45 years, 16%) and above               intervention
(55-65 years, 13%) this age group (Figure 2B).
                                                                            In Cinnamon group, mean Fasting Plasma Glucose (FPG)
                                                                       in males, at baseline, was 152.38 mg/dL, and in females was
3.2 Comparison of anthropometric measurements during all               160.31 mg/dL. It reduced after treatment in both males and females.
phases of intervention                                                 FBS reduced further in both males and females, at the end of
     Mean BMI of male participants at baseline in Cinnamon             washout period (Table 1). Similarly, in Fenugreek group, mean
group was 25.64 kg/m2, while mean BMI of female participants           FPG in males, at baseline, was 154.79 mg/dL, and in females was
in this group was 31.01 kg/m2. At the end of treatment, BMI            139.29 mg/dL, which reduced in both males and females after
of male and female participants reduced to 24.65 kg/m2 and             treatment. FBS reduced further in both males and females at
29.71 kg/m2, respectively. This result was consistent with a           the end of washout period (Table 1). Many studies had shown
study which showed reduction in BMI when one gram daily                beneficial effects of Cinnamon and Fenugreek on FPG (Maddox,
dose of cinnamon was used for intervention (Zare et al., 2019).        2016; Verma et al., 2016).
After washout period, BMI increased to 24.78 kg/m2 and 30.93 kg/m2          In Cinnamon group, HbA1c%age reduced in both males
in males and females, respectively (Figure 3A, B). While in            and females after treatment phase. It reduced further in both
Fenugreek group, mean BMI of male participants at baseline was         genders after washout period. Similarly, in Fenugreek group,
28.09 kg/m2, and in female participants BMI was 28.96 kg/m2,           HbA1c%age reduced in both male and female participants after
respectively. At the end of treatment, BMI increased to 28.15 kg/m2    treatment (Table 1). Although after washout period, it reduced
in males and to 29.63 kg/m2 in female participants, but after          further in male group, but increased again in female participants.
washout period, BMI was reduced to 27.64 kg/m2 in females, and         These findings were consistent with many findings in literature
increased to 29.75 kg/m2 in females. This result was inconsistent      (Kandhare et al., 2018; Maddox, 2016; Sahib, 2016). Mean Insulin
with literature which showed improvement in BMI with use of            levels also decreased in both male and female participants, in
Fenugreek (Khan & Khosla, 2018).                                       both intervention groups. It kept falling in washout period
     Similarly, mean waist circumference (WC) and waist-to-hip         in all these groups, except in female participants in Fenugreek
ratio (WHR) of both male and female participants in Cinnamon           group. This finding was consistent with literature in regard to
group, reduced in both male and female participants after              Cinnamon, but no such positive finding was reported in case
treatment. After washout period, WC reduced further, but WHR           of Fenugreek (Zare et al., 2019). Serum cholesterol level was
bounced back in males, while in females, WC and WHR increased          found to decrease in both treatment and washout periods, in
(Figure 3C and 3E). Mean waist circumference (WC) of male              both intervention groups, in both genders. On the other hand,
participants was reduced after treatment, in Fenugreek group,          serum HDL was found to increase in both treatment and washout
but WHR remained same in males, and both WC and WHR                    periods, in both intervention groups, in both genders (Table 1).
were reduced in female participants. After washout period, WC          Serum LDL decreased in both treatment and washout periods,
reduced further, but WHR increased in males, while both WC             in both Cinnamon and Fenugreek groups, in both male and
and WHR increased, in females (Figure 3D-F). Though variable           female participants, except for male group in Fenugreek group,
beneficial effects of these nutraceuticals were found on WC and        where the level of LDL bounced up in washout period. Serum
WHR in this study, no such effects were found in literature.           VLDL decreased in both genders in Cinnamon group after

Figure 2. (A) Gender distribution (B) Age distribution.

Food Sci. Technol, Campinas,      Ahead of Print, 2021                                                                              3/7 3
Effect of Fenugreek and Cinnamon on management of T2DM
Figure 3. Body Mass Index (BMI) of study subjects: (A) Cinnamon group (B) Fenugreek group; Waist Circumferences (WC) of study subjects:
(C) Cinnamon group (D) Fenugreek group; Waist Hip Ratio of study subjects: (E) Cinnamon group (F) Fenugreek group.
treatment and remained the same after washout period. On the Paired-sample t-test was run on means of measures of both
other hand, in Fenugreek group, it increased in male group, and interventional groups as a whole (i.e. including both genders), at
stayed high even after washout period, but in female group, it baseline and after-treatment. Significant differences were found
decreased and remained low after washout period. Serum TG between mean values of many anthropometric and biochemical
(serum triglyceride) levels decreased in Fenugreek group in both measures. There was statistically significant difference in BMI in
genders, and in female group in Cinnamon group, after treatment, Cinnamon group after intervention, but no such difference was
and increased again in washout period, but it increased in male found in Fenugreek group. Significant difference was found in
group, in Cinnamon group, and then fell back after washout WC in both intervention groups, but no significant difference was
period Once again this finding was consistent with literature found in WHR. FPG and HbA1c showed statistically significant
when Cinnamon was considered, but it was a new finding in difference after intervention in both groups, but Insulin level fell
regard to Fenugreek (Zare et al., 2019). significantly only in Cinnamon group. Serum Cholesterol level
In summary, the results showed significant effect of Cinnamon fell significantly in both groups, but LDL level fell significantly
and Fenugreek intervention on various biochemical parameters. only in Cinnamon group. Similarly, serum triglycerides level
FPG and HbA1c fell significantly in both groups, but Insulin level fell significantly only in Fenugreek group, but rather increased
fell significantly only in Cinnamon group. Cholesterol level fell insignificantly in Cinnamon group. Serum HDL level increased
in both groups, HDL increased and LDL fell significantly only significantly in Cinnamon group, but not in Fenugreek group.
in Cinnamon group, and TG level fell only in Fenugreek group. No statistically significance was found in levels of VLDL in both
4 4/7 Food Sci. Technol, Campinas, Ahead of Print, 2021Ahmad et al.
Table 1. Comparison of Biochemical marker level in both groups, in all phases of intervention.
Cinnamon Fenugreek
Biochemical markers
Mean N SD* Mean N* SD
FPG* (mg/dL) at baseline 156.35 26 32.74 150.62 26 26.83
FPG (mg/dL) at end of treatment phase 139.5 26 35.23 133.61 23 29.73
FPG (mg/dL) at end of wash out period 129.38 24 18.75 129 18 25.51
HbA1C (%) at baseline 7.95 26 1.12 7.6 26 1.14
HbA1C (%) at the end of treatment period 6.52 26 1.05 6.13 23 1.06
HbA1C (%) at the end of wash out period 6.32 24 0.94 6.28 18 1.18
Insulin in µIU/mL at baseline 26.34 26 20.95 30.12 26 28.84
Insulin (µIU/mL) at the end of treatment phase 18.52 26 11.82 24.03 23 11.72
Insulin (µIU/mL) at the end of wash out period 17.01 24 12.11 21.34 18 11.9
Cholesterol level (mg/dL)at baseline 188.31 26 36.23 202.23 26 33.58
Cholesterol (mg/dL) at end of treatment phase 175.23 26 37.52 185.52 23 33.96
Cholesterol (mg/dL) at the end of wash out period 157.83 24 25.23 175 18 22.93
HDL* (mg/dL) at baseline 39.58 26 9.63 41.27 26 14.73
HDL (mg/dL) at the end of treatment phase 44.04 26 11.28 43.52 23 10.6
HDL (mg/dL) at the end of wash out period 46.25 24 9.75 45.56 18 13.45
LDL* (mg/dL) at baseline 117.42 26 36.35 113.77 26 37.77
LDL (mg/dL) at the end of treatment phase 102.73 26 37.72 105.91 23 30.94
LDL (mg/dL) at the end of wash out period 92.67 24 33.39 106.33 18 28.11
VLDL* (mg/dL) at baseline 34.61 26 21.69 45.34 26 21.32
VLDL (mg/dL) at end of treatment phase 32.26 24 12.85 44.06 18 24.09
VLDL (mg/dL) at end of washout period 32.26 24 12.85 44.06 18 24.09
Triglyceride level (mg/dL) at baseline 173.04 26 108.4 226.69 26 106.59
Triglyceride level (mg/dL) at end of treatment phase 180.12 26 90.41 194.52 23 80.48
Triglyceride level (mg/dL) at end of wash out period 161.29 24 64.23 220.28 18 120.47
SD*: Standard Deviation; N*: Number; FPG: Fasting Plasma Glucose; HDL: High-density lipoprotein; LDL: Low-density lipoprotein; VLDL: Very low-density lipoprotein. HbA1c:
glycated haemoglobin
groups. When Independent- sample T-test was done, statistically of Diabetes is increasing, and incomes at both national and
significant difference was found only in levels of VLDL after individual levels are low. Wherever such data exists, it suggests
treatment (Table 2). that use of medical care associated with Diabetes is not within
Hence, when results of treatment were compared between reach for many patients (Williams et al., 2020). Hence, use of
both groups, no significant difference was found in any functional foods can be recommended as adjunct to medical
anthropometric measure, reflecting that wherever there was treatment to reduce the requirement of medication and hence
significant effect of both interventions on same parameter, it reduce the cost of treatment.
was of similar magnitude. Similarly, Independent-sample tests
showed change of similar magnitude in both groups, in regard 4 Conclusion
to FPG, HbA1c and Insulin levels. The changes in cholesterol
level, HDL, LDL, and TG levels were also similar in magnitude Cinnamon seemed to have more effect on both anthropometric
in both groups, as no statistically significant difference was found (BMI & WC) and biochemical (FPG, HbA1c, serum Insulin,
when independent sample means were compared. VLDL did serum cholesterol, HDL & LDL) parameters, as compared
not change significantly in any group. to Fenugreek, which had effect on WC, FPG, HbA1c, serum
cholesterol and TG only. Although, the magnitude of these
The costs of Diabetes present huge financial problems to
patients, healthcare systems, and insurers (Riddle & Herman, effects was similar in both groups. Its concluded that the use of
2018). The average monthly medical expenditure has been natural nutraceuticals may help in managing the sugar level of
found to be significantly higher for households who were on newly diagnosed patient. Especially study finding can help to
Diabetes medication, as compared to households who were not rural community where people are reluctant to use the allopathic
(Datta et al., 2019). The healthcare expenditure on Diabetic medicine for treating the diabetes.
patients all over the world by year 2017 was 850 billion US dollars
(Ogurtsova et al., 2017). In USA, more than 29 million people Acknowledgements
have Diabetes and this costs US healthcare system 245 billion
dollars annually (Sai Ambati et al., 2019; Willey et al., 2018). We are thankful to the management of Pakistan Institute
Enough data, regarding expenditure on Diabetes treatment, of Medical Sciences, particularly Head of the Department of
does not exist in low-income countries, where prevalence Medicine for facilitating in data collection from their premises.
Food Sci. Technol, Campinas, Ahead of Print, 2021 5/7 5Effect of Fenugreek and Cinnamon on management of T2DM
Table 2. Paired Statistics for anthropometric measures & biochemical markers in both groups.
Mean N* SD* p-value
BMI (in kg/m2) at baseline 28.32 26 6.20
Cinnamon group: 0.000
BMI (in kg/m2) at the end of treatment phase 27.18 26 5.61
BMI (in kg/m2) at baseline 27.42 23 4.86
Fenugreek group 0.342
BMI (in kg/m2) at the end of treatment phase 28.60 23 4.03
WC (in inches) at baseline 39.82 26 4.79
Cinnamon group: 0.001
WC (in inches) at the end of treatment phase 38.44 26 4.05
WC (in inches) at baseline 40.48 23 3.60
Fenugreek group 0.001
WC (in inches) at the end of treatment phase 39.15 23 3.35
FPG (in mg/dl) at the end of treatment phase 156.35 26 32.73
Cinnamon group: 0.028
FPG (in mg/dL) at the end of treatment phase 139.50 26 35.22
FPG (in mg/dL) at baseline 145.61 23 22.25
Fenugreek group 0.029
FPG (in mg/dL) at the end of treatment phase 133.61 23 29.73
HbA1C percent at baseline 7.95 26 1.12
Cinnamon group: 0.000
HbA1C percent at the end of treatment period 6.52 26 1.05
HbA1C percent at baseline 7.64 23 1.02
Fenugreek group 0.000
HbA1C percent at the end of treatment period 6.13 23 1.06
Insulin (in µIU/mL) at baseline 26.34 26 20.95
Cinnamon group: 0.020
Insulin (in µIU/mL) at the end of treatment phase 18.52 26 11.82
Insulin in µIU/mL at baseline 30.38 23 29.89
Fenugreek group 0.305
Insulin in µIU/mL at the end of treatment phase 24.03 23 11.72
Cholesterol level (in mg/dL) at baseline 188.31 26 36.23
Cinnamon group: 0.025
Cholesterol level(in mg/dL) at the end of treatment phase 175.23 26 37.52
Cholesterol level at baseline 201.65 23 35.45
Fenugreek group 0.004
Cholesterol level at the end of treatment phase 185.52 23 33.96
HDL (in mg/dL) at baseline 39.58 26 9.63 0.014
Cinnamon group:
HDL (in mg/dL) at the end of treatment phase 44.04 26 11.28
HDL (in mg/dL) at baseline 40.83 23 15.58
Fenugreek group 0.237
HDL (in mg/dL) at the end of treatment phase 43.52 23 10.60
LDL (in mg/dL) at baseline 117.42 26 36.35
Cinnamon group: 0.043
LDL (in mg/dL) at the end of treatment phase 102.73 26 37.72
LDL at baseline 111.52 23 39.51
Fenugreek group 0.218
LDL at the end of treatment phase 105.91 23 30.94
Triglyceride level (in mg/dL) at baseline 173.04 26 108.45
Cinnamon group: 0.723
Triglyceride level (in mg/dL) at the end of treatment phase 180.12 26 90.41
Triglyceride level (in mg/dL) at baseline 234.09 23 110.46
Fenugreek group 0.003
Triglyceride level (in mg/dL) at the end of treatment phase 194.52 23 80.48
SD: Standard Deviation; N: Number; BMI: Body Mass Index; WC: Waist Circumferences; FPG: Fasting Plasma Glucose; HDL: High-density lipoprotein; LDL: Low-density lipoprotein;
VLDL: Very low-density lipoprotein BMI: Body mass index WC: Waist circumference
References Basit, A., Fawwad, A., Qureshi, H., & Shera, A. (2018). Prevalence of
diabetes, pre-diabetes and associated risk factors: second National
Acevedo, M. E., Cerda, R. E. B., Rodriguez, R. M., Trevino, A., Gallegos, Diabetes Survey of Pakistan (NDSP), 2016-2017. BMJ Open,
C. F., & Charles, A. V. (2017). Functional foods tested in vivo and in 8(8), e020961. http://dx.doi.org/10.1136/bmjopen-2017-020961.
vitro as a complement or substitution in the pharmacological treatment PMid:30082350.
of diabetes. Scientific Journal of Food Science & Nutrition, 3(11).
Choudhury, H., Pandey, M., Hua, C. K., Mun, C. S., Jing, J. K., Kong, L.,
Alkhatib, A., Tsang, C., Tiss, A., Bahorun, T., Arefanian, H., Barake, R., Ern, L. Y., Ashraf, N. A., Kit, S. W., Yee, T. S., Pichika, M. R., Gorain,
Khadir, A., & Tuomilehto, J. (2017). Functional foods and lifestyle B., & Kesharwani, P. (2017). An update on natural compounds in
approaches for diabetes prevention and management. Nutrients, the remedy of diabetes mellitus: A systematic review. Journal of
9(12), 1310. http://dx.doi.org/10.3390/nu9121310. PMid:29194424. Traditional and Complementary Medicine, 8(3), 361-376. http://
American Diabetes Association – ADA. (2014). Executive summary: dx.doi.org/10.1016/j.jtcme.2017.08.012. PMid:29992107.
standards of medical care in diabetes – 2014. Arlington: ADA. Costello, R. B., Dwyer, J. T., Saldanha, L., Bailey, R. L., Merkel,
Avalos-Soriano, A., De la Cruz-Cordero, R., Rosado, J. L., & Garcia-Gasca, T. J., & Wambogo, E. (2016). Do cinnamon supplements have a role in
(2016). 4-Hydroxyisoleucine from fenugreek (Trigonella foenum-graecum): glycemic control in type 2 diabetes? A narrative review. Journal of
effects on insulin resistance associated with obesity. Molecules, 21(11), the Academy of Nutrition and Dietetics, 116(11), 1794-1802. http://
1596. http://dx.doi.org/10.3390/molecules21111596. PMid:27879673. dx.doi.org/10.1016/j.jand.2016.07.015. PMid:27618575.
6 6/7 Food Sci. Technol, Campinas, Ahead of Print, 2021Ahmad et al.
Datta, B. K., Husain, M. J., & Asma, S. (2019). Assessing the relationship Ota, A., & Ulrih, N. P. (2017). An overview of herbal products and
between out-of-pocket spending on blood pressure and diabetes secondary metabolites used for management of type two diabetes.
medication and household catastrophic health expenditure: evidence Frontiers in Pharmacology, 8, 436. http://dx.doi.org/10.3389/
from Pakistan. International Journal for Equity in Health, 18(1), 9. fphar.2017.00436. PMid:28729836.
http://dx.doi.org/10.1186/s12939-018-0906-x. PMid:30646905. Riddle, M. C., & Herman, W. H. (2018). The cost of diabetes care: an
Ge, Q., Chen, L., & Chen, K. (2017). Treatment of diabetes mellitus using elephant in the room. Diabetes Care, 41(5), 929-932. http://dx.doi.
iPS cells and spice polyphenols. Journal of Diabetes Research, 2017, org/10.2337/dci18-0012. PMid:29678864.
5837804. http://dx.doi.org/10.1155/2017/5837804. PMid:28758131. Sahib, A. S. (2016). Anti-diabetic and antioxidant effect of cinnamon in
Ilijeva, R., & Buchbauer, G. (2016). Biological properties of some volatile poorly controlled type-2 diabetic Iraqi patients: a randomized, placebo-
phenylpropanoids. Natural Product Communications, 11(10), 1619. controlled clinical trial. Journal of Intercultural Ethnopharmacology,
http://dx.doi.org/10.1177/1934578X1601101041. PMid:30549629. 5(2), 108-113. http://dx.doi.org/10.5455/jice.20160217044511.
PMid:27104030.
Jahangir, M. A., Shehzad, A., Butt, M. S., & Shahid, M. (2017).
Therapeutic potential of cinnamomum zeylanicum extract to Sai Ambati, L., El-Gayar, O., & Nawar, N. (2019). Understanding
mitigate hyperglycemia. Annals of King Edward Medical University, the influence of digital divide and socio-economic factors on the
prevalence of diabetes. In Annual Research Symposium. Madison:
23(2). http://dx.doi.org/10.21649/akemu.v23i2.1586.
Dakota State University.
Kandhare, A., Phadke, U., Mane, A., Thakurdesai, P., & Bhaskaran, S.
Shahzad, S. A., Hussain, S., Mohamed, A. A., Alamri, M. S., Qasem,
(2018). Add-on therapy of herbal formulation rich in standardized
A. A. A., Ibraheem, M. A., Almaiman, S. A. M., & El-Din, M. F. S.
fenugreek seed extract in type 2 diabetes mellitus patients with insulin
(2020). Gluten-free cookies from sorghum and Turkish beans; effect
therapy: an efficacy and safety study. Asian Pacific Journal of Tropical of some non-conventional and commercial hydrocolloids on their
Biomedicine, 8(9), 446. http://dx.doi.org/10.4103/2221-1691.242288. technological and sensory attributes. Food Science and Technology.
Khan, F., & Khosla, P. (2018). To study the effect of sprouted fenugreek In press. http://dx.doi.org/10.1590/fst.25419.
seeds as nutraceutical as an add-on therapy in patients of diabetes Shi, X., Miyakawa, T., Nakamura, A., Hou, F., Hibi, M., Ogawa, J., Kwon,
mellitus, obesity and metabolic syndrome. Pharmacy & Pharmacology Y., & Tanokura, M. (2017). Engineering a short-chain dehydrogenase/
International Journal, 6(4), 320-327. http://dx.doi.org/10.15406/ reductase for the stereoselective production of (2 S, 3 R, 4 S)-4-
ppij.2018.06.00195. hydroxyisoleucine with three asymmetric centers. Scientific Reports,
Laila, O., Murtaza, I., Abdin, M., & Showkat, S. (2016). Germination 7(1), 13703. http://dx.doi.org/10.1038/s41598-017-13978-w.
of fenugreek seeds improves hypoglycaemic effects and normalizes Siener, R., Seidler, A., & Hönow, R. (2020). Oxalate-rich foods. Food
insulin signilling pathway efficiently in diabetes. International Journal Science and Technology. In press. http://dx.doi.org/10.1590/fst.10620.
of Pharmaceutical Sciences and Research, 7(4), 1535. Venkatakrishnan, K., Chiu, H.-F., & Wang, C.-K. (2019). Popular
Maddox, P. J. (2016). Cinnamon in the treatment of Type II diabetes. functional foods and herbs for the management of type-2-diabetes
Journal of Interdisciplinary Graduate Research, 2, 2-20. mellitus: a comprehensive review with special reference to clinical
Mollazadeh, H., & Hosseinzadeh, H. (2016). Cinnamon effects on trials and its proposed mechanism. Journal of Functional Foods, 57,
metabolic syndrome: a review based on its mechanisms. Iranian 425-438. http://dx.doi.org/10.1016/j.jff.2019.04.039.
Journal of Basic Medical Sciences., 19(12), 1258-1270. PMid:28096957. Verma, N., Usman, K., Patel, N., Jain, A., Dhakre, S., Swaroop, A., Bagchi,
Muhammad, D. R. A., & Dewettinck, K. (2017). Cinnamon and its M., Kumar, P., Preuss, H. G., & Bagchi, D. (2016). A multicenter
derivatives as potential ingredient in functional food: a review. clinical study to determine the efficacy of a novel fenugreek seed
(Trigonella foenum-graecum) extract (Fenfuro™) in patients with
International Journal of Food Properties, 20(Suppl 2), 2237-2263.
type 2 diabetes. Food & Nutrition Research, 60(1), 32382. http://
http://dx.doi.org/10.1080/10942912.2017.1369102.
dx.doi.org/10.3402/fnr.v60.32382. PMid:27733237.
Najdi, R. A., Hagras, M. M., Kamel, F. O., & Magadmi, R. M. (2019). A
Willey, V. J., Kong, S., Wu, B., Raval, A., Hobbs, T., Windsheimer, A.,
randomized controlled clinical trial evaluating the effect of Trigonella
Deshpande, G., Tunceli, O., Sakurada, B., & Bouchard, J. R. (2018).
foenum-graecum (fenugreek) versus glibenclamide in patients with Estimating the real-world cost of diabetes mellitus in the United
diabetes. African Health Sciences, 19(1), 1594-1601. http://dx.doi. States during an 8-year period using 2 cost methodologies. American
org/10.4314/ahs.v19i1.34. PMid:31148988. Health & Drug Benefits, 11(6), 310-318. PMid:30464797.
Namazi, N., Khodamoradi, K., Khamechi, S. P., Heshmati, J., Ayati, M. Williams, R., Karuranga, S., Malanda, B., Saeedi, P., Basit, A., Besançon, S.,
H., & Larijani, B. (2019). The impact of cinnamon on anthropometric Bommer, C., Esteghamati, A., Ogurtsova, K., Zhang, P., & Colagiuri, S.
indices and glycemic status in patients with type 2 diabetes: A (2020). Global and regional estimates and projections of diabetes-related
systematic review and meta-analysis of clinical trials. Complementary health expenditure: results from the International Diabetes Federation
Therapies in Medicine, 43, 92-101. http://dx.doi.org/10.1016/j. Diabetes Atlas. Diabetes Research and Clinical Practice, 162, 108072.
ctim.2019.01.002. PMid:30935562. http://dx.doi.org/10.1016/j.diabres.2020.108072. PMid:32061820.
Ogurtsova, K., Rocha Fernandes, J., Huang, Y., Linnenkamp, U., Guariguata, Zare, R., Nadjarzadeh, A., Zarshenas, M. M., Shams, M., & Heydari,
L., Cho, N. H., Cavan, D., Shaw, J. E., & Makaroff, L. E. (2017). IDF M. (2019). Efficacy of cinnamon in patients with type II diabetes
Diabetes Atlas: Global estimates for the prevalence of diabetes for mellitus: a randomized controlled clinical trial. Clinical Nutrition,
2015 and 2040. Diabetes Research and Clinical Practice, 128, 40-50. 38(2), 549-556. http://dx.doi.org/10.1016/j.clnu.2018.03.003.
http://dx.doi.org/10.1016/j.diabres.2017.03.024. PMid:28437734. PMid:29605574.
Food Sci. Technol, Campinas, Ahead of Print, 2021 7/7 7You can also read